WattApp: An Application Aware Power Meter for Shared Data Centers Ricardo Koller Akshat Verma Anindya Neogi Florida International University IBM India Research Lab Tivoli, IBM India Software Lab
[email protected] [email protected] [email protected]
ABSTRACT The increasing heterogeneity between applications in emerging virtualized data centers like clouds introduce significant challenges in estimating the power drawn by the data center. In this work, we present WattApp: an application-aware power meter for shared data centers that addresses this challenge. In order to deal with heterogeneous applications, WattApp introduces application parameters (e.g, throughput) in the power modeling framework. WattApp is based on a carefully designed set of experiments on a mix of diverse applications: power benchmarks, web-transaction workloads, HPC workloads and I/O-intensive workloads. Given a set of N applications and M server types, WattApp runs in O(N ) time, uses O(N × M ) calibration runs, and predicts the power drawn by any arbitrary placement within 5% of the real power for the applications studied.
Categories and Subject Descriptors C.4 [Performance of Systems]: Modeling techniques
General Terms Performance
Keywords Power Modeling
1.
INTRODUCTION
Energy management has emerged as one of the most challenging problems faced by data center administrators. According to an estimate [13] based on trends from American Society of Heating, Refrigerating and Air-Conditioning Engineers (ASHRAE)[11], by 2014, Infrastructure and Energy (I&E) costs would contribute about 75% while IT would contribute a significantly smaller 25% towards the overall total cost of operating a data center. The current power density of data centers is typically estimated to be in the range of 100 Watt per sq.ft. and growing at the rate of 15−20% per year [2]. Surveys by Data Center Institute[1] predict that unless corrective actions are taken, power failures and limits on power availability will halt data center operations at more than 90% of all companies
Permission to make digital or hard copies of all or part of this work for personal or classroom use is granted without fee provided that copies are not made or distributed for profit or commercial advantage and that copies bear this notice and the full citation on the first page. To copy otherwise, to republish, to post on servers or to redistribute to lists, requires prior specific permission and/or a fee. ICAC’10, June 7–11, 2010, Washington, DC, USA. Copyright 2010 ACM 978-1-4503-0074-2/10/06 ...$10.00.
within the next five years. Thus, energy is no longer a second class citizen and is getting a lot more emphasis in data center design. A second important trend in data centers has been the increased diversity of applications hosted on a shared server cluster. Outsourced data centers that host multiple customers and the emergence of the cloud paradigm for computing has led to such a scenario. Power management techniques have slowly evolved to this emerging reality by moving up from the hardware level to a middleware level. The early work in energy management had focused only on power-aware design of hardware and on mechanisms like Dynamic Voltage Frequency Scaling (DVFS) that reduce power consumption in a single server [24, 27]. While applications were hosted on standalone servers, such an approach was sufficient. However, as virtualized and shared data centers became common-place, techniques leveraging the reconfiguration capabilities offered by virtualization to manage power were designed that took cognizance of the heterogeneity between applications. Virtualization allows a provider to consolidate applications running on a large number of low utilization servers to a smaller number of highly utilized servers. Each application runs in its own Virtual Machine (VM), which provides the required isolation and protection from other applications. Further, virtualization platforms today provide the capability of migrating a virtual machine transparently from one server to another, thus enabling dynamic consolidation. A dynamic consolidation based approach allows server clusters to increase or decrease the number of operational servers by adapting to the workload intensity, thus enabling even higher energy efficiency [31, 32, 27, 16, 26]. The power drawn by a commercial server consists of a static component and a dynamic component. The static component of power is a fixed power drawn even if the server is not doing any processing. The dynamic component of power depends on the usage of various components of the server. For servers with a small dynamic range, power modeling is not relevant as the server power can always be approximated by the idle power. Earlier servers used to have a very large static component but the increased focus on energy awareness has resulted in vendors adding support to reduce power consumption in unused server components. Hence, there is a distinct trend towards increase in the dynamic power range. The ever-increasing dynamic range of server power makes power modeling a fundamental piece in power management, which is required to estimate the impact of various reconfiguration actions. Since the early work in power management was designed for homogeneous applications and focussed at the hardware layer, power modeling methodologies also implicitly assumed homogeneous applications. Hence, the impact of power management actions was modeled in an application-oblivious manner. Even though power management techniques have now become more inclusive and are
aware of heterogeneous applications, power modeling techniques still make this simplifying assumption. It has been observed that modeling power in an application-oblivious manner has significant errors for heterogeneous applications [31, 19].
1.1 CPU Utilization Based Modeling
• We employ our observations to design WattApp, a power meter, that takes a set of M servers and N applications and performs O(N × M ) calibration runs to build a power model. We validate WattApp on a new set of applications (Linpack, daxpy, fma) to verify that the principles behind the design of WattApp are not tied to a specific class of applications. WattApp reduces error by up-to 10 times over the utilizationbased predictor most commonly used, achieving an accuracy of 95% on many real application and benchmarks. Further, W attApp uses a Server Stealing technique to ensure that power models can be built with minimum disruption in a production server farm.
200 y = 0.44*x + 124 y = (1+-0.2)*0.44*x + 124
Power in Watts
180
160
140 TPC-WTPC-W- 3 VM TPC-W SpecPower Domino Domino-
120
build accurate power models. Our most important result is to establish that a linear combination of the power models for individual applications (at their virtualization ratio) can estimate the power drawn by a mix of applications.
100 0
20
40
60
80
100
CPU utilization in percentage
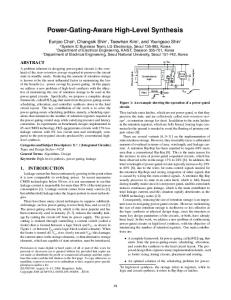
Figure 1: Power Vs CPU Utilization for all TPC-W, SpecPower, Domino and variants. TPC-W- is a variant of TPC-W that does not load images. TPC-W- 3VM is clustered TPC-W- running on 3VMs hosted on the same server. Domino- is a variant of Domino with small number (10) of users.
The rest of the paper is organized as follows. In Sec. 2, we detail the usage and requirements for a power model. We describe our experimental tested in Sec. 3 and establish the relationship between power and application throughput in Sec. 4. We extend our observations to multiple applications in Sec. 5 and use them to design and validate WattApp in Sec. 6. We conclude with a discussion of the related work in Sec. 7.
CPU utilization based power models are the most popular in practise because of their inherent simplicity. Since the static component of a server power if fixed, the accuracy of a power model lies in its ability to predict the dynamic power consumed by a server. Hence, we first study the Accuracy of an application-oblivious CPU utilization driven model to predict the dynamic power usage on a given server. Fig. 1 shows the power drawn by a server at different CPU utilization for T P C − W (a web serving workload [10]), Domino (a commercial mail server [5]), SpecPower (a server power benchmark [8]) and variants of the same. We observe a wide disparity in the observed values of power at the same utilization for different applications. We note that there are many points beyond the ±20% error range (solid lines in Fig. 1) of the fitted dynamic power curve, indicating an error greater than 40%. I/O bound applications like Domino tend to have higher power consumption relative to other applications at low CPU utilization. However, since I/O bound applications do not use many compute components significantly (e.g., Floating Point Units (FPUs)), the increase in power with increased CPU utilization is much lower for these applications. Further, these applications may get bottlenecked by another resource and the range of CPU utilization may be low (e.g., 30% for Domino). Hence, the model is not even defined for higher CPU utilization, implying the need of a different input parameter in modeling. This clearly underlines the requirement of a better model for estimating server power.
2. POWER MODELING: USAGE AND REQUIREMENTS
1.2 Contribution
(a) (b) Figure 2: (a) Power-aware Dynamic Consolidation (b) Candidate Placement
In this work, we introduce application-awareness in power modeling and present WattApp, an application-level power meter for shared data centers hosting heterogeneous applications. Our key contributions are • We establish a linear relationship between marginal power and marginal application throughput (number of jobs executed per second) on a diverse set of enterprise applications and benchmarks (TPC-W, SpecPower, Domino). We show that incorporating the virtualization ratio 1 is important to 1
Virtualization Ratio is defined as the number of VMs on a server
2.1 Power Modeling Use Case The emergence of virtualization and live migration of virtual machines (VM) have led to a scenario where a server may host multiple applications and possible power management actions include migrating these applications to other servers in the farm. The flow in a power-aware placement controller (for example, refer to [31, 26, 33]) consists of (i)Application Usage Prediction (ii) Candidate Placement Generation and (iii) Final Placement Decision (Fig. 2(a)). The Placement Controller needs to compare various candidate placements with respect to (i) the estimated power consumed and (ii) the performance of all applications in that placement. A Power Modeler provides an answer to the first question, helping the Placement Controller to make a decision. App Usage Data App Profiler 1. Predicted App Usage Power Modeler
VM1 VM3
Server1
VM4
ServerM
Placement Generator 2. Candidate Placement Power Placement
Estimate
Controller 3. Final Placement
VM6 Candidate Placement
The input to the Power Modeler component is a placement of applications on servers (Fig. 2(b)). In addition to the above, certain characteristics of each application may be available. To take an example, an application A1 may be executing 100 daxpy operations per second on a virtual machine with an entitlement of 1.5 cores on a Power6 p570 server at 70% utilization in the current placement. Similarly, another application A2 may be executing 10 matrix transpose operations on a virtual machine with an entitlement
of 1.5 cores on the same Power6 p570 server at 50% utilization. In a new candidate placement, both of them may be moved to a virtual machine on a Power6 JS-22 blade with 2.0 cores each. Hence, in this case, the application throughput, characteristics of the source and target server, and the CPU utilization on the source server may be available. The Power Modeler should be able to infer the power drawn by the JS-22 blade for running the two applications from the available application data. In the past, the idle power of a processor constituted 80% of a server’s power and hence, many Placement Controllers rely on a coarse estimate of power (typically peak power of the server) to make their decision. However, the trend of an increasing dynamic (workload-dependent) range of the servers makes such an approach infeasible [12]. A look at different power models in [31, 32, 28] indicate that the dynamic power range is typically higher for HPC applications, underlining even more the necessity of an accurate power model for HPC applications.
2.2 Desirable Characteristics for a Power Model The key motivation for power modeling is to estimate the impact of various power management actions, before taking these actions. We now enumerate four important requirements, similar to [28], which are desirable in any good power estimation model. Further, a power model for shared servers need to deal with diverse applications, leading to a fifth requirement of Heterogeneity Support. 1. Accuracy: The static power drawn by a server if fixed and does not require any model. Hence, the accuracy of a power model captures its ability to predict the dynamic power of a server. Hence, we define the error in accuracy of a power model as the absolute difference between the predicted dynamic (active) power and the real dynamic power, normalized by the real dynamic power. 2. Usable Parameters: The input parameters of a power model should be readily available and monitored in server farms. Typically, a ’Usable’ model would require parameters that require no dedicated instrumentation code, has minimal overheads, and can be collected from user space. A survey of more than 100 data centers revealed that they only monitor high level system parameters that can be collected via standard tools (e.g, nmon). 3. Predictable Input: In a virtualized data center, an application is co-located with other applications on a shared physical server. With time, energy management actions would move the applications and both the hosted server and the colocated applications for a modeled application would change. A model with Predictable Input has input parameters that either do not change with reconfiguration or can be predicted after reconfiguration. Further, based on history, one should be able to make a short-term prediction of the parameter. 4. Speed: Once built (or calibrated), a good power model should be able to give an estimate of the power drawn by a candidate placement of N applications on M servers in a reasonable time (of the order of a second or less). 5. Heterogeneity Support: In a shared data center hosting heterogeneous applications, the model should be accurate for a diverse set of workloads hosted on the same physical server. Existing research in power modeling has tried to model power as a function of system parameters independent of the applications running on the server. We argue in this paper against such an application-oblivious power modeling approach and show that an accurate and practical power model for heterogeneous applications needs to be application aware. The motivation for an application
aware power model stems from two reasons:(i) System level power models based on easily available parameters like CPU utilization can have an error as high as 50% for heterogeneous applications (Fig. 1) (ii) More accurate system level power models are based on event counters like memory bandwidth that are not available on all platforms (not Usable). Even on platforms with available counters, they have associated overheads. We observed CPU overhead of more than 5% on an IBM JS-22 blade with Power6 processors using the hpmstat utility [6]. Most importantly, if an application moves from one server to another and the set of applications co-located with it change, the new event counters can not be inferred easily from the monitored values on the server it is currently placed on (not Predictable). This is because on a target server, the applications would be co-located with a different set of applications (VMs) that may use non-partitioned resources (e.g, cache) in a different way than the VMs hosted on the previous server. This directly impacts event counters like memory bandwidth and may indirectly impact other event counters like Instructions Dispatched per Second (IDS) as well. The complete lack of Predictability is the greatest obstacle in using a model based on event counters. Hence, we explore a power model that takes the throughput (number of jobs executed per second) of an application as input in order to estimate power, as opposed to existing application oblivious power models.
3. EXPERIMENTAL TESTBED AND PARAMETERS We conducted a large number of experiments to investigate the key application and server parameters that dictate the power consumed by a server. We start by describing our experimental testbed.
3.1 Hardware Setup The experiments were performed on 3 machines (2 blade servers and and 1 commodity rack server) detailed in Table 1. These machines were used to run the tested applications directly or as hosts for virtual machines which hosted the applications. We use IBM Active Energy Manager [4] to monitor power for bluestar1 and bluestar4 and a power meter at the plug for mad-max.
3.2 Applications Name TPC-W TPC-WSpecPower Domino Dominodaxpy fma HPL
Description TPC-W with images TPC-W with no images Benchmark from SPEC Mail server with 500 users Mail server with 10 users BLAS-1 routine Vector HPC Application LinPack Benchmark
Nature CPU, Memory CPU, Cache CPU Disk I/O Network CPU CPU CPU
Table 2: Applications Used for (a) Design and (b) Validation The goal of this work was to create a modeling methodology that is applicable across a wide variety of workloads. Hence, we use enterprise applications to design our methodology and HPC applications to validate it. The disparity in the applications used for Design and Validation avoids any application biases to creep in the methodology. The first application we select for modeling is the SpecPower benchmark [8]. SpecPower is the first industry-standard SPEC benchmark that evaluates the power and performance characteristics of volume server class computers. The benchmark exercises the CPUs, caches, memory hierarchy and the scalability of shared
Name bluestar1 bluestar4 mad-max
Processor Intel Xeon 2 x 3.2GHz Intel Xeon 2 x 3.2GHz Intel Core 2 Duo 2GHz
Model HS21 Bladecenter HS21 Bladecenter Desktop
L2 2MB 2MB 4MB
Memory 4 GB 4 GB 2 GB
HyperVisor VMWare ESX 3.5 VMWare ESX 3.5 Xen 3.2
Table 1: Hardware setup Domino
SpecPower
TPC-W Domino- TPC-W-
180
3.2.1 Application Parameter We use application throughput or the number of jobs executed per second as the attribute to describe the application. The notion of throughput is well defined for transactional applications like TPCW and Domino. The same notion can be trivially extended to long running batch HPC jobs in the following manner. For any batch of n HPC jobs that are expected to complete in time T , we define the throughput of the HPC application as n/T , which may be less than 1job/second for long running jobs. This notion of throughput has been used for all HPC jobs considered in this paper.
4.
APPLICATION-AWARE POWER MODELING
We have conducted a large number of experiments to investigate the feasibility of an application-aware power model. We now present some of our key observations.
4.1 Application Throughput Based Power Models We first explored the feasibility of estimating power drawn by a server running a single application on a server as a function of readily available application parameters like application throughput. For a set of applications, we run the application with increasing throughput and measure power (Fig. 3) till we reach saturation and throughput can not be increased any further. These experiments
170 160
Power in Watts
memory processors (SMPs) and is a representative of typical CPUintensive applications. SpecPower allows a "calibration value" to be set, which represents the unique maximum throughput and we set this value to 10115. This calibration value corresponds to the maximum throughput obtainable on all three servers we use in our experiments. We used TPC-W [10], as a representative benchmark for a transactional workload that stresses CPU, but also has large memory usage. We used the freely available implementation of TPC-W from University of Wisconsin [9]. TPC-W uses a web server front-end to handle the requests and a database server to process the database queries corresponding to the web requests. The application embeds images in the HTML document that is sent in the response to the web request and these images create a large memory footprint. In order to study applications that use cache well, we create a variant of TPC-W, termed TPC-W-, by disabling the images from being loaded. This ensure that all the content is dynamically generated, leading to a small footprint. The throughput of TPC-W and variants was modified by the use of the browsers think time variant. The third application we selected was Lotus Domino [5]; a real I/O-bound application. Domino is an IBM collaboration application that provides enterprise e-mail, messaging, directory services, web services, and application services. A variant of Domino (Domino-) simulates 10 users instead of 500. It was observed that the Domino application has a significant use of disks, hence this variant tries to rely less on disk and more on the OS page cache. For the validation experiments, we used HPC applications that contrast well with the applications used to design the methodology. We used two vector-based routines (daxpy and fma) as well as HPL, a widely used Linpack implementation. All our applications and their variants are listed in Table 2.
150 140 130 TPC-W TPC-WSpecPower Domino Domino-
120 110 100 0
50
100 150 200 Requests per second SpecPower operations (100) per second
250
Figure 3: Power Vs Transaction Rate for all applications on bluestar1. The vertical lines denote the throughput bound for each application. thus cover the entire possible operating range for the server. We observe that marginal (dynamic) power for any application Ai has a linear relationship with application throughput (λi ). The actual slope of the power-throughput curve varies across applications but the relationship can be expressed by a curve of the form αi + βi λi with error in dynamic power less than 5% for most (more than 90%) of the operating range (Fig. 3). Hence, we conclude that an application throughput based power model is quite accurate and can be captured as P (Ai ) = αi + βi λi
(1)
Since the constants α and β vary with each application, separate calibration runs are required for each application on every server type that the application is placed on. We note that the model needs us to infer only two coefficients, which can be done using two calibration runs. However, we recommend using multiple runs and use simple linear regression [7] to estimate αi and βi . Once we determine αi and βi , we can predict power by (i) first predicting if the given throughput can be achieved and (ii) if yes, then use Eqn. 1 to predict the power. We next investigated the reason behind the linear relationship between marginal power and application throughput. We conjectured that resource consumption for jobs would increases linearly with throughput, resulting in the linear increase in power. Earlier research suggests that the resource metrics of importance for server power are CPU, memory, disk and network [21]. However, virtualized server farms that use dynamic consolidation for power management [31] require data to be stored on network disks so that applications can be migrated. Hence, disk power is not really a component of server power and needs to be modeled separately. For experiments involving TPC-W and variants, a separate database server is used and disks are network attached. However, for all other applications, we use local disks. The power usage of the memory component depends on memory bandwidth. On this platform we did not have a counter for memory bandwidth and we used the number of L2 cache misses per second measured using Oprofile [25] as a proxy for memory bandwidth. L2 cache misses do not account for any memory used through prefetching. However, we were not interested in the actual estimate of memory used but we only needed to know if memory activity increased as throughput was increased. Since an increase in number of L2 cache misses indicate an increase in memory bandwidth, this proxy was acceptable to us. Figure 4 confirms our conjecture that resource utilization of CPU,
Domino
SpecPower
TPC-W Domino- TPC-W-
Domino
800000
100
SpecPower
TPC-W Domino- TPC-W-
30000
CPU utilization in %
60
40 TPC-W TPC-WDominoDomino SpecPower
20
600000
25000
500000
20000
KB/sec
L2 Cache misses per second
700000 80
400000
15000
300000 10000 200000 100000
0
0 0
50
100 150 200 Requests per second SpecPower operations (100) per second
TPC-W Domino DominoTPC-WSpecPower
5000
TPC-W TPC-WSpecPower
0
250
20
40
60 80 100 120 140 Requests per second SpecPower operations (50) per second
160
180
0
50 100 150 200 Requests per second SpecPower operations (100) per second
250
(a) (b) (c) Figure 4: (a) CPU (b) Memory and (c) Network Activity Vs Transaction Rate on bluestar1 1 VM 2 VM Host
250
180 Host 1 VM 2 VM’s
170
200 Host 1 VM 2 VM 3 VM
190 200
150
Power in Watts
Power in Watts
Power in Watts
180 160
150
100
170 160 150
140 140 50
130 120
Host 1 VM 2 VM’s 3 VM’s
130
0 0
50
100 Requests per second
150
200
120 0
20
40
60 80 100 120 140 Operations (100) per second
160
180
200
0
100
200
300 400 500 Requests per second
600
700
(a) (b) (c) Figure 5: Power Vs Aggregated Transaction Rate for (a) TPC-W, (b) SpecPower and (c) TPC-W- at different virtualization ratio on bluestar1
4.2 Virtualization-aware Power Modeling Our first experiments aimed at characterizing the power drawn by a server running an application without virtualization. We concluded that application-level power modeling is feasible on nonvirtualized systems. Modern Hypervisors use various optimizations to ensure that the Hypervisor overhead is fairly low for CPUintensive applications. However, virtualization has other overheads due to I/O [18] and cache contention [32] and we now study the impact of the virtualization ratio (defined as the number of virtual machines on the server) on the power models. We run the same application natively and at the same throughput divided on one or more virtual machines and study any difference in power consumed. Virtual machines can be assigned resources, which are either dedicated or shared with other virtual machines. The impact of virtualization is more intricate for shared resources, and hence we use virtual machines with shared resources in our study to make it more widely applicable. We observed that the impact of virtualization depends on the application characteristics. Fig. 5(a) studies the power drawn by T P C-W on bluestar1 machine at various throughput running na-
tively. Further, we also run T P C-W on one or more virtual machines such that the total throughput combined over all the virtual machines equals the one obtained running natively. We observe that the power drawn for the same application throughput increases with the number of virtual machines. On the other hand, virtualization seems to have minimal impact on the power usage for SpecPower workload (Fig. 5(b)). In order to understand the impact of virtualization better, we added one more application T P C-W - to the mix. We observed an even higher virtualization overhead for T P C-W (Fig. 5). The findings made it very clear that power modeling oblivious of virtualization ratio made little sense and depending on the application, the models need to be aware of the setting in which the application will be running. 100
CPU utilization in %
memory and network depend linearly on application throughput. We also observe that the throughput bounds are a result of specific resources. For example, SpecPower, Domino- and TPC-W are bounded by CPU and Domino is bounded by disk usage. T P C-W is a much more interesting case as it did not seem to be resource bounded by any of the resources but still reaches saturation. We conjectured that a distributed application like TPC-W or T P C-W may be bounded by other components and looked at the system logs of the database server that hosted the database for T P C-W . We found that the database server for T P C-W - was running at close to 100% CPU utilization. This observation underlines the importance of taking all components of a distributed application into account, while predicting the throughput bound of such an application. The observations emphasize that modeling power as a function of application parameters is not only more user-friendly but may capture the actual system load better than a model based on a single metric like CPU utilization.
80
60
40
Host 1 VM 2 VM’s 3 VM’s
20
0 0
20
40
60
80
100
120
Operations (100) per second
Figure 6: CPU Vs Aggregated Transaction Rate for SpecPower with different virtualization ratio on bluestar1 We also conjectured that the increase in power due to virtualization was a result of higher resource consumption due to virtualization, while serving the same number of application requests. To validate this conjecture, we also measured the CPU utilization for the same set of experiments. We observed (Fig. 6) that SpecPower showed minimal increase in CPU as we increased the number of virtual machines running the application. On the other hand, T P CW - showed a marked increase in CPU utilization as we increased the number of virtual machines (Fig. 7). This proved our conjecture that the increased power consumption was a result of higher resource consumption, due to virtualization overheads for I/O and
cache contention. Further, the virtualization overhead was application dependent, stressing even more the need for application aware power models. 50
CPU utilization in %
40
30
20
10
ESX and Xen. We observed that ESX and Xen have different overheads for I/O intensive applications (T P C-W ). On Xen, CPU overhead due to I/O is mainly proportional to the number of page flips (transfers) [18] and increasing the number of VM’s at constant throughput doesn’t increase the CPU overhead. On the other hand, ESX issues I/O requests that due to binary translation are emulated in contexts whose contention only increases with the number of VM’s. However, in all cases, they conform to Eqn. 2. For lack of space, those plots are omitted in this paper.
4.3 Extending Power Models
Host 1 VM 2 VM’s 3 VM’s
140
0 100
200
300 400 Requests per second
500
600
700
120
Figure 7: CPU Vs Aggregated Transaction Rate for TPC-Wwith different virtualization ratio on bluestar1 We further tried to characterize the applications that show higher virtualization overhead as compared to applications that exhibit lower overhead. We observe that SpecP ower has low I/O activity (lower disk activity as well as memory activity in Fig. 4) as compared to T P C-W . It has been noted [18] that I/O instructions are a prominent source of virtualization overhead. However, we note that T P C-W -, which has no images, also has low disk activity but has the highest virtualization overhead amongst the three applications studied. Hence, we needed to look beyond I/O activity to understand this behavior. It has been observed that HPC applications with moderate sized working set face cache contention due to virtualization and observe a drop in performance [32]. Hence, we measured the L2 cache hit and miss rate for the modeled applications. We observed that T P C-W - has a smaller working set size and is able to serve most of its requests from cache (miss/hit ratio of 2%), whereas SpecPower has a much larger Active Memory (indicative of a larger working set) and a higher miss/hit ratio (about 8% in Table 3). These observations extend the earlier result on cache usage impacting virtualization overhead for HPC applications [32] to enterprise applications as well. The above observation also impacts power modeling as it implies that applications that have a small working set need to be aware of virtualization. Hence, we conclude that applications with high I/O activity or low working set need to be aware of the virtualization ratio, while building their power models. On the other hand, for applications characterized by large working set and low I/O activity, we may not need to build power model separately for each virtualization ratio. App L2 hit/inst L2 miss/inst Memory TPC-W0.036 0.0006 57 MB SpecPower 0.042 0.0033 781 MB Table 3: Cache Hit and Miss rates for TPC-W- and SpecPower It is interesting to note that the overhead due to I/O activity and cache contention are qualitatively different. At low throughput, I/O intensive applications like TPC-W do not have much overhead. On the other hand, for multiple VM’s, T P C-W - requires expensive cache thrashing context switches even at low throughput leading to significant overhead (Fig. 5). Since the impact of the virtualization ratio on power varies across applications and can not be quantified in a closed form, we build separate models of an application for each virtualization ratio. Hence, we extend Eqn. 1 for an application Ai running at virtualization ratio d as P (Ai,d ) = αi,d + βi,d λi
(2)
We have conducted similar experiments for other (application,server) pairs at different virtualization ratios(from 1 to 7) using both VMWare
Power in Watts
0
100 80 60 40 3200 1600 800 400
20
MHz MHz MHz MHz
0 0
50
100 150 Requests per second
200
250
Figure 8: Power Vs Transaction Rate for TPC-W at different frequency In typical data centers, new servers get added over time to cope up with increased workload. Hence, they consist of servers that are of the same family and differ in minor versions, typically only processor frequency. Hence, if we can use the power models of old servers to generate models for new servers, it allows us to build the models with very few calibration runs. Hence, we performed a preliminary study to investigate the feasibility of extending power models from one server to another. To simulate multiple processors those belong to the same processor family but differ in frequency, we used cpuf req to scale the processor frequency. We then studied the impact on power at various throughput values at all the available frequencies. Fig. 8 shows the study for T P C-W (other applications are omitted for lack of space). We observed that, at least for CPU-bound applications like T P C-W and SpecP ower, the power model does not change (beyond the noise value) at different frequencies. However, as we increase or decrease CPU frequency, the available CPU resource changes and, as a result, the throughput bound shrinks as we decrease the CPU frequency. Hence, our study indicates that it is reasonable to use power model of an older server in the same family for newer servers in the same family, at least for CPU bound application. We are also conducting experiments on different processor families with changing Cycle Per Instruction (CPI) as part of future work.
5. MODELING POWER USAGE OF MULTIPLE APPLICATIONS We have presented insights on modeling the power drawn by an application as a function of application throughput on a native as well as virtualized server. The second model (Eqn. 2) can be applied to servers that support a single application type. We now explore the possibility of building power estimation models for server clusters that support multiple applications, i.e., different applications may run on a shared server in their own virtual machines. Our study for building application-level power models for a single application brings out two important observations. Firstly, marginal power drawn by a server has a linear relationship with the marginal increase in application throughput. Secondly, for many applications, the virtualization overhead needs to be factored in while build-
Bound/Type 190/CPU 218/DB CPU 10115/Input 49/disk 184/CPU 180 168 -
Table 4: Single Application Power Models. Models for madmax use Xen Hypervisor. ing their power model. We conjecture that the power drawn by a set of applications running on the same server can be inferred as a linear combination of the power models of each application running independently. We also conjecture that the power model of individual applications to be used for this linear combination should be the model at the same virtualization ratio for the application. Our conjecture is based on the intuition (obtained from Fig.3,4) that power consumed by different resources have a static component, independent of usage and a dynamic component, that is directly proportional to usage. Since the static component of power usage is consumed by all applications running independently as well, we use only the largest static power among all co-located applications for the static power usage of the consolidated server. To estimate the dynamic power of the consolidated server, we combine the standalone dynamic power of all co-located applications, at their respective throughputs. This is based on the insight that the resource usage of any resource gets combined from all applications. If the applications use different resources, the combination happens trivially. If applications use same resources, the intuition still holds due to (a) linearity of resource consumption with throughput and (b) linearity of dynamic power consumption with resource usage (Fig.3,4). To elaborate the linear combination with an example, consider a server running two VMs, first with application Ai at throughput λi and second with application Aj at throughput λj , with power models αi,2 +βi,2 λi and αj,2 +βj,2 λj at virtualization ratio 2. The linear combination estimates power as max{αi,2 , αj,2 } + λi βi,2 + λj βj,2 . We study both these hypothesis in this section. We use the individual models for each application created in Sec. 4.2 for this linear combination and summarize them in Table. 4. We study our conjecture for the heterogeneous application scenario in Fig. 9 with TPC-W- and SpecPower. We observe an expected value with an error in dynamic power less than 5% of the real value for most of the workload range. To strengthen our observation, we experiment with a completely different setup: a commodity rack server (mad-max) running Xen Hypervisor instead of a production-level blade server (bluestar1) running VMWare ESX. We study a combination of T P C-W and SpecP ower and find a similar pattern (Fig. 10). bluestar1 is an IBM HS-21 blade server with advanced power management features and has a much larger dynamic power range, whereas mad-max is a rack server with a very limited dynamic power range. However, our observations hold for both these diverse cases. We do note that an accurate model is
200 190
Power in Watts
Model 0.18*x + 125 0.05*x + 125 0.0044*x + 124 0.16*x + 131 0.15*x + 132 0.197*x + 125 0.056*x + 247 0.075*x + 128 0.0044*x + 124 0.00162*x + 244 0.25*x + 125 0.115*x + 247 0.085*x + 131 0.0044*x + 124 0.00162*x + 244 0.093*x + 134 0.0044*x + 124
180 170 160 150
i ii iii iv v
140 130 120 0
50
100
150
200
250
300
Requests per second (TPC-W-)
0
30
60
90
120
Operations (100) per second (SpecPower)
Figure 9: Power Vs Transaction Rate for TPC-W- + SpecPower on bluestar1 with (i) real value, estimated using applicationlevel models for (ii) native TPC-W- and native SpecPower, (iii) 1 VM TPC-W- and 1 VM SpecPower, (iv) 2VM TPC-W- and 2 VM SpecPower, and (v) CPU utilization based model. needed more for blade servers with a larger dynamic range like bluestar1 instead of rack servers like mad-max. However, in both these cases, our experiments validate the conjecture that a linear combination of the models of individual applications at the same level of virtualization can infer the power drawn by a mix of applications on the same server. 300 290
Power in Watts
Machine Bluestar1-host Bluestar1-host Bluestar1-host Bluestar1-host Bluestar1-host Bluestar1-1VM mad-max-1VM Bluestar1-1VM Bluestar1-1VM mad-max-1VM Bluestar1-2VM mad-max-2VM Bluestar1-2VM Bluestar1-2VM mad-max-2VM Bluestar1-3VM Bluestar1-3VM
280 270 260 250 240
i ii iii
230 220 40
60
80
100
120
140
Requests per second (TPC-W)
30
60
Operations (100) per second (SpecPower)
Figure 10: Power Vs Transaction Rate on mad-max for TPCW + SpecPower with (i) real value, estimated using (ii) CPU utilization based model and (iii) application-level models of 2 VM TPC-W and 2 VM SpecPower. 300 290
Power in Watts
Application TPC-W TPC-WSpecPower Domino DominoTPC-W TPC-W TPC-WSpecPower SpecPower TPC-W TPC-W TPC-WSpecPower SpecPower TPC-WSpecPower
280 270 260 250 240
i ii iii
230 220 10
20
30
40
50
60
70
Requests per second (TPC-W) / (TPC-W-) for 10 to 171
30
60
Operations (100) per second (SpecPower)
Figure 11: Power Vs Transaction Rate on mad-max for TPC-W + TPC-W- + SpecPower with (i) real value, estimated using (ii) CPU utilization based model, and (iii)application-level models of 3 VM TPC-W, 3 VM TPC-W- and 3 VM SpecPower. We also observe that a utilization-based power model is insufficient to estimate the power drawn by a server. In fact, we see that the utilization-based model has an error higher than 50% in all cases for the bluestar machine, even approaching 75%, making it completely useless for predicting dynamic power. Further, we also observe that taking the level of virtualization into account is very important since the power model of T P C-W - is heavily dependent on the virtualization ratio. A model that is unaware of
virtualization ratio may have an error as high as 30%. Hence, we conclude that taking the virtualization level of individual applications model into account is very important, especially if at least one of the applications being co-located has a small working set. Our observations hold as we increase the number of hosted applications as well (Fig. 11). Hence, we model the power for a mix of applications running on a shared server as a linear combination of the models of individual applications in the following manner. P (Ai1,d + Ai2,d + · · · + Aid,d ) = max{αi1,d , . . . , αid,d }+ (3)
WATTAPP: AN APPLICATION AWARE POWER METER
We now present WattApp, an application aware power meter that encapsulates our experimental observations.
SERVERS
APPLICATION LOGS
APP
Info
SYSTEM LOGS Power Info MODEL BUILDER
6.1 Implementation and Validation
APPLICATION
VIRTUALIZATION MANAGER
MANAGER App Start/Stop
VM Migration
CONFIGURATION ORCHESTRATOR
APPLICATION POWER TABLE
Lease
POWER MANAGER
App, Server Type, Servers USER/DISCOVERY
ORACLE QUERY INTERFACE
WattApp
Figure 12: WattApp Architecture The architecture of WattApp is described in Fig. 12. WattApp has three distinct flows that execute independently of each other. The first flow is called the Model Builder flow. In this flow, the Model Builder reads the system and application logs (power, throughput values) to create individual application-level power models (Application Power Table with αi,d , βi,d ) of each application Ai for each server type that hosts the application. Further, as more data is logged, the models are continuously refined and enriched to include more server types and/or virtualization ratios. The second flow in WattApp is the Configuration Management flow, executed by the Configuration Orchestrator. The job of the Configuration Orchestrator is to refer to the Application Power Table and identify applications and server types that do not have a power model at the required virtualization ratio and perform calibration runs to generate the required log data. To achieve this, the Configuration Orchestrator directs the Virtualization Manager to copy the VM for the application on all the servers that can host it and executes them at up-to 5 workload intensities. The aim of this exercise is to identify the application throughput bound on the given server and to get at least two observations of power versus application throughput. The same set of experiments are repeated at the virtualization ratio that the application is intended to run at (default is 5). The Configuration Orchestrator can quickly create the power model for servers that are not running production workload. However, in an operational server farm, the biggest challenge is to perform the calibration runs without disrupting the normal workload. W attApp achieves this by a technique that we call Server Stealing by interfacing with a Power Manager. The Power Manager provides a list of idle servers and any servers that will be moved to Standby mode due to power management. If a server that is planned
We have implemented WattApp using VMWare ESX as the virtualization manager on an IBM HS-21 Bladecenter chassis with 4 blades. We re-use the two blades ’bluestar1 and ’bluestar4’ from the initial modeling and add two additional blades ’bluestar2’ and ’bluestar3’ in our managed environment. The two new blades use Intel Xeon 5148 quad-core processor, with 2.33 GHz core frequency. The rest of the specifications are same as the earlier blades. All the blades have a RAM of 3.4 GB and share a single datastore of size 160 GB. We use IBM Active Energy Manager to monitor power [4] for the blade servers. The Power Manager is based on an extension of our earlier work [32, 31]. The server cluster hosts the existing applications (TPC-W, Domino and SpecPower) as well as three HPC applications. The first two applications are daxpy from a HPC suite [20] and f ma. The third application is a Linpack benchmark called HPL [3] that has been extensively used in many performance studies. We use HPL with a 4 × 2 process grid and vary the number of problems (jobs). 80 70 Dynamic Power (W)
6.
βi1,d λi + · · · + βid,d λid
to be switched to a standby mode belongs to a server type for which model data is not available for some applications, the Configuration Orchestrator negotiates a lease from the Power Manager for the duration required to run the calibration runs. Once the required runs are performed, W attApp returns the lease back and the server can be switched to standby. This Server Stealing technique allows W attApp to build the Application Power Table in an operational server farm in an unobtrusive manner. The third flow in W attApp is called the Oracle flow and executed by the Oracle Query Interface. In the Oracle flow, any power manager can use the Query Interface with a server, and a set of applications along with their required throughput, and WattApp returns a power estimate. In cases where the required throughput can not be supported within the resource bounds, WattApp also returns a flag to pass this information. In the Oracle flow, WattApp uses the Application Power Table and Eqn. 3 to predict the power drawn by any given set of applications on a specified server. WattApp also uses a frequency-based normalizer if an estimate is required for a new server type (for which data is not available in the Table).
60 50 40 30 20
Actual WattApp CPU-based
10 0 0
20
40
60
80
100
Number of Jobs (Normalized)
Figure 13: Dynamic Power Vs Number of jobs (Normalized) We use WattApp to benchmark all the applications on all the servers, which provides an upper bound estimate for ’model creation time’. Since WattApp only needs to build power models for individual applications (as opposed to all possible combinations of co-located applications), the number of calibration runs required by W attApp is linear in the number of applications. Further, W attApp uses one server of each server type to run concurrent characterization of any given application ensuring a linear time. Hence, the running time of WattApp was independent of the number of servers in the server farm. This property ensures that WattApp is scalable and hence can be used in large server farms. Further, for each application, WattApp ran no more than 50 calibration runs, with each run lasting around 2 minutes. Note that the length of the run depends on the time granularity at which the monitoring module can
report power numbers, which for IBM Active Energy Manager, is 1 minute. In our experiments, we never needed to go beyond 5 virtualization ratio and 3 runs for each ratio and hence, the benchmarking time for each application was around 30 minutes. For a total of 6 applications, we needed a total time of 3 hours to completely create the power models. Given that the different number of server types in a server farm may be relatively small, W attApp is very likely to get a lease for each server type using Server Stealing to compute the power models in even less time. We now investigate the Accuracy of W attApp. For lack of space, we only present one study. To establish the applicability of WattApp across a wide variety of applications, we present a scenario with the three new HPC applications that were not used during the design of WattApp. During a period of low activity, the Power Manager considered moving the daxpy, f ma and HP L application on the same server. As a result, it requested WattApp for an estimate of the power consumed by the server to host the 3 applications. In this particular case, daxpy had an entitlement of 0.5 of the server, wheras f ma and HP L had an entitlement of 0.25 each. Based on the estimate given, the applications were eventually placed on bluestar2, which is a different machine from the ones used in our initial experiments (Sec. 4). Post reconfiguration, we change the throughput of the applications and measure the power consumed by the server. Fig. 13 shows the dynamic power (actual power - idle power) drawn by the server after the applications were moved with change in application throughput. We observe that W attApp is able to predict the actual power drawn to within 5W for the entire operating range, with an error of less than 2W for more than half of the operating range. To compare against the CPU Utilization based method, we also build a model of server power versus CPU utilization of the server. This model was derived from all the earlier measurements of CPU utilization and power on the server. We observe that the CPU-based predictor has an error greater than 50% for the entire operating range. As we have shown before, this is a direct consequence of the fact that the CPU utilization model is application-unaware, leading to inaccuracies with heterogeneous applications. The case study further establishes the strengths of WattApp w.r.t Accuracy, Usability, Predictable Input, Speed and Heterogenity Support, making it applicable to emerging clouds as well as traditional data centers.
7.
RELATED WORK AND DISCUSSION
Research in power modeling can be broadly classified into (i) Simulator-based, (ii) CPU Utilization-based (iii) Event or performance counters based and (iv) Coarse-grained. Table. 5 presents a summary of their relative strengths and weakness. Early work in power modeling focused on simulators of various hardware, whose goal was a power-aware design of servers. Wattch [15] is a widely used CPU power simulator whereas SoftWatt [22] estimates power for complete systems. These models are based on detailed activity count registers and are Accurate but are limited in terms of Speed, Usability and Predictable Input. Bellosa [14] address the problem of speed in simulation-based models by proposing a model based on Instructions Dispatched per Second (IDS) and memory bandwidth (accesses per second). The model is fairly accurate to ascertain power consumed by memory subsystem and reasonably accurate for processor power. However, performance event counters like memory bandwidth are not available on some platforms (e.g, IBM Power5) and expensive to monitor on the platforms they are available on. Further, due to nonlinear nature of some of these parameters, estimating them on a target server is non-trivial. The issues in translating system counters
across platforms led to power modeling based on readily available system parameters like CPU utilization [21]. A CPU utilization based model is currently the most popular power estimation model used in practise [23, 27] and works well for estimating the impact of actions like workload redistribution for a fixed application. However, different applications make differing use of various CPU units and other system resources like memory and a CPU utilization model is useful only if the application used during prediction is same as the one used during model building [30, 32, 31]. Interestingly, the workload-sensitive nature of CPU-based models has been recently cited as a reason to go back to using detailed event counters in [29] for predicting processor and memory power usage under voltage scaling. A good comparison of various system-level power models is presented in [28]. Early power management research used analytical power models based on voltage and frequency [17], which are fast, but only provide rough estimates. Coarse-grained estimates based on the type and state (active, off) of the processor have been used in [34]. However, with the increase in the dynamic power range of servers [12], a more accurate power prediction method is needed. The work closest to ours is the power modeling in [19]. The authors create power profiles for each application and use it to estimate the power drawn by a consolidated server hosting the applications. However, the applications are assumed to be in a stable state (a fixed throughput in our model) and the model ignores any impact due to virtualization. Further, the authors use a CPU-based averaging technique and observe that their model may not be accurate for a mix of workloads, where at least one workload is not CPU-dominated. The lack of an accurate power model for heterogeneous servers and applications has been cited as the primary reason to restrict dynamic consolidation methodologies to sub-optimal algorithms [32, 31]. Further, as observed in [31], the lack of an accurate power model makes the problem of enforcing a power budget on a shared data center a challenging one. WattApp significantly enhances the ability to estimate the power drawn by a shared data center running heterogeneous applications, this providing this missing piece in the overall power management framework.
7.1 Discussion and Conclusion We have investigated the problem of modeling power for heterogeneous applications and servers in a virtualized server farm. We propose an application throughput based power model and establish its Accuracy, Usability, Predictable Input, Speed and Heterogeneity Support. We show that I/O activity and working set size are important parameters that determine if virtualization ratio needs to be included during modeling. We conjecture and show experimentally that linear combination of power models can be used to create a power model for multiple applications hosted on the same server. We present the architecture and implementation of an applicationaware scalable power meter W attApp that uses only a linear number of experimental runs to create a power model with error less than 5%. We had also investigated the feasibility of building an applicationaware model using per-application CPU utilization as the input parameter in place of application throughput. In this work, we preferred to use an application-aware application-level power model for two reasons: (i) In the managed server clusters we investigated, CPU utilization for each application was not monitored. We have observed that application throughput is often the only parameter monitored in SLA-driven server clusters. The same is likely going to be the case for emerging clouds that provide applicationlevel resource abstractions. (ii) Application throughput also has the advantage of accurately reflecting resource usage, as opposed to
Method Simulator CPU-based Event Counters Coarse WattApp
Accuracy √√ √ √√ × √√
Usable Params × √
Predictable Input × √
× √√ √√
× √√ √√
Speed × √√ √ √√ √√
Heterogenity √√ Support × √√ × √√
Table 5: Power Modeling Methodologies resource-specific metrics like CPU utilization that may be inaccurate for workload that uses other resources. Our detailed experimental study validated our intuition. This has been independently noted by Choi et al. [19] as well. Further, if application throughput is not available in a cluster, our technique can be extended to model power based on any other parameter that is (a) application-aware and (b) accurately captures the resource usage of an application, thus underlining the applicability to a wide variety of data centers.
8.
ACKNOWLEDGEMENTS
We would like to thank Karthick Rajamani and Freeman Rawson for providing some benchmarks and Raju Rangaswami for insightful comments on model formulation. This material is based upon work supported by the National Science Foundation under Grant No. OISE-0730065.
9.
REFERENCES
[1] Afcom’s data center institute issues five bold predictions for the future of the data center industry; new survey identifies labor shortage, power failures, relocation, risk management and virtualization as major issues. In Business Wire, March 23, 2006. [2] Control power and cooling for data center efficiency - hp thermal logic technology. an hp bladesystem innovation primer. In http://h71028.www7.hp.com/ERC/downloads/4AA05820ENW.pdf. [3] Hpl- a portable implementation of the high performance linpack benchmark for distributed memory computers. In http://www.netlib.org/benchmark/hpl/. [4] Ibm active energy manager. In http://www-03.ibm.com/systems/management/director/about/ director52/extensions/actengmrg.html. [5] Ibm lotus domino. In http://www-306.ibm.com/software/lotus/products/domino/. [6] pseries and aix information center. In http://publib.boulder.ibm.com/infocenter/ pseries/v5r3/index.jsp?topic=/com.ibm.aix.cmds/doc/ aixcmds2/hpmstat.htm. [7] Simple linear regression. In http://en.wikipedia.org/wiki/Simple_linear_regression. [8] Specpower ssj2008. In http://www.spec.org/power_ssj2008/. [9] Tpw-w in java. In http://www.ece.wisc.edu/ pharm/tpcw.shtml. [10] Transaction processing performance council tpc-w. In http://www.tpc.org/tpcw/default.asp. [11] ASHRAE Technical Committee 9.9. Datacom equipment power trends and cooling applications, 2005. [12] L.A. Barroso and U. Hölzle. The case for energy proportional computing. In IEEE Computer, 2007. [13] C. Belady. In the data center, power and cooling costs more than the it equipment it supports. http://www.electronics-cooling.com/articles/2007/feb/a3/, 2007. [14] F. Bellosa. The benefits of event-driven enery accounting in power-sensitive systems. In Proc. SIGOPS European Workshop, 2000. [15] D. Brooks, V. Tiwari, and M. Martonosi. Wattch: A
[16]
[17] [18] [19]
[20] [21] [22] [23] [24]
[25] [26] [27] [28] [29] [30] [31] [32] [33] [34]
framework for architectural-level power analysis and optimizations. In Proc. ISCA, 2000. M. C-Maury, A. Shah, F. Blagojevic, D.S. Nikolopoulos, B. de Supinski, and M. Schultz. Prediction models for multi-dimensional power-performance optimization on many cores. In PACT, 2008. Y. Chen, A. Das, W. Qin, A. Sivasubramaniam, Q. Wang, and N. Gautam. Managing server energy and operational costs in hosting centers. In Sigmetrics, 2005. L. Cherkasova and R. Gardner. Measuring cpu overhead for i/o processing in the xen virtual machine monitor. In Usenix ATC, 2005. J. Choi, S. Govindan, B. Urgaonkar, and A. Sivasubramaniam. Profiling, prediction, and capping of power consumption in consolidated environments. In MASCOTS 2008. DAXPY. http://www.netlib.org/blas/daxpy.f. D. Economou, S. Rivoire, C. Kozyrakis, and P. Ranganathan. Full system power analysis and modeling for server environments. In WMBS, 2006. S. Gurumurthi et al. Using complete machine simulation for software power estimation: The softwatt approach. In HPCA, 2002. T. Heath, B. Diniz, E. V. Carrera, W. Meira Jr., and R. Bianchini. Energy conservation in heterogeneous server clusters. In Proc. PPoPP, 2005. C. Isci, A. Buyuktosunoglu, C-Y. Cher, P. Bose, and M. Martonosi. An analysis of efficient multi-core global power management policies: Maximizing performance for a given power budget. In MICRO 2006. John Levon. OProfile Manual. Victoria University of Manchester, 2004. Ripal Nathuji and Karsten Schwan. Virtualpower: coordinated power management in virtualized enterprise systems. In Proc. SOSP, 2007. P. Ranganathan, P. Leech, D. Irwin, and J. Chase. Ensemble-level power management for dense blade servers. In Proc. ISCA, 2006. S. Rivoire, P. Ranganathan, and C. Kozyrakis. A comparison of high-level full-system power models. In HotPower, 2008. D. Snowdon, S. Petters, and G. Heiser. Accurate on-line prediction of processor and memory energy usage under voltage scaling. In EMSOFT, 2007. J. Stoess, C. Lang, and F. Bellosa. Energy management for hypervisor-based virtual machines. In Usenix ATC, 2007. A. Verma, P. Ahuja, and A. Neogi. pmapper: Power and migration cost aware application placement in virtualized systems. In Middleware, 2008. A. Verma, P. Ahuja, and A. Neogi. Power-aware dynamic placement of hpc applications. In ICS, 2008. A. Verma, G. Dasgupta, T. Nayak, P. De, and R. Kothari. Server workload analysis for power minimization using consolidation. In Usenix ATC, 2009. H. Zeng, C.S. Ellis, A.R. Lebeck, and A. Vahdat. Ecosystem: Managing energy as a first class operating system resource. In ASPLOS, 2002.