Water Transport Properties in Poly(3-hydroxybutyrate) and Poly(3-hydroxybutyrate-co-3-hydroxyvalerate) Biopolymers O. MIGUEL, J. J. IRUIN Departamento de Ciencia y Tecnologı´a de Polimeros, Facultad de Quı´mica, Universidad del Paı´s Vasco, San Sebastian, Spain
Received 3 June 1998; accepted 25 August 1998
ABSTRACT: Water sorption and diffusion have been investigated in poly(3-hydroxybutyrate) (PHB) and three poly(3-hydroxybutyrate-co-3-hydroxyvalerate) copolymers [P(HB-HV)] by means of a Cahn electromicrobalance. Permeability of these samples have been determined using a gravimetric permeation cell. Two experimental setups were used for the gravimetric sorption measurements, under dynamic and static conditions, respectively. The differences observed in the results obtained using these techniques are discussed. The sorption measurements have evidenced the tendency of water molecules to form aggregates or clusters in the polymer. In addition, the static sorption method revealed the potential of PHB and P(HB-HV) to undergo molecular relaxations, eventually leading to a partial desorption of the previously sorbed water after an induction period. The clustering effect was adequately described by the polycondensation model. On the other hand, the interpretation of the diffusivity in terms of mobility coefficients has revealed a competition between a plasticization effect and clustering. As a whole, water transport properties in PHB and its copolymers can be considered to be very close in magnitude to those of common thermoplastics such as PVC and PET. © 1999 John Wiley & Sons, Inc. J Appl Polym Sci 73: 455– 468, 1999
Key words: water; sorption; diffusion; poly(3-hydroxybutyrate); poly(3-hydroxybutyrate-co-3-hydroxyvalerate)
INTRODUCTION Nowadays there is a rising concern about environmental issues, particularly those related to effective management of postconsumer waste. This ecological awareness has led to development of new biodegradable materials, which can be a valid alternative in specific situations when recycling or incineration is difficult or not economically feasible. Correspondence to: O. Miguel. Contract grant sponsor: UPV/EHU; contract grant number: 203.215-EB173/95. Contract grant sponsor: Departamento de Economı´a de la Diputacio´n de Gipuzkoa. Contract grant sponsor: Basque Government; contract grant number: BF194.113AE. Journal of Applied Polymer Science, Vol. 73, 455– 468 (1999) © 1999 John Wiley & Sons, Inc. CCC 0021-8995/99/040455-14
Among the various new biomaterials that have been introduced, poly(3-hydroxyalkanoates) (PHA) seem to be one of the classes that has received most attention. Now available from Monsanto under the trade name of BIOPOL™, this family of copolymers of 3-hydroxybutyrate (3HB) and 3-hydroxyvalerate (3HV) is produced by many kinds of bacteria from such renewable raw materials as glucose and propionic acid. Alcaligenes eutrophus, the microorganism selected for industrial production, is capable of accumulating up to 80% of its dry weight as granules of poly(3hydroxybutyrate) (PHB) if growing conditions are carefully controlled.1 PHB is a hard, highly crystalline thermoplastic with a melting point of about 180°C and a glass transition slightly above 0°C. It is often compared to polypropylene in regard to its physical proper455
456
MIGUEL AND IRUIN
ties2,3; however, PHB has some undesirable characteristics that have prevented its development as a commodity material. Its main drawbacks are its brittleness and low melt stability, as well as its exceedingly high price. Some of these inconveniences were overcome with the introduction of statistically random copolyesters of 3HB and 3HV (P(HB-HV)). Toughness, elongation at break, and thermal stability are properties that increase with 3HV content.4 – 6 Furthermore, P(HB-HV) copolymers display the unusual feature of reaching approximately the same high level of crystallinity at all compositions (up to 70%). This enables the useful property of hydrolysis resistance to be retained in all the range of copolymers. P(HB-HV) copolymers have been shown to display isodimorphism: 3HV units are able to crystallize in the PHB lattice at compositions up to 40% 3HV mole content, and vice versa at higher percentages. Although this is a rare occurrence in polymers, P(HB-HV) satisfies the physical requirements for isodimorphism in that both 3HB and 3HV units have approximately the same monomer sizes, and the homopolymer chain conformations are compatible with either crystalline lattice.7–9 The features of biodegradability and biocompatibility of P(HB-HV), together with its low susceptibility to aqueous hydrolysis, open a wide spectrum of opportunities for these materials. Medicine, packaging, and agriculture seem to be the fields that can take the greatest advantage of P(HB-HV),3 fields in which the knowledge of the relations between water and polymer is of crucial importance for most applications. In previous publications, we have surveyed the transport properties of pure PHB10 and characterized the CO2 sorption in PHB and P(HBHV).11,12 Taking the matters further, the aim of this article is to provide a characterization of water sorption and transport in both pure PHB and three P(HB-HV) copolymers with contents of 8, 14, and 24% 3HV units, which, in the following paragraphs, are referred to as PBV8, PBV14, and PBV24.
EXPERIMENTAL Materials The polymers used in this study were purchased from Aldrich. Films of uniform thickness of about 35 m were solvent cast from chloroform solutions
over a smooth PTFE surface. After slow evaporation of the solvent, the films received a thermal treatment over 3 weeks at 60°C under vacuum to ensure full solvent removal and complete crystallization (around 70% crystallinity for all copolymers). The differential scanning calorimetry (DSC) characterization of the samples used has been presented elsewhere.12 Methods Water sorption experiments were performed using a Cahn D-200 electrobalance enclosed in a thermostated cabinet. Two different experimental setups, which can be found in the literature, for water sorption measurements have been employed. Their differences mainly arise from the manner in which the water vapor is supplied to the balance chamber. They are referred to as the dynamic and the static methods. Traditionally, the static method has been more widely used in studies of water and organic solvent sorption13–17; however, the dynamic method has also been described in detail.18,19
Dynamic Method A stream of nitrogen, adjusted to specific values of relative humidity, provided the water vapor in the sample chamber of the balance. After placing the polymer sample in the balance chamber at a constant temperature, it was purged with a dry nitrogen stream to eliminate residues of other gases. Then, at zero time, the nitrogen stream with adjusted humidity was allowed into the system at a mass flow of about 75 mL min21. We have calculated the speed of the stream in the vicinity of the sample to be about 0.03 cm/s. This speed must be low enough to avoid buoyancy effects in the sample. The apparatus is similar to that described by Hernandez and Gavara,18 in which the desired humidity is obtained by mixing wet and dry nitrogen streams, the former coming from a glass washing bottle filled with distilled water. Closed containers with salt solutions were also used to provide high relative humidities (.70% RH). Water activity values were measured by using Hygrosensors Type H-3 humidity sensors from Newport Scientific, Inc. The final sorption value was corrected by subtracting a blank value obtained in the same conditions, without any sample in the balance pan. The main advantage of this experimental setup is that water sorption is measured under condi-
WATER TRANSPORT PROPERTIES IN PHB AND [P(HB-HV)]
457
tions similar to those found in practical packaging applications; that is, in presence of atmospheric gases. However, the dynamic method has the drawback that the time needed to reach the desired relative humidity inside the balance is very long, typically taking a few hours. Consequently, diffusion coefficients cannot be calculated by the conventional methods, which require that the penetrant at the desired activity is instantaneously put in contact with the membrane.
Static Method In this case, the water vapor source was a stainless steel container filled with degasified distilled water.15 Before water sorption experiments were performed, the balance was evacuated by means of a vacuum pump. Then, the valve isolating the water container from the balance chamber was opened, allowing the water vapor to fill the sample chamber instantaneously. The water container had a built-in jacket connected to a thermostatic bath, so that the temperatures in the balance chamber and the water container could be selected independently. By choosing an adequate temperature in the liquid water container, the water vapor pressure ( p v ) can be controlled. The Antoine’s equation gives the relationship between the water vapor pressure in equilibrium with liquid water at a temperature T. 20
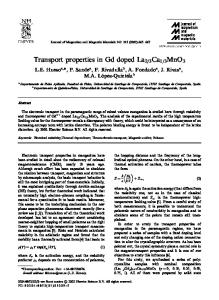
Figure 1 Water sorption in PHB and copolymers at 30°C.
small amount of liquid water was sealed by a membrane. The cell was put on a balance with a readability of 1025 g, and the weight loss of the cell, solely due to the permeation of the water vapor through the membrane, was followed by means of a computer connected to the balance. The details have been described elsewhere.10 The water activity inside the cell was 1; whereas, the downstream average humidity was 33 6 2%, as recorded with a thermohygrometer.
ln@p v~mmHg!# 5 18.3036 2 3816.44/@ 2 46.13 1 T~K!#
(1)
The water activity in the balance (a) can be calculated as the quotient between p v and the water vapor pressure at the experimental temperature set in the balance chamber, p 0v . a 5 p v /p 0v
(2)
With this experimental setup, both sorption and diffusion phenomena can be studied simultaneously. The amount of mass recorded without a sample in the balance pan proved to be small, but significant, so that it was necessary to subtract the corresponding blank run from the experimental data to obtain the actual sorption curve. Water sorption by the static method has been studied for PHB and PBV14, chosen as a representative of the low 3HV range copolymers. Permeation Water vapor permeation experiments were performed at 30°C on a gravimetric cell in which a
RESULTS Dynamic Sorption Experiments The water sorption isotherms obtained at 30°C over a wide activity range (0.03– 0.93) are presented in Figure 1, where C stands for the sorbed concentration. There is no significant difference in sorption behavior between the copolymers, so it can be stated that water sorption is virtually independent of the 3HV content of the copolymer in the composition range studied here. Our sorption results are in full agreement with data presented elsewhere for PHB,21,22 also being close in magnitude to those of PET23 and PVC.24 The isotherms show a pronounced upturn at high activities, which is a typical behavior in moderately hydrophobic polymers.24 –26 This curvature is usually ascribed to the clustering of the water molecules inside the polymer to form aggregates because of the predominance of water–water over water–polymer interactions.
458
MIGUEL AND IRUIN
Langmuir-type adsorption on pre-existing holes or polar groups in the polymer.30 –32 Table I shows the Flory–Huggins interaction parameter (x) for the water-PHB system, calculated by referring the sorption data to the amorphous dry polymer, assuming zero sorption in the crystalline phase, after the following equation.
x5
Figure 2 Average cluster sizes at 30°C.
Zimm and Lundberg27–29 provide a simple and adequate analysis to quantify the clustering phenomenon. They defined a “clustering function” (G 11 /V 1 ) for binary systems in equilibrium, based on the statistical mechanics of concentration fluctuations. The function is given by the following equation,
F
G 11 ~a 1/A 1! 5 2A 2 V1 a 1
G
21
(3)
P,T
where the subscript 1 refers to the penetrant, V 1 is its partial molar volume, A1 is the penetrant volume fraction, and G 11 is the clustering integral. The parameter A 1 G 11 /V 1 gives the average number of penetrant molecules in the neighborhood of a given molecule in excess of the mean concentration, and 1 1 A 1 G 11 /V 1 represents a measure of the cluster size. Thus, clustering is indicated when 1 1 A 1 G 11 /V 1 takes a value greater than one. The results of the analysis for PHB and the copolymers are shown in Figure 2. As can be seen in this figure, clustering is clearly indicated at high activities. The values of 1 1 A 1 G 11 /V 1 lower than 1 that appear in the lower activity range (0 – 0.2) suggest a limited, but discernible, segregation of the water molecules.29 This is related to a slight concavity that appears in the sorption isotherms of all samples with respect to the abscissa axis in this range. This kind of concavity, more commonly found in hydrophilic polymers, is usually interpreted in terms of a segregation effect of the sorbed water molecules attributable to
ln~a/A 1! 2 A 2 A 22
(4)
The high values obtained for x reflect the low level of interaction existing between polymer and penetrant. Accordingly, the general decrease of the interaction parameter with activity is consistent with the increase in the sorption levels attributable to the onset of clustering. This effect is particularly marked in the high-activity range. It has been said that the sharp drop in the interaction parameter at high activities can be ascribed to the onset of a nonrandomness effect in the mixing of polymer and water molecules, which can be identified with the existence of clustering in the present case.24,25 Unfortunately, the study of the interaction parameter alone does not provide the means to make a quantitative evaluation of the clustering effect.24 Temperature Influence Given the potential use of a polymeric material in diverse environmental conditions, it is always interesting to consider the effect of the temperature in its properties. Accordingly, water sorption isotherms were determined at four different temperatures (25, 30, 40, and 50°C) for a PBV8 sample (see Fig. 3), chosen as a representative of the set of polymers used in the preceding paragraph,
Table I Flory-Huggins Interaction Parameter for the PHB–Water System Water Activity
Interaction Parameter
0.20 0.31 0.40 0.51 0.64 0.74 0.81 0.91 0.93
3.06 3.04 3.02 2.95 2.96 2.91 2.80 2.53 2.40
WATER TRANSPORT PROPERTIES IN PHB AND [P(HB-HV)]
Figure 3 Water sorption results at various temperatures for a PBV8 sample.
given the similarity in their sorption behavior. By applying the Arrhenius equation to the sorption data, the enthalpy of sorption, DH S , can be evaluated26: K H 5 K 0Hexp~ 2 DH S/RT!
(5)
where K H represents the sorption data expressed in (cm3STP/cm3 cmHg), being K 0H a pre exponential factor. By plotting the logarithm of K H versus 1/T for several selected concentrations, linear relationships were obtained, and the sorption enthalpies were easily calculated from the slopes. The corresponding mixing enthalpies (DH M ) can be evaluated from the relation.16 DH S 5 DH M 1 DH C
(6)
where DH C is the water condensation enthalpy, taken as 43.47 Kj/mol.33 The results are presented in Table II. DH M tends to decrease toward zero when the water concentration increases, as expected in systems showing clustering. At high
Table II Water/PBV8 Mixing Enthalpies at Several Concentrations Concentration (g/100 g of Polymer)
DH M (g/cm3)
0.07 0.20 0.33 0.46 0.72
13.5 5.82 3.50 1.15 0.74
459
Figure 4 Simultaneous variation of the weight sorbed by the polymer and the relative humidity in the sorption chamber, in a typical experiment performed using the dynamic method (sample: PBV8).
concentrations, the incoming water molecules tend to be sorbed in the surroundings of other already sorbed molecules, rather than in the polymer chains. In this manner, the amount of mixing between penetrant and polymer is greatly reduced, which is reflected in the dependence of DH M with the concentration.32,34 As stated before, we have found the dynamic method unsuitable for the determination of diffusion coefficients because of the long time required to fill the sorption chamber with the desired relative humidity. In fact, the water uptake in the sample proceeds at the same rate than the change in humidity in its surroundings, as can be observed in Figure 4. Therefore, the Fickian equations traditionally used to calculate diffusion coefficients from sorption kinetic data cannot be employed here, because this analysis requires an instantaneous set of the selected humidity.35 Consequently, the motivation to introduce the static sorption method was the need to establish an experimental setup adequate for the determination of the diffusion coefficient, which is the essential parameter to characterize the kinetic features of the sorption process.
STATIC SORPTION EXPERIMENTS Sorption measurements were performed at 40°C and various water activities between 0.20 and 0.95, according to the previously described static method. PHB and PBV14 samples were chosen as representatives of the low 3HV range set of P(HB-
460
MIGUEL AND IRUIN
the corresponding results for a PBV14 sample. Neither the shape of the curves nor the absolute sorption levels differ significantly from those obtained in the preceding section (compare with Fig. 1). In particular, the shape of the curves indicates the existence of water clustering at this stage, as has already been demonstrated in the preceding sections. The kinetic sorption data obtained are used in the following paragraphs to calculate the diffusion coefficients that characterize the entrance of the water molecules in the penetrantfree polymer. Diffusion Figure 5 Water sorption results in PHB and PBV14 at 40°C corresponding to the maximum sorption level (static method).
HV) copolymers studied in the previous section. An additional PHB film was also used to study the variation of the diffusion coefficient with the temperature in the 30 –50°C interval at three activities (0.30, 0.65, and 0.80). In a typical sorption measurement, the weight gained by the polymer film increased until a plateau was apparently reached. This plateau conforms to a maximum in the water uptake, which takes place within 10 and 25 min after the vapor is admitted to the balance chamber, depending upon the film thickness and the water activity. If more data are recorded after the maximum, it is possible to see that the weight uptake tends to decrease slowly with time. Experiments lasting up to 3 days were required to reach a true equilibrium in the water uptake. The difference between the maximum water uptake and the equilibrium sorption was small at low-to-medium water activities, and only at the highest water vapor pressures applied was the extent of sorption significantly altered with respect to the apparent first maximum. The magnitude of this effect becomes more marked with the temperature, having a reduced effect at 30°C. These phenomena (the initial sorption and the consequent weight loss) is addressed in the following paragraphs as two separate sections. Initial Sorption Stages The 40°C PHB water sorption data corresponding to the maximum water uptake at the different activities are plotted in Figure 5, together with
PHB Case When a polymer film is suddenly put in an atmosphere with a constant concentration of a certain penetrant, the weight gain of the polymer attributable to the sorption process is given by the solution of the Fick’s second law, which, for a constant diffusion coefficient, is35: Mt 8 512 2 M` p
O ~2n 11 1! `
2
n50
S
3 exp 2 ~2n 1 1! 2
Dp2 t ,2
D
(7)
where Mt denotes the mass gain at time t, M` is the equilibrium mass gain, n is an integer, , is the film thickness, and D is the diffusion coefficient. To calculate the diffusion coefficient, it is customary to apply the long time approximation of the above equation to the Mt versus t experimental data,35
S
ln 1 2
D S D
Mt 8 Dp2 5 ln 2 2 2 t M` p ,
(8)
From a plot of ln(1 2 M t /M ` ) versus t, the diffusion coefficient can be easily calculated from the slope of the linear portion of the graph. In the present study, the mass gain corresponding to the maximum plateau (M max) is used instead of M ` in eqs. (7) and (8), which is originally defined as a true equilibrium value. A typical example of the fitting of eq. (8) is presented in Figure 6. In the same figure, a fitting of the whole solution of Fick’s Law [eq. (7)] is also included, taking a series term number of n 5 5. As can be observed, the fitting of both equations is excellent, and the curve can be described by a constant diffusion
WATER TRANSPORT PROPERTIES IN PHB AND [P(HB-HV)]
Figure 6 Diffusion analysis for a water sorption experiment in PHB. Conditions: 40°C and 54.0% relative humidity. The continuous and dotted lines correspond, respectively, to the fittings of eqs. (7) and (8), as described in the text.
coefficient. Therefore, it can be stated that the first stages of the water sorption process in an initially degasified PHB film can be considered purely Fickian. The results for the water diffusion coefficients in PHB at 40°C, obtained from eq. (8), are shown in Figure 7. Interestingly, although it has been shown that each sorption kinetic can be described by a constant value of D, it is also true that the diffusivity varies from one experiment to another at a different relative humidity. It is not easy to find an explanation for this behavior; however, it is worth noting that the diffusion coefficient apparently varies in parallel with the water activity, in the sense that both remain constant for a given experiment; whereas, they change from one experiment to another. When the diffusion coefficients are plotted against the water concentration in the polymer, a linear relationship is observed, with the exception only of the data obtained at the highest water activity (a 5 0.94). Similar trends have been observed for water diffusion in several poly(alkylmethacrylates).33 This situation allows extrapolation to zero concentration to obtain the infinite dilution diffusion coefficient, D 0 5 1.73 3 10 28 cm2/s, a value that is midway between those of PVC (D 0 5 5 3 10 28 cm2/s)24 and PET (D 0 5 0.9 3 10 28 cm2/s)23 at 40°C. Thus, the concentration dependence of the diffusion coefficient in a relative humidity range of approximately 0 – 85%, can be expressed as follows: D~10 29cm2/s! 5 17.30 2 16.25 3 C (g/100 g)
(9)
461
This behavior of the diffusion coefficient is fully consistent with the clustering phenomenon: the increase in diameter of the diffusing species attributable to cluster formation would be accompanied by an increased difficulty for their displacement through the polymeric network, thus reducing the over-all diffusion coefficient with the activity.16 This interpretation is dealt with in more depth in the Discussion section. The diffusion coefficients presented in Figure 7 are of the same order of magnitude as those presented elsewhere for the same system.21 However, in that case, the trend observed was exactly opposite to that in the present work; that is, the diffusion coefficient increased linearly from 1.15 3 1028 to 2.35 3 1028 cm2/s for a concentration range of 0 to 1.2 g/cm3 at 25°C. Unfortunately, it is difficult to give a reasonable explanation for this discrepancy, because little information is given in the mentioned work about either the experimental technique used or the polymer characterization features, such as the glass transition and the crystallinity degree of the samples used. The variation of the diffusion coefficient with temperature has been investigated at 30, 40, and 50°C, at water activities of 0.30, 0.65, and 0.80 for a fresh PHB sample. The diffusion data, obtained according to eq. (8), are shown in Figure 8. Again, linearity is observed when plotting the diffusion coefficients versus water sorption, allowing the extrapolation to zero concentration diffusion coefficients. By applying the Arrhenius equation to the diffusion data26 D 5 D 0exp~ 2 E D/RT!
Figure 7 40°C.
(10)
Water diffusion coefficients in PHB, at
462
MIGUEL AND IRUIN
Figure 8 Water diffusion coefficients in PHB, at 30, 40, and 50°C, respectively.
the thermodynamic parameters related to this magnitude (the diffusional energy of activation E D and the pre exponential factor) can be evaluated at several concentrations. The results are presented in Table III. The increase of E D with the water concentration in the polymer can be interpreted in terms of the difficulty associated with the movement of the aggregates of water molecules through the polymer matrix.18,36 The zero concentration value of the energy of activation is very similar, although slightly inferior, to the results for other commodity thermoplastics, such as PVC (42 kJ/mol)24 and PET (43.5 kJ/mol).23
PBV14 Case The PBV14 sorption data obtained by the static method are presented in Figure 5. These results do not differ significantly from those of PHB. The shift of the PBV14 data to higher values can be most reasonably attributed to a slightly lower degree of crystallinity than PHB, given the chemical similarity existing between both polymers.
Table III Thermodynamic Parameters for the PHB/Water System Concentration (g/100 g)
E D (kJ/mol)
D 0 (cm2/s)
0.00 0.15 0.35 0.50
38.0 38.5 39.4 40.2
0.0335 0.0359 0.0425 0.0514
Figure 9 Diffusion analysis for a water sorption experiment in PBV14. Conditions: 40°C and 84.3% relative humidity. The continuous and dotted lines correspond, respectively, to the fittings of eqs. (7) and (8), as described in the text.
All the features depicted in the previous paragraphs for the PHB-water system are, in principle, extensible to the case of PBV14. However, some differences were found in the diffusion analysis. The representation of ln(1 2 M t /M max) versus time [see eq. (8)] led to plots with two different linear portions, from which two different diffusion coefficients could be calculated. One example is given in Figure 9. Although this behavior occurred in all the experiments performed with PBV14, in some of them, the second straight line was not clear enough to obtain a confident diffusion coefficient, especially in the experiments at the two lowest water activities. We have called D 1 and D 2 the diffusion coefficients corresponding to the first and the second linear portions of the graphs. We have also calculated an over-all diffusion coefficient (D F ) by fitting the complete solution of Fick’s law [eq. (7)], taking also a series term number of n 5 5. The fit of this equation is shown in the same figure for the same set of data. As can be observed, the experimental data are not perfectly well fitted by the curve generated using a single constant diffusion coefficient. This situation corresponds to the case of “two stage” sorption kinetics,38,39 which can be an indication of minor structural changes in the polymer accompanying the sorption process. Fickian kinetics control the initial stages of rapid water sorption, the process being characterized by a D 1 diffusion coefficient. After a transition period, there follows a second stage that,
WATER TRANSPORT PROPERTIES IN PHB AND [P(HB-HV)]
Figure 10 Water diffusion coefficients in PBV14, at 40°C.
although having a small influence in the over-all shape of the sorption curves (with the exception of the experiment performed at 94% RH, not shown), is clearly reflected in the change of slope of the ln(1 2 M t /M max) versus time plots. The second stage is described by a D 2 coefficient, smaller than D 1 . The values of D 1 , D 2 , and D F are plotted in Figure 10 against concentration. The over-all coefficient D F takes a value close to D 1 , which illustrates the reduced relative importance of the processes leading to a change in the diffusion coefficient, as compared with the Fickian contribution to diffusion. D 1 and D F are slightly higher than the diffusion coefficients obtained for PHB at 40°, being all of the same order of magnitude.
463
Figure 11 Long-time sorption experiments in a PHB film, at 40°C. The relative humidity at which each experiment was performed is indicated in the figure.
sorption kinetics are plotted in Figure 11. As can be seen in the figure, the maximum plateau taking place after the Fickian transient regime appears in this time scale as a sharp peak in all cases. Additional tests performed with copolymer samples revealed an identical sorption behavior. It is worth considering that the data corresponding to the maximum plateau define an upper limit in the water sorption capacity of the polymer, which can be of even more technological concern than the lower equilibrium solubilities. In Figure 12, the sorption data corresponding to the maxima and the equilibrium are plotted together with the PHB data already shown in
Long-Time Sorption Phenomena As has already been explained, the static sorption experiments were characterized by a weight loss observed shortly after a maximum plateau was reached. As will be shown, this effect proved to be particularly significant at the highest relative humidities applied, but not in the intermediate-tolow range. Some representative results obtained for PHB at four relative humidities between 20 and 95% RH and 40°C are shown in this section. The sample weight was recorded until the equilibrium in the sorption process was reached. Blank runs were also performed in the same conditions with the sample pan empty to correct for the sorption in the balance mechanism. The resulting water
Figure 12 Comparison between the equilibrium and the maximum sorption data in PHB; the dotted line represents the PHB sorption results showed in Figure 5.
464
MIGUEL AND IRUIN
Table IV Percentage Weight Loss (see Text) and Average Cluster Size in PHB at 40°C and Various Relative Humidities Relative Humidity
% WL
1 1 A 1 G 11 /V 1
20.8 66.8 85.3 93.5
4 6 32 35
1.1 1.6 2.7 3.4
PERMEATION EXPERIMENTS The water vapor permeation through PHB and P(HB-HV) films was measured in triplicate, using fresh films, to check the reproducibility. The water vapor transmission rate (WVTR), which is the vapor mass flux normalized to the film thickness and the water activity difference across the membrane, was calculated from10 WVTR 5 8.64 3 10 5
Figure 5 for comparison. The percentage weight loss (% WL) with respect to the maxima in the sorption curves, calculated after %WL 5 100 3 ~M max 2 M `!/M max
(11)
(where M max and M ` refer to the weight gain in the maximum and in the equilibrium), is presented in Table IV. The average cluster sizes, calculated after the PHB sorption data from Figure 5 (which were obtained in the same experimental conditions as in the present case), are also included in this table. Interestingly, the amount of weight loss seems to correlate qualitatively with the average cluster size in the maximum plateau; that is, immediately before the weight loss process becomes measurable: high degrees of clustering are coincident with high weight losses. These observations seem to suggest that, although cluster formation is allowed during the first sorption stages, the clusters tend to become disaggregated during the course of the macromolecular relaxations responsible for the weight losses. However, this picture raises the question of why the dynamic experiments, leading to similar sorption levels, do not show evidence of such processes. The amount of nitrogen sorbed at 1 atm of pressure is of the order of 1 milligram of gas in 100 grams of PHB; accordingly, it can be considered negligible if compared with the water sorption levels, particularly at the higher activities, and seems to have little effect in the water sorption features. However, the speed of filling the balance with water vapor seems to play a more determining role in the present discussion. A probable explanation could lie in the fact that in the dynamic experiments, the final water activity is reached relatively slowly, giving ample time for the polymer chains to reach conformations consistent with the presence of the water molecules within the polymeric network.
Q3, A~1 2 a ext!
(12)
where Q (g/s) is the slope of the straight part of the permeated mass versus time plots, , (mm) is the film thickness, A (cm2) is the exposed area of the membrane, a ext is the water activity in the exterior of the permeation cell, and WVTR is expressed in units of (g mm/m2 day). Table V lists the WVTR data together with the standard deviations of the measurements. These results seem to indicate that, as in the case of sorption, the permeability is essentially independent of the 3HV content of the copolymer, the differences observed being probably attributable to small differences in the crystallinity of the samples. This behavior has been mentioned in the literature,6 but without giving any quantitative information. Finally, it may be of interest to compare the results obtained from the sorption and permeation experiments. As is well known, a permeability coefficient can be calculated as the product of the solubility and diffusion coefficients obtained from sorption techniques.16 In principle, this relationship applies to ideal systems in which these coefficients are nonconcentration dependent; however, a tentative estimation can be attempted using the water/PHB sorption data. From the water sorption and diffusion data in PHB at 30°C and 0.66 activity (0.368 g/100 g and 6.78 1029 cm2/s, respectively); that is, in conditions equivalent to those in the permeation experiments, a
Table V Water Vapor Transmission Rates through PHB and P(HB-HV) at 30°C
% 3 HV
WVTR (g mm/m2 day)
Standard Deviation
0 8 14 24
1.16 0.92 1.39 1.22
0.08 0.03 0.19 0.12
WATER TRANSPORT PROPERTIES IN PHB AND [P(HB-HV)]
465
value of 0.40 g mm/m2 day can easily be obtained. Being of the same order of magnitude as the experimental value of 1.16 g mm/m2 day, it can be stated that the agreement between the results obtained from both techniques (sorption and permeation) is acceptably consistent.
DISCUSSION In this section, the PHB sorption and diffusion results are analyzed further to obtain a deeper insight into the relationship between water and poly(hydroxyalkanoates). We focus on the early stages of the sorption process; that is, from time zero until a constant weight is reached for a short time, before subsequent weight losses. This period of time is also of particular interest, because the diffusion of the water molecules takes place into an initially penetrant-free polymer. Modeling is attempted to explain the clustering of the water molecules in the polymer, an effect that has been shown to influence the water transport properties in several ways. Finally, the mobility coefficients are introduced to give a new interpretation of the diffusion features.
Sorption The analysis of Zimm and Lundberg, together with other results already presented in this work, such as the concentration dependence of D, DH S , E D , and the Flory–Huggins interaction parameter, are consistent with the interpretation of the sorption data in terms of the clustering or aggregation of the sorbed molecules. This is usually understood in terms of the pre eminence of water–water over polymer–polymer interactions, in particular H bond formation between water molecules. The water clustering phenomenon has also been interpreted as a random polycondensation process in a relatively inert media.33,34,40,41 The water molecule is treated as a monomer of the A 2 B 2 type, polymerizing via AB bond formation. Further details about the model and its application can be found in the cited works of Barrie; the main assumptions and mathematical expressions involved are reviewed next. The concentration of monomeric water molecules sorbed in the polymer (C 1 ) after the polycondensation model is given by
Figure 13 Application of the polycondensation model to PHB sorption data.
C1 5
~k 2 K! 4 16C 3
(13)
where k 5 (K 2 1 4KC) 1/ 2 , C is the over-all water concentration, and K is the equilibrium constant for breaking a hydrogen bond, given by the model as K 5 ( 32 )C sat. C sat stands for the saturation concentration; that is, the total water sorption at unity penetrant activity. Assuming that monomer sorption is related to the applied water partial pressure through Henry’s Law, then the final isotherm equation can be written as follows. a5
27 ~k 2 K! 4 64 kC 3
(14)
The model also provides an estimation of the mean cluster size, which is related to the mean degree of polymerization (dp) as Z 5 1/~1 2 2dp!
(15)
where dp can be obtained from the relationship dp 5 1 2 (C 1 /C) 1/4 . Because an accurate determination of the saturation concentration is experimentally difficult by gravimetric means, the value of C sat has been obtained as an adjustable parameter. Thus, eq. (14) has been fitted to the sorption data by means of a nonlinear regression analysis, and the C sat value obtained in this way has been used to calculate the concentration of free monomeric water after eq. (13). The results of these calculations are presented in Figure 13. The general agreement
466
MIGUEL AND IRUIN
Table VI Application of the Polycondensation Model to the Water Clustering Analysis for the Water/ PHB System Water Activity
Cluster Size: Zimm and Lundberg
Cluster Size: Polycondensation Model
0.21 0.35 0.54 0.68 0.75 0.84 0.94
1.1 1.1 1.2 1.6 2.1 2.7 3.4
1.1 1.3 1.5 1.8 2.0 2.4 3.4
between the model and the experimental data is excellent up to a 95% relative humidity, especially if we take into account its mathematical simplicity and the fact that it includes only an adjustable constant parameter. The experimental and calculated values for the average cluster size are displayed in Table VI, again showing a reasonable agreement between both sets of data. It is of particular interest to consider the estimation provided by the model for the concentration of the free, “unclustered” water molecules. This concentration is relatively small when compared to the total sorbed water, remaining always under a value of 0.2 g/100 g. The shape of the C1 versus activity curve does not follow the sharp upturn of the total water concentration curve, which is generally seen as a first indication of the existence of clustering when found in moderately hydrophilic polymers. This figure also indicates that most of the water present in the polymer at high activities is sorbed in the form of clusters, because C increases much more drastically than C1 with activity. The prediction of C 1 provided by the polycondensation model also allows us to give an estimate of the absolute number of clusters formed in the polymer. We can define the quantity N(S) as the total number of sorption sites per 100 grams of polymer as N~S! 5
NA 18
S
C
D
G 11 1 1 A1 V1
water molecules can be found; that is, the absolute number of clusters: N~Z! 5 N~S! 2
NA C 18 1
(17)
The results obtained for N(S) and N(Z) after these simple equations are shown in Figure 14, together with the average cluster size. As can be seen in the figure, both the number of sorption sites and the number of clusters increase almost linearly from zero activity up to a roughly constant value at solubilities over 0.3 g/100 g (or activities over 0.5). It indicates that above this value, no new sorption sites are created, neither as clusters nor as isolated molecules, so that the newly sorbed water molecules go preferentially to the clusters formed at lower activities. Accordingly, the sharp increment in the cluster size that takes place above activity 0.5 is favored by the fact that essentially no new clusters are formed in this range.
(16)
where N A is the Avogadro number. N(S) means the number of sites in the polymer where water can be found, either as an isolated molecule or as a cluster of any size. By subtracting the number of monomeric water molecules present in the polymer from N(S), we can obtain an estimation of the number of sorption sites in which two or more
Figure 14 Comparison between the estimations of the number of sorption sites, N(S), the number of clusters, N(Z), and the Zimm and Lundberg average cluster sizes.
WATER TRANSPORT PROPERTIES IN PHB AND [P(HB-HV)]
467
Diffusion A different interpretation of the diffusion features can be devised by means of the study of the mobility coefficient (L) of the diffusing species. As pointed out by Crank,16,35 the diffusion coefficient as usually obtained from Fick’s first law, J 5 2D
dC dx
(18)
is complicated by the presence of a mass flow effect that overlaps the true diffusion resulting from random molecular motions. Accordingly, new coefficients were defined, such as the intrinsic diffusion coefficient, related to the rate of mass transfer across a hypothetical section that moves so that no mass flow takes place through it, or the self-diffusion coefficients, measured under conditions in which no mass flow occurs by using radioactively labeled molecules. An alternative approach to the study of the contribution of the true molecular motions to the diffusivity is the definition of the mobility factor. This subject has been addressed by several authors.30,40,42 If the penetrant mass flux ( J) is written in terms of the thermodynamic driving force, the chemical potential gradient, Fick’s law becomes for a unidimensional flux26 J 5 2$
dm dx
(19)
where the element of proportionality is the thermodynamic diffusion coefficient, $. By substituting the chemical potential differential after d m 5 RTd ln a, and comparing eqs. (18) and (19), we find the relationship between the experimental and thermodynamic diffusion coefficients: ln a D 5 $RT C
S
D
$RT ln a 5 La C ln C
is, the gradient of the chemical potential. On the other hand, the term $RT/C represents the penetrant mobility (L), which has a purely kinetic meaning and is determined by the local frequencies of molecular motions and frictional interactions.30 All these quantities are plotted in Figure 15. Given the shape of the thermodynamic factor curve, its influence on the magnitude of D becomes evident. After this contribution is eliminated from the diffusion coefficient, the resulting mobility shows a very different behavior: the monotonous decrease of D appears now as a curve with a maximum and a less pronounced descent with C. The shape of the L versus C curve can be qualitatively analyzed under the light of the existence of two competing effects. In the free volume theory of diffusion, the mobility coefficient, as defined in eq. (21), can be expressed by26: L 5 ART exp~ 2 B/f!
(22)
(20)
which can be rewritten as D5
Figure 15 Concentration dependence of the PHB diffusion coefficient (D), mobility coefficient (L), and thermodynamic factor (a).
(21)
In this manner, the apparent diffusion coefficient is separated into two different contributions.42 The thermodynamic factor a has a magnitude related to the variation of the thermodynamic driving force of the diffusive process; that
where f is the fractional free volume, B is a parameter that has been interpreted as the critical hole size for a diffusional jump, and A is also a parameter of the system. The existence of a penetrant-induced plasticization effect at intermediate concentrations might be responsible for the increase in mobility in this range, via an increment in the free volume of the polymer. At higher concentrations, clustering becomes predominant, so that the resulting mobility is reduced because of the increased critical hole size required for the movement of the polymolecular entities (clusters).
468
MIGUEL AND IRUIN
CONCLUSIONS Water transport properties have been investigated for PHB and P(HB-HV), a family of fully biodegradable polymers with the added value of having a pure biological, non-oil-dependent, synthetic origin. From the results presented in this work, it can be considered that PHB and its hydroxyvalerate copolymers offer a good barrier against water vapor transmission. Their water transport properties are similar to those of other conventional thermoplastics of moderate hydrophobicity, such as PVC and PET. These features, together with those of hydrolysis resistance and nonswelling in presence of water, make poly(3-hydroxyalkanoates) a class with a unique combination of properties among the more traditional biodegradable polymers, with a promising future facing the development of practical applications in several fields. Financial support of UPV/EHU (project n. 203.215EB173/95) and the Departamento de Economı´a de la Diputacio´n de Gipuzkoa is gratefully acknowledged. O. M. thanks the Basque Government for funding in the form of Grant BFI94.113AE.
REFERENCES 1. 2. 3. 4. 5.
6.
7.
8.
9. 10. 11.
12.
Byrom, D. Int Biodet Biodegrad 1993, 31, 199. Mod Plast June 6, 1981. Holmes, P. A. Phys Technol 1985, 14, 32. Inoue, Y.; Yoshie, N. Prog Polym Sci 1992, 15, 571. Marchessault, R. H.; Bluhm, T. L.; Deslandes, Y.; Hamer, G. K.; Orts, W. J.; Sundarajan, R.; Taylor, M. G.; Bloembergen, S.; Holden, D. A. Makromol Chem Macromol Symp 1988, 19, 235. Cox, M. K. in Biodegradable Plastics and Polymers; Doi, Y.; Fukuda, K., Eds., Elsevier: Amsterdam, 1994. Bloembergen, S.; Holden, D. A.; Hamer, G. K.; Bluhm, T. L.; Marchessault, R. H. Macromolecules 1986, 19, 2865. Bluhm, T. L.; Hamer, G. K.; Marchessault, R. H.; Fyfe, C. A.; Veregin, R. P. Macromolecules 1986, 19, 2871. Kunioka, M.; Tamaki, A.; Doi, Y. Macromolecules 1989, 22, 694. Miguel, O.; Fernandez Berridi, M. J.; Iruin, J. J. J Appl Polym Sci 1997, 64, 1849. Miguel, O.; Ward, R.; Alfageme, J. A.; Iruin, J. J. in Proceedings of the 3rd International Symposium Euromembrane ’97, ESMST, University of Twente: The Netherlands, 1997. Miguel, O.; Barbari, T. A.; Iruin, J. J. J Appl Polym Sci 1999, 71, 2391.
13. Schult, K. A.; Paul, D. R. J Appl Polym Sci 1996, 61, 1865. 14. Park, J. K.; Bontoux, L. J Appl Polym Sci 1991, 42, 2989. 15. Perrin, L.; Nguyen, Q. T.; Clement, R.; Neel, J. Polym Int 1996, 39, 251. 16. Crank, J.; Park, G. S. in Diffusion in Polymers; Crank, J.; Park, G. S., Eds., Academic: London, 1968. 17. Guo, C. J.; De Kee, D. J Appl Polym Sci 1992, 44, 18. 18. Hernandez, R. J.; Gavara, R. J Polym Sci Part B Polym Phys 1994, 32, 2367. 19. Palin, M. J.; Gittens, G. J. J Appl Polym Sci 1975, 19, 1135. 20. Reid, R. C.; Prausnitz, J. M.; Sherwood, T. K. The Properties of Gases and Liquids, 3rd ed., McGrawHill: New York, 1977. 21. Iordanskii, A. L.; Razumovskii, L. P.; Krivandin, A. V.; Lebedeva, T. L. Desalination 1996, 104, 27. 22. Razumovskii, L. P.; Iordanskii, A. L.; Zaikov, G. E.; Zagreba, E. D.; McNeill, I. C. Polymer Deg & Stab 1994, 44, 171. 23. Hubbell, W. H.; Brandt, H.; Munir, Z. A. J Polym Sci Part B Polym Phys 1975, 13, 493. 24. Williams, J. L.; Hopfenberg, H. B.; Stannet, V. J Macromol Sci-Phys 1969, B3(4), 711. 25. Orofino, T. A.; Hopfenberg, H. B.; Stannet, V. J Macromol Sci-Phys 1969, B3(4), 777. 26. Vieth, W. R. Diffusion in and Through Polymers; Hanser: Mu¨nchen, 1991. 27. Zimm, B. H.; Lundberg, J. L. J Phys Chem 1956, 60, 425. 28. Lundberg, J. L. J Macromol Sci-Phys 1969, B3(4), 693. 29. Lundberg, J. L. J Pure Appl Chem 1972, 31, 261. 30. Meares, P. Phil Trans R Soc Lond B 1977, 278, 113. 31. Stannet, V.; Haider, M.; Koros, W. J.; Hopfenberg, H. B. Polym Eng Sci 1980, 20, 300. 32. Schneider, N. S.; Dusablon, L. V.; Spano, L. A.; Hopfenberg, H. B. J Appl Polym Sci 1968, 12, 527. 33. Barrie, J. A.; Machin, D. Trans Faraday Soc 1970, 67, 244. 34. Barrie, J. A.; Machin, D. J Macromol Sci-Phys 1969, B3(4), 645. 35. Crank, J. The Mathematics of Diffusion, 2nd ed.; Clarendon Press, Oxford, 1975. 36. Beck, M. I.; Tomka, I. J Macromol Sci-Phys 1997, B36(1), 19. 37. Perrin, L.; Nguyen, Q. T.; Sacco, D.; Lochon, P. Polym Int 1997, 42, 9. 38. Schult, K. A.; Paul, D. R. J Polym Sci Part B Polym Phys 1997, 35, 655. 39. Berens, A. R.; Hopfenberg, H. B. J Polym Sci Part B Polym Phys 1979, 17, 1757. 40. Barrie, J. A. in Diffusion in Polymers, Crank, J.; Park, G. S., Eds.; Academic Press Inc.: London, 1968. 41. Barrie, J. A.; Platt, B. Polymer 1963, 4, 303. 42. Doghieri, F.; Sarti, G. C. J Polym Sci Part B Polym Phys 1997, 35, 2245.