S I N G A P O R E
RW e e t ea ki ll y M Sa ur pk pe ot r Mt o an ni dt o r R e s i s t a n c e W a t c h
Thursday, 02 April 2015
MONTHLY REVIEW AND OUTLOOK
TOP BUY
REVIEW: The FSSTI ended 1Q15 on a positive note, rising 2.4% ytd. Investor interest was focused on external developments such as US interest rates, geopolitical risks (airstrikes on Yemen) and M&A deals in the US. Talks of further stimulus in China also provided a lift to China’s equity market. On the domestic front, Singapore mourned the passing of its founding father Mr Lee Kuan Yew. Sentiment for Sembcorp Marine was impacted by news that the Brazilian authorities have arrested, on bribery-related claims, a person related to consultants hired by Sembcorp Marine. The appreciation of the US dollar vs the Singapore dollar (of 4.5% ytd) led to buying interest in stocks with overseas exposure, including Venture and SingTel. Otherwise, sectors that underperformed include oil services (-6.3% mom), land transport (-3.6% mom) and supply chain (-3.5% mom). STRATEGY: We maintain a 2015 year-end target of 3,600 for the FSSTI. Investors should adopt a selective stance in view of limited earnings visibility and external issues such as weaker growth in China and the EU and rising interest rates in 2H15. Valuation remains reasonable as the FSSTI’s FY15F PE of 14.6x is at a 9% discount to long-term mean valuation of 16.0x. Investment themes we favour include: a) winners and losers of rising interest rates, b) AEC/ASEAN Open Skies beneficiaries, and c) regulatory changes. Our key picks in the big-cap space include DBS, OCBC, CapitaLand, CCT, SingTel and Sembcorp Industries. As for mid-caps, buy Wing Tai, Ezion and Silverlake. Our SELLs include SIA Engineering, StarHub and IHH.
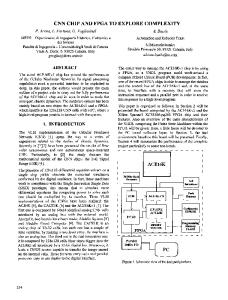
Sector FSSTI Technology Healthcare Telecoms Media Plantation
Mar/Feb (% chg) 1.3 5.3 4.4 3.3 2.4 1.6
Recommendation
Top Buys
Overweight Market Weight Market Weight Market Weight Market Weight
Finance
1.6
Overweight
Venture Top Sell: IHH SingTel First Resources, Bumitama DBS, OCBC
Shipyard REITs Shipping Property
1.2 0.3 0.0 (0.6)
Market Weight Market Weight Overweight Overweight
SCI CCT, CD REIT NOL CapitaLand, Wing Tai
Aviation Others Supply Chain LandTransport OilServices
(1.3) (1.7) (3.5) (3.6) (6.3)
Market Weight Market Weight Market Weight Overweight
Top Sell: SIA Engrg Ezion, Pacific Radiance
Company CSE Global Pacific Radiance FirstRes Bumitama Ezion
Target Price (S$) 0.84 1
Last Price (S$) 0.555 0.665
Return (%) 51.4 50.4
2.8 1.45 1.55
1.89 1.005 1.075
48.1 44.3 44.2
Target Price (S$) 0.45 1.8
Last Price (S$) 0.54 2.15
Return (%) (16.7) (16.3)
3.5 3.98 2.14
4.01 4.35 2.2
(12.7) (8.5) (2.7)
Source: Bloomberg, UOB Kay Hian
TOP SELL Company Rotary Engineering Ltd IHH SIA Engg StarHub CapitaMall
Source: Bloomberg, UOB Kay Hian
Analyst's Views
All three Singapore banks saw sequential pullback in fee income and net trading income in 4Q14. Provisions have increased but loan-loss coverage has improved in tandem. Maintain OVERWEIGHT as recent increases in SIBOR and SOR should have a positive impact on NIM starting 2Q15 and asset quality should stay resilient.
We believe the market has over-discounted the negative prospects for the residential segment and prefer deep value and diversified developers with Wing Tai and CapitaLand as our key picks.
Oil companies are cautious in spending but opportunistic towards service providers. They are shifting from capex to opex amid the lower oil prices.
Source: Bloomberg, UOB Kay Hian
Singapore Research Team +65 6535 6868
[email protected]
w w w . u t r a d e . c o m . s g
1
S I N G A P O R E
RW e e t ea ki ll y M Sa ur pk pe ot r Mt o an ni dt o r R e s i s t a n c e W a t c h
Thursday, 02 April 2015
OUR TOP YIELD STOCK PICKS Company HPH Trust US$ CACHE AscottREIT Frasers HTrust CDL Htrust MapletreeInd
Rec BUY BUY BUY BUY BUY BUY
Target Price (S$) 0.8 1.35 1.42 1.02 2 1.66
Price 31 Mar 15 (S$) 0.695 1.175 1.245 0.895 1.755 1.58
Upside (%) 15.1 14.9 14.1 14.0 14.0 5.1
Monthly Performance % Chg 0.0 0.4 (4.2) 0.0 (0.8) 2.3
2014 (x) n.a. 16.1 25.7 20.2 16.4 16.1
PE
Monthly Performance % Chg (8.9) 2.4 (3.4) (0.2) 0.9 0.0
2014 (x) 5.6 13.6 14.4 9.5 11.5 22.5
Monthly Performance % Chg (5.9) (3.6) (11.9) 7.9 6.2 (2.0)
2014 (x) 8.1 5.1 9.3 5.9 33.3 14.4
2015F (x) 26.9 15.1 18.4 18.9 14.9 15.9
Yield 2015F (%) 7.8 7.4 7.2 6.9 6.5 6.5
2015F (x) 5.9 11.4 13.2 9.4 12.1 19.3
Yield 2015F (%) 4.5 2.6 1.5 3.8 3.4 4.9
2015F (x) 8.1 5.3 11.2 14.8 28.6 14.1
Yield 2015F (%) 5.0 0.1 6.3 3.1 3.2 2.9
OUR TOP LARGE MARKET CAPITALISATION STOCK PICKS Company
Rec
Pacific Radiance FirstRes Bumitama Sembcorp Ind OCBC CapitaComm
BUY BUY BUY BUY BUY BUY
Target Price (S$) 1 2.8 1.45 5.2 12.65 2.06
Price 31 Mar 15 (S$) 0.665 1.89 1.005 4.22 10.57 1.765
Upside (%) 50.4 48.1 44.3 23.2 19.7 16.7
PE
OUR TOP MID-SMALL MARKET CAPITALISATION STOCK PICKS Company
Rec
CSE Global Ezion Lantrovision Wing Tai Silverlake Axis Boustead Sp
BUY BUY BUY BUY BUY BUY
Target Price (S$) 0.84 1.55 0.655 2.5 1.66 2.04
Price 31 Mar 15 (S$) 0.555 1.075 0.48 1.92 1.37 1.7
Upside (%) 51.4 44.2 36.5 30.2 21.2 20.0
PE
Source: Bloomberg, UOB Kay Hian
* To learn more about specific recommendations, talk to your trading representative today.
w w w . u t r a d e . c o m . s g
2
S I N G A P O R E
RW e e t ea ki ll y M Sa ur pk pe ot r Mt o an ni dt o r R e s i s t a n c e W a t c h
Thursday, 02 April 2015
OUR INSTITUTIONAL RESEARCH COVERAGE Target Price (S$)
Price 31 Mar 15 (S$)
Upside (%)
Monthly Performance % Chg
2014 (x)
2015F (x)
Yield 2015F (%)
HOLD SELL HOLD HOLD HOLD
12.6 3.5 3.11 3.6 0.34
11.95 4.01 3.08 3.48 0.320
5.4 (12.7) 1.0 3.4 6.3
(0.4) (5.6) (2.5) (0.9) 10.3
49.8 23.2 18.4 20.4 n.a. 35.2
15.6 21.7 17.7 19.8 11.9 17.8
4.6 4.0 4.5 4.3 0.0 4.3
FINANCE ARA DBS
BUY BUY
1.94 23.55
1.615 20.36
20.1 15.7
(0.9) 4.0
15.6 12.5
12.3 12.2
3.8 2.8
OCBC
BUY
12.65
10.57
19.7
0.9
11.5
12.1
3.4
S'pore Exchange @ UOB@ Sector
NR NR
n.a. n.a.
8.14 23
n.a. n.a.
(0.5) (0.3)
27.2 11.6 12.1
25.6 11.2 12.1
3.6 3.3 3.2
SELL HOLD
1.8 4.3
2.15 3.93
(16.3) 9.4
4.9 1.0
60.1 32.5 55.1
46.2 29.4 43.4
0.4 1.4 0.5
HOLD HOLD
3.31 1.73
2.89 1.6
14.5 8.1
(1.7) (8.0)
21.7 25.1 22.7
19.1 19.4 19.3
2.8 2.8 2.8
HOLD
4.3
4.19
2.6
2.4
16.8 16.8
22.6 22.6
4.8 4.8
OIL SERVICES Ezion
BUY
1.55
1.075
44.2
(3.6)
5.1
5.3
0.1
Ezra Marco Polo @ Nam Cheong Pacific Radiance
HOLD NR HOLD BUY
0.7 n.a. 0.33 1
0.42 0.275 0.305 0.665
66.7 n.a. 8.2 50.4
(19.2) (5.2) (3.2) (8.9)
7.2 9.2 5.5 5.6
5.8 5.6 6.5 5.9
0.0 3.6 4.4 4.5
Swiber Triyards Sector
SELL BUY
0.52 1.1
0.168 0.385
209.5 185.7
(2.3) (2.5)
3.7 3.4 5.9
14.2 2.4 5.5
0.0 2.6 1.6
Company AVIATION SIA SIA Engg SATS ST Engrg Tigerair Sector
HEALTHCARE IHH Raffles Medical Sector LAND TRANSPORT ComfortDelGro SMRT Sector MEDIA SPH Sector
Rec
w w w . u t r a d e . c o m . s g
PE
Analyst's Views
DBS has an overwhelming competitive advantage with a CASA ratio at 89% for the Singapore dollar, which accounted for 39.2% of its total loans. We expect net interest margin to expand to 1.74% by 4Q15 as interest rates rise. Having completed merger integration, management is working on revenue synergies and cost efficiency at OCBC Wing Hang.
The downturn of the E&P industry is fast and furious with an austerity drive permeating across the entire industry. However, we expect investors to differentiate stocks as companies report the extent of the negative impact.
We had earlier flagged Pacific Radiance’s poor 4Q14 subsea performance. While DSV demand is gradually returning, we now expect the poor subsea performance to continue into 1H15.
3
S I N G A P O R E
RW e e t ea ki ll y M Sa ur pk pe ot r Mt o an ni dt o r R e s i s t a n c e W a t c h
Thursday, 02 April 2015
OUR INSTITUTIONAL RESEARCH COVERAGE Company
Rec
Target Price (S$)
Price 31 Mar 15 (S$)
Upside (%)
Monthly Performance % Chg
2014 (x)
PE 2015F (x)
Yield 2015F (%)
PLANTATION Bumitama
BUY
1.45
1.005
44.3
(3.4)
14.4
13.2
1.5
FirstRes
BUY
2.8
1.89
48.1
2.4
13.6
11.4
2.6
GoldenAgri IndoAgri KencanaAgri Wilmar Sector
BUY HOLD HOLD HOLD
0.48 0.97 0.23 3.65
0.425 0.74 0.19 3.26
12.9 31.1 21.1 12.0
4.9 5.7 (7.3) 0.6
37.9 13.0 23.8 14.2 15.9
13.8 10.4 11.4 11.1 11.6
2.8 0.8 1.4 2.5 2.4
PROPERTY CapitaLand
BUY
4.08
3.58
14.0
(0.3)
13.1
23.6
2.2
City Devt GuocoLand Ho Bee Land Keppel Land OUE Wing Tai
HOLD BUY BUY BUY BUY BUY
10.84 2.48 2.68 4.296 2.8 2.5
10.06 1.82 2.15 4.45 2.16 1.92
7.8 36.3 24.7 (3.5) 29.6 30.2
(1.7) (1.4) 5.9 (2.0) (2.7) 7.9
12.1 6.9 4.6 9.1 1.8 5.9
13.6 18.0 20.7 14.2 24.0 14.8
1.6 2.7 1.4 2.9 1.9 3.1
8.7
17.4
2.3
n.a.
64.6
0.3
n.a.
64.8
0.3
Sector SHIPPING NOL
BUY
1.01
1.005
Sector
w w w . u t r a d e . c o m . s g
0.5
0.0
Analyst's Views
We expect the strong nucleus FFB production to continue to grow 22-24% yoy in 2015, albeit slightly affected by the prolonged dry weather in 2H14. FR is always our top pick given its attractive age profile, cost-efficient estates and hands-on management. It will continue to expand its plantation assets and improve productivity to sustain growth.
Management will focus on expanding the group’s S$18b AUM with new private equity partners. There is notable interest in emerging markets like Indonesia, while the company retains focus in core markets in Singapore and China.
Wing Tai is trading near crisis levels (0.46x P/B), implying a 50% fall in asset prices, which is unjustified. Management is on the lookout for acquisition opportunities in overseas markets like Malaysia and China to deploy its S$1.2b debt headroom.
NOL’s share price has dropped 22% since endJune to a five-year low, driven by the expectation of a third year of losses, weak freight rates, port congestion on the US West Coast and the potential sale of its profitable logistics business.
4
S I N G A P O R E
RW e e t ea ki ll y M Sa ur pk pe ot r Mt o an ni dt o r R e s i s t a n c e W a t c h
Thursday, 02 April 2015
OUR INSTITUTIONAL RESEARCH COVERAGE Company SHIPYARD COSCO Corp Keppel Corp Sembcorp Ind
Sembcorp Marine Yangzijiang Sector SUPPLY CHAIN Noble Group Olam Sector TECHNOLOGY Venture Corp
Target Price (S$)
Price 31 Mar 15 (S$)
Upside (%)
Monthly Performance % Chg
2014 (x)
2015F (x)
SELL HOLD BUY
0.53 8.8 5.2
0.505 9 4.22
5.0 (2.2) 23.2
(2.9) 2.9 (0.2)
54.3 8.7 9.5
27.7 10.8 9.4
1.0 4.6 3.8
HOLD BUY
2.93 1.39
2.92 1.265
0.3 9.9
(2.3) 3.3
10.9 6.8 9.0
11.0 7.0 10.0
4.5 4.3 4.3
HOLD HOLD
1.13 2.25
0.92 1.985
22.8 13.4
(5.6) (0.7)
45.5 8.1 14.4
11.7 13.8 11.5
3.0 2.5 2.8
BUY
9.15
8.55
7.0
5.3
16.8
14.5
5.8
16.9
14.5
5.8
Rec
Sector TELECOMS M1 S Telecoms
StarHub Sector OTHERS Genting HK US$ Genting SP HPH Trust US$ SingPost SuperGroup Sector
PE
Yield 2015F (%)
HOLD BUY
3.6 4.62
3.9 4.38
(7.7) 5.5
(1.5) 3.8
20.6 18.4
19.9 17.1
4.0 4.4
SELL
3.98
4.35
(8.5)
1.4
20.3 18.8
20.9 17.5
4.6 4.4
HOLD BUY BUY BUY HOLD
0.38 1.32 0.8 2.27 1.43
0.36 0.92 0.695 1.96 1.49
5.6 43.5 15.1 15.8 (4.0)
2.9 (6.6) 0.0 (2.0) 24.7
19.6 21.7 n.a. 27.1 24.1 n.a.
17.7 16.7 26.9 23.9 26.0 20.3
2.0 1.1 7.8 3.2 1.9 3.5
w w w . u t r a d e . c o m . s g
Analyst's Views
SCI is powering ahead with large power projects – especially in India – which will come on-stream in 2014-16. Our earnings forecasts are largely intact.
Venture is aiming for mid- to high-single-digit growth in top- and bottom-lines for 2015. It continues to differentiate itself through a highly diversified product portfolio and strong engineering and R&D capabilities.
Regional mobile associates were key growth drivers with spectacular growth from Telkomsel and Bharti Airtel. Optus has turned around with the expansion of subscriber base for both postpaid and pre-paid services while ARPU has increased.
5
S I N G A P O R E
RW e e t ea ki ll y M Sa ur pk pe ot r Mt o an ni dt o r R e s i s t a n c e W a t c h
Thursday, 02 April 2015
OUR INSTITUTIONAL RESEARCH COVERAGE Company
Rec
Target Price (S$)
Price 31 Mar 15 (S$)
Upside (%)
Monthly Performance % Chg
2014 (x)
PE 2015F (x)
Yield 2015F (%)
REITS Ascendasreit AscottREIT CACHE CapitaComm
BUY BUY BUY BUY
2.73 1.42 1.35 2.06
2.59 1.245 1.175 1.765
5.4 14.1 14.9 16.7
4.9 (4.2) 0.4 0.0
18.1 25.7 16.1 22.5
17.1 18.4 15.1 19.3
6.0 7.2 7.4 4.9
CapitaMall CDL Htrust
SELL BUY
2.14 2
2.2 1.755
(2.7) 14.0
4.3 (0.8)
20.3 16.4
20.3 14.9
5.0 6.5
FrasersCT Frasers HTrust Kep REIT MapletreeInd MapletreeLog PLife REIT Sabana REIT Starhill Gbl Suntec REIT Sector
HOLD BUY BUY BUY HOLD HOLD SELL BUY HOLD
2.23 1.02 1.42 1.66 1.32 2.52 0.98 0.93 2.08
2.02 0.895 1.2 1.58 1.245 2.36 0.9 0.835 1.855
10.4 14.0 18.3 5.1 6.0 6.8 8.9 11.4 12.1
(1.0) 0.0 (3.2) 2.3 1.2 (3.3) (2.2) (0.6) (5.1)
19.2 20.2 23.3 16.1 16.8 22.9 16.0 16.6 31.1 20.5
18.3 18.9 23.6 15.9 17.2 19.9 13.2 16.7 25.3 18.7
5.7 6.9 5.8 6.5 6.1 5.1 8.7 6.0 5.6 5.8
Analyst's Views
Our visit to the recently-completed CapitaGreen reinforces our view of its role as a key growth driver for CapitaCommercial Trust. With precommitment at levels near 70%, leasing enquiries remain strong, particularly from non-traditional players. The outlook for 1Q15 remains weak due to softer demand and seasonality, but we expect RevPAR to stabilise from 2Q15, driven by major events like SEA Games and positive sentiments surrounding the SG50 celebrations.
If year end is before June, earnings are shown in the previous period @ Consensus forecast
w w w . u t r a d e . c o m . s g
6
S I N G A P O R E
RW e e t ea ki ll y M Sa ur pk pe ot r Mt o an ni dt o r R e s i s t a n c e W a t c h
Thursday, 02 April 2015
OUR RETAIL RESEARCH COVERAGE Price 31 Mar 15 (S$) 0.625 1.7
Upside
BUY BUY
Target Price (S$) 0.75 2.04
(%) 19.2 20.0
Monthly Performance % Chg (6.0) (2.0)
2014 (x) 12.5 14.4
2015F (x) 8.8 14.1
Yield 2015F (%) 4.4 2.9
Centurion China Aviation Oil Cordlife Group Ltd Courts Asia Ltd CSE Global
BUY BUY HOLD HOLD BUY
0.86 1.03 0.87 0.62 0.84
0.525 0.835 1.035 0.46 0.555
63.8 23.4 (15.9) 34.8 51.4
(7.9) 12.8 6.2 (1.1) (5.9)
15.7 7.6 19.2 7.7 8.1
12.7 6.7 16.7 6.4 8.1
2.6 3.3 0.0 3.9 5.0
Ellipsiz Guocoleisure Ltd Hafary Holdings Ltd Halcyon Agri Corp China Everbright Hi-P Isoteam Ltd
BUY BUY BUY HOLD HOLD BUY BUY
0.171 1.03 0.275 0.64 0.95 0.73 0.725
0.131 0.92 0.2 0.715 0.945 0.6 0.6
30.5 12.0 37.5 (10.5) 0.5 21.7 20.8
36.5 (1.1) (7.0) 20.2 (1.0) 0.0 1.7
11.3 14.6 12.2 n.a. 38.0 92.9 11.6
9.5 10.9 9.6 21.9 29.6 9.1
4.1 0.0 6.5 0.0 0.0 1.7 1.7
Kori Holdings Ltd KrisEnergy Ksh Holdings Ltd Lantrovision
HOLD BUY BUY BUY
0.355 1.18 0.71 0.655
0.45 0.54 0.51 0.48
(21.1) 118.5 39.2 36.5
2.3 (6.9) (1.9) (11.9)
9.0 n.a. 3.8 9.3
6.4 10.1 11.2
4.4 0.0 0.0 6.3
Osim International Overseas Education Pan-United Corp Ltd QT Vascular Resources Prima Rex International RH PetroGas Riverstone Rotary Engineering Silverlake Axis Ltd
BUY BUY HOLD BUY BUY BUY BUY BUY SELL BUY
2.4 0.94 1.04 0.6 0.295 1.27 1 1.09 0.45 1.66
1.96 0.82 0.805 0.27 0.112 0.305 0.305 1.19 0.54 1.37
22.4 11.0 29.2 122.2 163.4 316.4 227.9 (8.4) (16.7) 21.2
(2.5) 1.9 (5.8) (10.0) 19.1 (14.1) (14.1) 0.8 (6.9) 6.2
14.8 16.0 9.9 n.a. n.a. n.a. 26.6 19.0 6.1 33.3
14.5 14.7 9.4 n.a. 506.9 n.a. 12.9 16.0 23.0 28.6
3.1 3.1 5.0 0.0 0.0 0.0 0.0 2.4 4.6 3.2
SingHaiyi Sino Grandness Smartflex Tai Sin Tiong Woon Ying Li International Yongnam Holdings Zico
BUY BUY BUY BUY BUY BUY HOLD BUY
0.24 0.63 0.25 0.45 0.455 0.4 0.25 0.57
0.152 0.31 0.23 0.35 0.193 0.225 0.14 0.415
57.9 103.2 8.7 28.6 135.8 77.8 78.6 37.3
8.6 (27.9) 24.3 (2.8) (8.1) (2.2) (17.2) (7.8)
16.2 4.0 17.5 6.8 4.8 15.2 4.7 16.0
22.4 1.9 8.5 7.5 4.7 3.3 15.0
0.0 0.0 3.7 6.4 2.1 0.0 0.0 0.0
Company
Rec
Amtek Boustead Sp
PE
Analyst's Views
We continue to favour Boustead as the company continues to secure new contracts and grow its industrial property portfolio. The Boustead Development Partnership will boost the capabilities of Boustead Projects in financing a significantly larger pipeline of projects.
Group MD Mr Lim sees pocket of opportunities as the company continues to secure maintenance orders from existing clients. The group will work with the current orderbook as 60% will be fulfilled in 2015 besides the short maintenance contracts of S$50m-70m per quarter
Excluding the strong net cash of about S$0.10/share, ISO is currently trading at only 6.3x FY16F PE. Potential catalysts include continued strong order win momentum, leading up to the general elections.
We see Lantrovision as an investment proxy to the increasingly smart world with the rise in data centres, cloud computing and network of sensors. Trading at a compelling ex-cash PE of 4.2x with a FY15F dividend yield of 4.6%, we believe Lantrovision offers good value at current levels.
The maintenance and enhancement segment continues to propel the group forward as net margins improve. In addition, we note that the group is in a good position to capitalise on any potential banking consolidations within Indonesia.
Source: Bloomberg, UOB Kay Hian
w w w . u t r a d e . c o m . s g
7
S I N G A P O R E
RW e e t ea ki ll y M Sa ur pk pe ot r Mt o an ni dt o r R e s i s t a n c e W a t c h
Thursday, 02 April 2015
Disclosures/Disclaimers This report is prepared and/or distributed by UOB Kay Hian Pte Ltd (“UOBKH”), which is a holder of a capital markets services licence and an exempt financial adviser in Singapore. This report is provided for information only and is not an offer or a solicitation to deal in securities or to enter into any legal relations, nor an advice or a recommendation with respect to such securities. This report is prepared for general circulation. It does not have regard to the specific investment objectives, financial situation and the particular needs of any recipient hereof. Advice should be sought from a financial adviser regarding the suitability of the investment product, taking into account the specific investment objectives, financial situation or particular needs of any person in receipt of the recommendation, before the person makes a commitment to purchase the investment product. This report is confidential. This report may not be published, circulated, reproduced or distributed in whole or in part by any recipient of this report to any other person without the prior written consent of UOBKH. This report is not intended for distribution, publication to or use by any person in any jurisdiction outside Singapore or any other jurisdiction as UOBKH may determine in its absolute discretion, where the distribution, publication or use of this report would be contrary to applicable law or would subject UOBKH and its connected persons (as defined in the Financial Advisers Act, Chapter 110 of Singapore) to any registration, licensing or other requirements within such jurisdiction. The information or views in the report (“Information”) has been obtained or derived from sources believed by UOBKH to be reliable. However, UOBKH makes no representation as to the accuracy or completeness of such sources or the Information and UOBKH accepts no liability whatsoever for any loss or damage arising from the use of or reliance on the Information. UOBKH and its connected persons may have issued other reports expressing views different from the Information and all views expressed in all reports of UOBKH and its connected persons are subject to change without notice. UOBKH reserves the right to act upon or use the Information at any time, including before its publication herein. Except as otherwise indicated below, (1) UOBKH, its connected persons and its officers, employees and representatives may, to the extent permitted by law, transact with, perform or provide broking, underwriting, corporate finance-related or other services for or solicit business from, the subject corporation(s) referred to in this report; (2) UOBKH, its connected persons and its officers, employees and representatives may also, to the extent permitted by law, transact with, perform or provide broking or other services for or solicit business from, other persons in respect of dealings in the securities referred to in this report or other investments related thereto; (3) the officers, employees and representatives of UOBKH may also serve on the board of directors or in trustee positions with the subject corporation(s) referred to in this report. (All of the foregoing is hereafter referred to as the “Subject Business”); and (4) UOBKH may otherwise have an interest (including a proprietary interest) in the subject corporation(s) referred to in this report. As of the date of this report, no analyst responsible for any of the content in this report has any proprietary position or material interest in the securities of the corporation(s) which are referred to in the content they respectively author or are otherwise responsible for. Each research analyst of UOBKH who produced this report hereby certifies that (1) the views expressed in this report in any event accurately reflect his/her personal views about all of the subject corporation(s) and securities in this report; (2) the report was produced independently by him/her; (3) he/she does not carry out, whether for himself/herself or on behalf of UOBKH or any other person, any of the Subject Business involving any of the subject corporation(s) or securities referred to in this report; and (4) he/she has not received and will not receive any compensation that is directly or indirectly related or linked to the recommendations or views expressed in this report or to any sales, trading, dealing or corporate finance advisory services or transaction in respect of the securities in this report. However, the compensation received by each such research analyst is based upon various factors, including UOBKH’s total revenues, a portion of which are generated from UOBKH’s business of dealing in securities. IMPORTANT DISCLOSURES FOR INCLUDED RESEARCH ANALYSES OR REPORTS OF FOREIGN RESEARCH HOUSES Where the report is distributed in Singapore and contains research analyses or reports from a foreign research house, please note: (i) recipients of the analyses or reports are to contact UOBKH (and not the relevant foreign research house) in Singapore in respect of any matters arising from, or in connection with, the analysis or report; and (ii) to the extent that the analyses or reports are delivered to and intended to be received by any person in Singapore who is not an accredited investor, expert investor or institutional investor, UOBKH accepts legal responsibility for the contents of the analyses or reports IMPORTANT DISCLOSURES FOR U.S. PERSONS This research report was prepared by UOBKH, a company authorized, as noted above, to engage in securities activities in Singapore. UOBKH is not a registered broker-dealer in the United States and, therefore, is not subject to U.S. rules regarding the preparation of research reports and the independence of research analysts. This research report is provided for distribution by UOBKH (whether directly or through its US registered broker dealer affiliate named below) to “major U.S. institutional investors” in reliance on the exemption from registration provided by Rule 15a-6 of the U.S. Securities Exchange Act of 1934, as amended (the “Exchange Act”). All US persons that
w w w . u t r a d e . c o m . s g
8
S I N G A P O R E
RW e e t ea ki ll y M Sa ur pk pe ot r Mt o an ni dt o r R e s i s t a n c e W a t c h
Thursday, 02 April 2015
receive this document by way of distribution from or which they regard as being from UOBKH by their acceptance thereof represent and agree that they are a major institutional investor and understand the risks involved in executing transactions in securities. Any U.S. recipient of this research report wishing to effect any transaction to buy or sell securities or related financial instruments based on the information provided in this research report should do so only through UOB Kay Hian (U.S.) Inc (“UOBKHUS”), a registered brokerdealer in the United States. Under no circumstances should any recipient of this research report effect any transaction to buy or sell securities or related financial instruments through UOBKH. UOBKHUS accepts responsibility for the contents of this research report, subject to the terms set out below, to the extent that it is delivered to and intended to be received by a U.S. person other than a major U.S. institutional investor. The analyst whose name appears in this research report is not registered or qualified as a research analyst with the Financial Industry Regulatory Authority (“FINRA”) and may not be an associated person of UOBKHUS and, therefore, may not be subject to applicable restrictions under FINRA Rules on communications with a subject company, public appearances and trading securities held by a research analyst account. Analyst Certification/Regulation AC As noted above, each research analyst of UOBKH who produced this report hereby certifies that (1) the views expressed in this report accurately reflect his/her personal views about all of the subject corporation(s) and securities in this report; (2) the report was produced independently by him/her; (3) he/she does not carry out, whether for himself/herself or on behalf of UOBKH or any other person, any of the Subject Business involving any of the subject corporation(s) or securities referred to in this report; and (4) he/she has not received and will not receive any compensation that is directly or indirectly related or linked to the recommendations or views expressed in this report or to any sales, trading, dealing or corporate finance advisory services or transaction in respect of the securities in this report. However, the compensation received by each such research analyst is based upon various factors, including UOBKH’s total revenues, a portion of which are generated from UOBKH’s business of dealing in securities.
Copyright 2015, UOB Kay Hian Pte Ltd. All rights reserved. http://research.uobkayhian.com MCI (P) 043/03/2015 RCB Regn. No. 198700235E
w w w . u t r a d e . c o m . s g
9