Visual Steering for Program Debugging Robert F. Erbacher Department of Computer Science, LI 67A University at Albany-SUNY 1400 Washington Avenue Albany, NY 12222, USA
[email protected]
Abstract Recent trends in the software industry have shown that the number of software development projects and their increasing complexity will continue to increase the demand for skilled programmers. However, debugging technology has not kept pace and valuable programmer resources are being wasted in debugging cycles. Correcting this trend requires innovative approaches to assisting programmers during the debugging cycle to make them more productive both time-wise and with respect to how thoroughly the application is tested and debugged. We have investigated techniques which allow programmers to visually steer an application. Through these new mechanisms, programmer’s can identify and locate problems without the need for revisiting the code (as is done in typical debugging cycles). Through steering the programmer can change the application environment to more thoroughly understand and test the algorithm.
1. Introduction As software systems become more complex and must handle ever increasing amounts of data, programmers are left with the burden of developing and maintaining these source code bases. In contrast, consumers are becoming frustrated with bug-laden software. It does not appear that this trend towards complexity will slow down any time soon. Consequently, new tools are needed to assist the programmer in testing and debugging the source code. This problem is analogous to the needs of programmer’s for concurrent systems in that both require additional debugging support but are unaware of or are unwilling to learn of the more advanced debugging tools that are available. Interestingly, while focus in recent years has focused more on serial systems than on concurrent systems, concurrent systems may be seeing a rebirth, albeit on a smaller scale in the form of SMP systems. With better support for SMP systems by both hardware and software manufacturers, these systems are providing an impressive price/performance ratio on high-end systems. This trend is becoming particularly popular in the high end PC/NT market. With the trend for high-end PC’s to eventually become mainstream, the use of SMP systems may eventually become ubiquitous. These factors indicate that new developments in debugging technology should support both serial and concurrent systems programming as newer applications will likely need to support both. The visual steering techniques we describe were originally developed for concurrent systems but were modified to support serial system. More specifically, our techniques provide interactive computational steering and direct manipulation of visual representations of the application. Our goal is to increase the interaction and thus the analysis and exploration of computations. We describe the use of interactive steering techniques for changing data values, controlling the flow of execution, and controlling the visualization display. These techniques help in exploring the data and computations, possibly identifying patterns, trends, or errors.
2. Previous Work Extensive research has already been done in developing techniques for visually representing data on serial (Balsa [Brown85]) and concurrent systems (Maritxu [Zabal92], IVE [Fried92], Prism [Sista92], Viscon [Erbac97]). Interaction issues have been given almost no attention. This is particularly true when considering advanced interaction techniques such as steering. Interactive computational steering is a technique through which the user can change parameters on the fly to help direct the program execution to more interesting results [Liere97]. Unfortunately, interactive steering has seen little application to program visualization where it could prove quite beneficial in reducing debugging time. The importance of interactive program steering to researchers, especially of concurrent systems, is shown by Gu et al. [Gu94]. Dynamic interaction with program parameters to tune the analysis process has likewise been shown [Becke94]. These interaction philosophies can be very important to the development of effective and useful tools. The ability to examine data values and change those values during program execution to aid in understanding and in testing has been widely used. Most serial debugging systems provide this ability as does the Poker environment [Snyde84] for concurrent systems. However, this modification is text-based. If this capability is to be used it must be more accessible, especially for large quantities of data. Changing data values during execution could prove to be very valuable. By allowing the user to specify not only a variable’s value explicitly but also the color that the value should generate, the programmer could easily watch the flow of data through the processors and observe where and how the value is modified.
3. Application Steering An important goal for our work is to provide techniques that will allow the user to interact directly with the executing program and make changes without having to restart the program. Our desire was to provide capabilities to aid the user in gaining an in-depth understanding of the program in a timely fashion without having to waste time editing, compiling, and rerunning the program. To this end, we explored the applicability of interactive computational steering to the debugging of concurrent programs. We explored the use of steering on different levels of the executing program. 3.1.
Program Level Steering
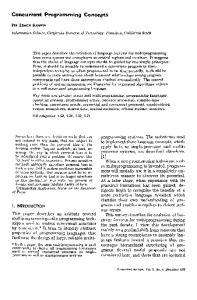
At the highest level, the user can slow down or speed up the execution rate of the program. A VCR like control panel is used to control the execution rate (Fig. 1). The VCR controls provides the ability to increase or decrease the execution rate by factors of 1/100 or 1/10, to pause the program, and to restart the program. While the program can be slowed, even to a complete stop, we currently do not allow the program to run in reverse. Allowing reverse
Fig. 1: Main interaction window with VCR controls
execution is a possibility since we are fully instrumenting the program but would require enormous data storage that we are unable to provide. Providing reverse execution would aid usability and should be available in a complete environment. This is not novel [Utter91] and should not be difficult to incorporate given the storage caveat. 3.2.
Instrumentation Level Steering
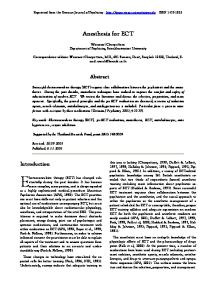
At the next level, the user can interactively control the instrumentation. By default, the instrumentation instructions force a display update whenever a variable upon which the display is dependent is modified. The default display updates can lead to awkward animations of the display as temporary results also force the display to be updated with the corresponding data. Updating the display during these temporary computations often is not what is desired. To reduce or even remove these artifacts the user can remove display updates from their default locations and force display updates at other locations. An example of this is shown in Fig. 2 in which an even-odd exchange sort is shown. The default instrumentation instructions cause updates to occur for intermediate results which generate unexpected displays.
Fig. 2: Example showing an even-odd exchange sort. The left image is unmodified and the intermediate result is shown. The duplication of pixel values is evident, a result of intermediate calculations. The right image shows the expected visual without the duplication of pixel values
Our ability to interactively modify instrumentation instructions while the program is running extends most work to date that has either incorporated full instrumentation of the program, without providing the user the ability to change the instrumentation, or forced the user to adjust the instrumentation, recompile, and re-execute the program. Having to manually change the instrumentation instructions can be a very time consuming approach. As the modifications to the instrumentation are window dependent, a user can thus have multiple windows examining the same executing program. One window may be set to display an optimal animation through the removal of display updates based on intermediate computation and the addition of updates at the end of an iteration or other appropriate locations. A second window can be geared towards only displaying intermediary computation, making it readily apparent when that intermediary computation is occurring. A third window can be used to show the unmodified display. Using such a multiple window approach gives the user unparalleled ability to select views of the application that are pertinent to the current task. The instrumentation modifications may also be removed on a window by window basis. The user may save or restore the state of the environment (i.e., window settings, parameters, execution state, etc.) at any time, permitting the appropriate instrumentation modification to be reloaded to test a new program version under the same characteristics.
4. Dynamic Data Manipulation Our work concentrates on the steering of data elements within a concurrent program rather than the processors or communication network of the architecture. Typically, it is the data resulting from a computation that the scientist is
interested in and it is the data from which the scientist will first be able to determine how the computation is progressing. Did it execute correctly? Is incorrect data being generated? Is there some undesired, unexpected, or incorrect trend? 4.1.
Data Representation
Since our principal focus was on interactive computational steering we only provide very basic data representation techniques. Our interactive steering, however, will apply directly to any visual representation. The techniques we provide include a simple scatter plot technique and a representation of the data elements as greyscale intensities (Fig. 3). For the latter, if the data does not naturally take the form of a matrix then it is forced into matrix form. The user can interact with an executing algorithm in several windows. Each window can display the same or different variables. Several algorithms may be running at the same time.
Fig. 3: The left image shows a sample of the scatterplot representation. The right image shows a sample of the greyscale intensity representation
4.2.
Technique
The lowest level of steering which we provide is direct modification of actual data values. Direct data modification is a more conventional steering technique except we can apply it to all types of data (concurrent data, serial data, elemental values, etc.) and allow entire regions of data to be modified simultaneously. The user can directly manipulate the data values of selected elements. By clicking the middle mouse button the user enacts the data modification operation. All values within the selected region have their values increased or decreased an amount corresponding to the distance the mouse is moved to the right or left. When data modification is enacted, a small window showing the values of the data elements surrounding the location where the user first clicked the middle mouse button is displayed. The actual numeric values of the data elements are shown. The background of the text boxes is set to be the greyscale intensity of the corresponding value (Fig. 4). The greyscale backgrounds provide for a more perceptually based representation. Since the background of the text box is much larger than the individual pixels in the visual display, the specific values of the elements are much more easily grasped. As values are changed the display is updated to correspond with the new values of the elements. To reduce the range of values the user is forced to deal with, we provide the ability to select the minimum and maximum range for all data interactions. The values of the data elements will be constrained to these boundary conditions. Setting multiple data elements to the same value is done by forcing all the elements to the minimum or maximum value in the preset range and then selecting the desired value.
Fig. 4: Example display with data manipulation being performed
While it is more common to pause execution of the program under investigation before modifying data values, it is not a necessity. The user may allow the program to continue executing while data modifications are being made. If data elements are being moved among processors or to different addresses then modifying data elements as the program executes could have the affect of continuously modifying different values as they pass through the selected region. It is also possible to modify only a single data element by not having a region selected when the data modification capability is enacted. The data element currently under the cursor will be modified. Data manipulation is not strictly limited to concurrent or array data. Any variable ultimately may be modified. By modifying selective variables it is possible to control the flow of execution and to direct this flow to regions of code that need testing. For example, it is possible to change variables used in the test conditions of “if” statements to force execution down specific branches. It is also possible to modify variables used in the control expressions of loops, functions calls, etc. We place no limitation on what data values may be changed. It is important to note that changing data values doesn’t always make sense. For example, consider a large application with many components. A common component of most applications is some form of sorting routine. It would make sense to modify data values before the sorting routine is called but doing so in the middle of the sorting routine would generate unusual results. However, if one wanted to explore the impact of a hardware fault on the sort routine, one could force a data element to be fixed and watch its effect (see Sect. 4.3). Providing for the modification of data elements makes it easier to test specific values. These values can be test conditions, boundary values, or any form of preconceived data to test the operation of the program. By combining data modification with data tagging it is possible to modify data elements to specific values and then highlight those elements so they can be easily traced. 4.3.
Persistent Vs. Instantaneous Interaction
The data level steering capability can be applied in one of two ways. The method used in the description of the previous section deals with the more conventional approach that we term instantaneous interaction. We propose a modification to the conventional interaction technique that we term persistent interaction. 4.3.1. Instantaneous (Conventional) Interaction Techniques Typically, when a user interacts with the environment the modifications take place immediately and when the user discontinues interaction the modifications terminate. In our environment, when the user is modifying data elements, the modification stops when the user no longer holds down the middle mouse button. There is a one to one correspondence between the user’s action and the modification to the data elements.
4.3.2. Persistent Interaction Techniques There are occasions when the instantaneous technique is insufficient. For example, a user may wish to have a region of values forced to a specific value continuously to change the characteristics of an algorithm or to change the environment that the algorithm is attempting to simulate. For such cases we use the term “persistent interaction.” When a user switches to persistent interaction mode the data modification process remains identical to what has been described previously. Internally however, instead of merely making the noted changes to the data elements, we maintain a list of all the persistent interactions made. Whenever an instrumentation instruction is executed which indicates a persistently modified variable has changed, the values of the elements are reset to the values initiated by the persistent modification. Note that only data elements that were specifically modified are reset; all other elements of the variable remain unchanged. When restarting an algorithm, the environment maintains the persistent interactions in effect. Thus, after a set of desirable interactions is designed, the user can restart the algorithm from the beginning to examine the execution of the algorithm with these new characteristics from start to finish. The method we use to incorporate persistent interaction into our environment is fundamental. We applied a common metaphor often used to continuously rotate 3D models. If the cursor is moving when the user releases the middle mouse button then the persistent mode of interaction will be selected. Otherwise, the instantaneous mode is selected. This interaction metaphor maintains the direct manipulation philosophy of the environment without losing the ability to choose between the instantaneous or persistent modes. To make the environment easier to use for all users we do support a toggle that will force the persistent interaction mode.
5. Verifying Execution Through Pre-Conceived Data Values We can use the persistent modification technique to execute the algorithm under different configurations. This allows the programmer to examine the environment under a variety of initial and boundary conditions. Will the algorithm work with different configurations? What about extreme cases? In this way the programmer can generate pre-conceived test data designed to make the algorithm fail. Normally, verification of the algorithm’s integrity under different configurations would require either modification of the algorithm itself to change the configuration or manual creation of environment description files, which would then require testing and debugging themselves. This can be extremely time consuming. Since the persistent interaction technique effectively guarantees that the selected elements will always be equal to a particular value we can use persistent interaction to create new configurations. Since this is done visually, while the program is running, there is none of the uncertainty inherent in other forms of testing and evaluation. Generating test scenarios using persistent interaction greatly reduces the amount of time required to test different types of configurations. It allows the user to generate, quickly and dynamically, new test scenarios without needing to repeatedly stop and restart the program. The user can make the modifications while the program is running such that the user can see the actual configuration they have created and make corrections instantly. Fig. 5 shows an example of a heat dissipation algorithm. Initially, there is no environment. We proceed by adding two barriers, a permanent source of heat, a permanent source of cold, and finally temporary sources of heat and cold. By looking at the result display, we can verify the correctness of the various components. The ability to save and restore the environment characteristics insures that we can create a variety of useful test scenarios, some of which may show errors in the algorithm, and restore them when we wish to re-test them on a new version of the algorithm. This not only provides a very effective testing and debugging facility but also provides an automatic environment configuration tool to any application incorporated into the VisCon environment without the need to write any additional code.
6. Verifying Data Values The user can use discrete interaction to test the effect of changing the default values of the elements in an environment. Fig. 5 shows examples of regions of values that have been set to a different value. The non-persistent modifications can change over the course of execution. As can be seen in the figures, the modified values will dissipate during the course of execution. This indicates the algorithm executes correctly. The user can use this to verify the correct execution of the algorithm even in areas where it does not appear that computation is taking place. It also allows the user to verify the correct execution of the algorithm in situations where it would usually take an extremely long time to get to a particular setup. By changing data values dynamically, we can setup the environment to some future stage and allow the application to execute normally from that point on. Thus, we can debug that future stage without having to wait till execution reaches that stage naturally.
Fig. 5: A heat dissipation algorithm, initially with no configuration. Images appear from left to right then top to bottom. To add the barriers we must modify a different variable, which we switch to (2nd and 3rd images). After creating the barrier we create a persistent source and sink. Finally we create a temporary source and sink
7. Conclusions We have developed interactive techniques that support and improve on the analysis and exploration of software applications. We have implemented these in a completely instrumented environment and developed techniques such as dynamic modification of the instrumentation instructions and persistent interaction. Dynamic modification of the instrumentation instructions also allows users to denote their own concept of what “visually” should be an atomic instruction. Through display update controls a user can prevent the updating of the display for routines that have already been verified correct or which too greatly interfere with the current focus of the analysis.
Ultimately, our goal is to allow the user to very quickly identify points of interest within a program at which errors, faults, or trends are being generated by showing values of interest immediately rather than at the end of the program run and providing the user the tools needed to identify that the values are of interest. These techniques are geared towards aiding the analysis and debugging process and not merely for program learning. Our techniques move away from program animation techniques that required specialized animations be developed for each application or algorithm.
8. Future Work Many of our techniques are dependent on the selected region of interest to which tagging and interaction are applied. The region selection is currently limited to rectangular areas. The techniques are directly scalable to arbitrary regions. There will be increased overhead to deal with more complex regions but this should be readily handled by today’s architectures. The persistent interaction techniques only set fixed values in the selected region. We are exploring the capability of having the region continuously incremented or decremented, and later to be set to some general function. While incorporating modified persistent interaction in itself is not difficult, incorporating an interaction metaphor that does not interfere with the current instantaneous and persistent interaction metaphors will be more difficult.
References [Becke94] [Brown85] [Erbac97]
[Fried92] [Gu94]
[Liere97] [Sista92]
[Snyde84] [Utter91] [Zabal92]
Richard Becker, Stephen Eick, and Allan Wilks, “Network Visualization,” AT&T Bell Laboratories, August 1994. M. H. Brown and R. Sedgewick, “Techniques for Algorithm Animation,” IEEE Software, Vol. 2, No. 1, 1985, pp. 28-39. Robert F. Erbacher, “Visual debugging of data and operations for concurrent programs”, Proceedings of the SPIE ‘97 Conference on Visual Data Ecploration and Analysis IV, San Jose, CA, February, 1997, pp. 120-127. Mark Friedell, Sandeep Kochhar, Mark LaPolla, and Joe Marks, “Integrated Software, Process, Algorithm and Application Visualization,” Journal of Visualization and Computer Animation, 1992. Weiming Gu, Jeffrey Vetter, and Karsten Schwan, “An Annotated Bibliography of Interactive Program Steering,” Georgia Institute of Technology College of Computing Technical Report GIT-CC-94-15, 1994. Robert van Liere, Jurriaan Mulder and Jack van Wijk., “Computational Steering,” Future Generation Computer Systems, Vol. 12, nr. 5, 1997. Steve Sistare, Don Allen, Rich Bowker, Karen Jourdenais, Josh Simons, and Rich Title, “Data Visualization and Performance Analysis in the Prism Programming Environment,” Programming Environments for Parallel Computing; Proceedings of the IFIP WG 10.3 Workshop on Programming Environments for Parallel Computing, Elsevier Science Publishers B.V., 1992, pp. 37-52. L. Snyder, “Parallel Programming and the POKER Programming Environment,” IEEE Computer, Vol. 17, No. 7, 1984, pp. 27-37. Sue Utter-Honig and Cherri Pancake, “Graphical Animation of Parallel Fortran Programs,” Proceedings of Supercomputing ‘91, IEEE Press, 1991, pp. 491-500. Eugenio Zabala and Richard Taylor, “Maritxu: Generic Visualisation of Highly Parallel Processing,” Programming Environments for Parallel Computing; Proceedings of the IFIP WG 10.3 Workshop on Programming Environments for Parallel Computing, Elsevier Science Publishers B.V., 1992, pp. 171-180.