IEEE INTERNATIONAL CONFERENCE ON SHAPE MODELING AND APPLICATIONS (SMI) 2010
1
Visual Similarity based 3D Shape Retrieval Using Bag-of-Features Zhouhui Lian1,2 , Afzal Godil1 , Xianfang Sun2 1 2
National Institute of Standards and Technology, Gaithersburg, USA
School of Automation Science and Electrical Engineering, Beihang University, Beijing, China
Abstract—This paper presents a novel 3D shape retrieval method, which uses Bag-of-Features and an efficient multiview shape matching scheme. In our approach, a properly normalized object is first described by a set of depth-buffer views captured on the surrounding vertices of a given unit geodesic sphere. We then represent each view as a word histogram generated by the vector quantization of the view’s salient local features. The dissimilarity between two 3D models is measured by the minimum distance of their all (24) possible matching pairs. This paper also investigates several critical issues including the influence of the number of views, codebook, training data, and distance function. Experiments on four commonly-used benchmarks demonstrate that: 1) Our approach obtains superior performance in searching for rigid models. 2) The local feature and global feature based methods are somehow complementary. Moreover, a linear combination of them significantly outperforms the stateof-the-art in terms of retrieval accuracy. Keywords-3D Shape Retrieval; Bag-of-Features; SIFT; Local Descriptor
1. I NTRODUCTION How to efficiently and effectively retrieve 3D models based on their shapes has become an active subject in several research communities such as computer vision, computer graphics, mechanical CAD, and pattern recognition. With the development of various kinds of 3D shape retrieval benchmarks (e.g. PSB [1], ESB [2], McGill [3], NSB [4] etc.) and the successful organization of the 3D SHape REtrieval Contest (SHREC) [5], more and more researchers have been attracted to work in this area and a large number of algorithms have been proposed. One of the most important research directions in 3D shape retrieval is Feature Extraction. Ideally, a good shape descriptor has the following desirable properties, 1) High discrimination; 2) Efficient shape matching; 3) Compact representation; 4) Efficient feature extraction; 5) Invariance to similarity transformations (in some cases, descriptors should also be articulation invariant [6]); 6) Invariance to shape representation; 7) Invariance to shape degeneracies and noises. Generally speaking, existing 3D shape descriptors can be loosely classified into four categories [7]: statistics-based, graphbased, transform-based, and view-based. Recent investigations [8], [7], [9] illustrate that view-based methods with pose normalization preprocessing get better performance in retrieving rigid models than other approaches
and more importantly they satisfy almost all characteristics mentioned above. Therefore, despite the fact that they have several intrinsic drawbacks (e.g. discarding invisible information of an object), view-based approaches are still without doubt the most popular and practical methods in the field of 3D shape retrieval. Up to now, probably because of the computational complexity of shape matching for local features, most of the view-based methods utilize only global shape descriptors to represent 2D views, which hinders the further improvement of retrieval performance. In fact, local features have been widely used in many computer vision applications [10]. The utilizations of local features usually result in better performance than the traditional methods using only global descriptors. Intuitively, it is reasonable to infer that similar techniques can be applied into 3D shape retrieval, especially for the view-based methods. Inspired by the work presented in [11] where Ohbuchi et al. reported two shape-based 3D object retrieval methods using salient visual local features, the first one represents the whole 3D model by a word histogram while the second one directly expresses and matches two normalized models via the salient local features. In this paper, we propose a new visual similarity based 3D shape retrieval approach which describes each view as a word histogram built using the vector quantization of salient local descriptors and employs an efficient multiview shape matching scheme to compute the distance between two 3D objects. An overview of the method is as follows: First, a 3D model is properly aligned to the canonical coordinate frame so that the normalized pose could be suitable for drawing standard three-view images and then depth-buffer views are captured on the surrounding vertices of a unit geodesic sphere. Afterwards, for each view we extract salient local features (e.g. SIFT [12]) which are subsequently quantized into a word histogram using the Bag-of-Features approach. Finally, according to the properties of the geodesic sphere previously used, an efficient shape matching can be carried out to measure the dissimilarity between two objects by computing the minimum distance of their all (24) possible matching pairs. To some extent, the proposed method is quite different from the BF-SIFT algorithm presented in [11]. Basically, our approach is a visual similarity based method, following the idea that “if two 3D models are similar, they
also look similar from all viewing angles”; while BFSIFT [11] is a “global Bag-of-Words based method”, that represents a 3D model as one histogram via the vector quantization of its local features using the Bagof-Words approach. Moreover, several new techniques have been developed to make our method be well suited for practical applications of 3D rigid shape retrieval, and results also demonstrate that our method markedly outperforms BF-SIFT [11] in terms of retrieval accuracy. The major contributions of this paper are twofold. 1) A novel visual similarity based 3D shape retrieval framework is proposed, where the Bag-of-Features method is utilized to describe each view as a word histogram and the objects are compared by an efficient multi-view shape matching scheme. 2) Exhaustive experiments are carried out carefully to investigate the influence of the number of views, codebook, training data, and distance function. Perhaps surprisingly, our results show that, in contrast to the traditional Bag-of-Features, the time-consuming clustering is not necessary for the codebook construction of our method. The rest of the paper is organized as follows. Section 2 discusses previous work. Section 3 presents an explicit description of our method. Experimental results are then demonstrated and analyzed in Section 4. Finally, we provide the conclusion of this paper in Section 5.
minimum distance of 6000 view group matching pairs, considering all possible situations. LFD method avoids pose normalization via an exhaustive searching which inevitably aggravates computational cost. To address this problem, Lian et al. [9] developed a multi-view shape matching scheme for properly normalized generic models. The experiments showed that, with the same image descriptors, retrieval performance including discrimination, spatial requirement and searching speed could be considerably improved compared to the original LFD method. As a matter of fact, pose normalization has been widely applied in many view-based 3D shape retrieval methods [22], [23], [8], [24], [25]. The major difference between them is the feature vectors they used to describe views. For instance, 2D Fourier coefficients [22], the elevation descriptor [23], and the depth-line descriptor [8] have been employed to represent depth-buffer views. Similarly, silhouette views have been expressed by the 2D shape distribution descriptor [24] and 1D Fourier coefficients [25]. The methods discussed above all utilized the images captured from viewpoints located on the sphere. Recently, Papadakis et al. [26] proposed a 3D shape descriptor using a set of panoramic views, which were obtained by projecting a 3D model to the lateral surface of a cylinder. The panoramic views were described by their 2D Discrete Fourier coefficients as well as 2D Discrete Wavelet coefficients. 2.2 Local feature based 3D shape retrieval
2. R ELATED W ORK
2D local features have proven to be very successful in many applications (e.g. image retrieval [27], object classification [28], and video data mining [29] etc.) and a vast number of 3D local features (e.g. 3D spin image [30], harmonic shape context [31], and 2.5D SIFT [32] etc.) have also been developed, however, just a few works have been reported to apply local features in 3D shape retrieval. This is mainly because of the high computational cost of shape matching for huge amounts of local descriptors extracted from 3D objects. Local feature based 3D shape retrieval is an interesting and promising research direction, since it has intrinsic capability of solving articulated shape retrieval and partial shape retrieval problems. Funkhouser and Shilane [33] selected distinctive multi-scale local features, which are calculated via Spherical Harmonic transformation, and applied Priority-Driven search to efficiently achieve partial matching. Gal et al. [34] proposed a curvaturebased local feature that describes the geometry of local regions on the surface and then constructed a salient geometric descriptor by clustering together a set of local descriptors which are interesting enough according to a given saliency function. Geometric Hashing was utilized to accelerate the partial matching of salient local features. Tal and Zuckerberge [35] decomposed each object into meaningful components, and then, based on the decomposition, they represented the 3D model as an attributed graph that is invariant to non-rigid transformations.
Based on the shape descriptors used, existing 3D shape retrieval methods can also be classified into two categories, global feature based methods and local feature based methods. In this section, we only discuss the most relevant work with respect to our approach. For more information about the development of 3D shape retrieval, we refer the reader to a recent survey [13]. 2.1 Global feature based 3D shape retrieval Most of the existing 3D shape retrieval methods belong to this category. So far, a large number of 3D global shape descriptors have been proposed such as D1 [14], D2 [15], Spherical harmonic descriptor (SHD) [16], 3D Wavelet descriptor [17], Skeleton descriptor [18], Reeb graph descriptor [19], Light field descriptor (LFD) [20], DESIRE [21], and so on. Since our 3D shape descriptor is designed to be able to measure the visual similarity between two objects, we pay more attentions to viewbased methods, which have been considered as the most discriminative approaches in the literature [1], [5]. Among these view-based methods, Light Field Descriptor [20] (LFD) method is perhaps the most famous one, where a 3D model is represented by 100 silhouettes (10 views per group) rendered from uniformly distributed viewpoints on the half side of a unit sphere and the silhouette is encoded by a feature vector consisting of 35 Zernike moments and 10 Fourier coefficients. They measured the dissimilarity between two objects by the 2
Bag-of-Features, which is a popular technique to speed up the matching of image local features, has recently been introduced into local feature-based 3D shape retrieval. Liu et al. [36] presented a compact 3D shape descriptor named “Shape Topics” and evaluated its application to 3D partial shape retrieval in their paper [36], where a 3D object was represented as a word histogram constructed by vector quantizing the local features of the object. Spin images, calculated on points randomly sampled on the surface, were chosen as the local descriptor. Li et al. [37] introduced a weak spatial constraint to the method proposed in [36] by partitioning a 3D model into different regions based on the clustering of local features’ spatial positions, but the improvement was limited. Toldo et al. [38] applied a more sophisticated mesh segmentation method to decompose a 3D object into several subparts. Each segmented region was represented by one descriptor and then a word histogram was generated by assigning all subpart descriptors of the object into visual words. Ohbuchi et al [11] reported a view-based method using salient local features (SIFT [12]). They represented a 3D object by a word histogram derived from the vector quantization of salient local descriptors extracted on the depth-buffer views captured uniformly around the object. Their experiments demonstrated that the method resulted in excellent retrieval performance for both articulated and rigid objects.
However, the codebook of our method can also be directly built using randomly sampled Nw local feature vectors. This has been verified by the experiments described later. 4) Multi-view Shape Matching: Carry out an efficient shape matching scheme to measure the dissimilarity between two 3D models by calculating the minimum distance of their 24 matching pairs.
3.2 Pose Normalization The key idea of our method is to measure the visual similarity between 3D objects with arbitrary poses, it is preferable if the models can be normalized in the manner that corresponds well with human perception. Therefore, we normalize the objects by a recently proposed approach [9] which combines the PCA (principal component analysis) based and the rectilinearity based pose alignment algorithms to obtain better normalization results. As we know, PCA is the most prominent tool for accomplishing rotation invariance by solving three principal axes of a 3D object. While the basic idea of the rectilinearity-based method (only suitable for the polygonal mesh) is to specify a standard pose through the calculation of the model’s rectilinearity value. Three steps of the composite method are described as follows. 1) Translation and scaling. For a given 3D mesh, translate the center of its mass to the origin and then scale the maximum polar distance of the points on its surface to one. 2) Rotation by two methods. Apply the PCA-based and the rectilinearity-based method, respectively, to rotate the original model to the canonical coordinate frame and then store these two normalized meshes in memory; 3) Selection. Calculate the number of valid pixels of three silhouettes, projected on the planes Y OZ, ZOX, XOY , for the two normalized meshes generated in the previous step. And then select the model, which yields the smaller value, as the final normalization result.
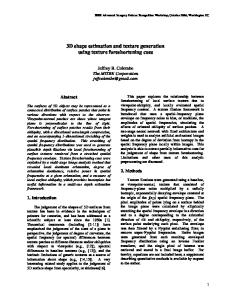
3. M ETHOD D ESCRIPTION In this section, we first present an overview of our method and then elaborate on the details of each step in the corresponding subsections. 3.1 Overview Since the method is mainly based on the Bag-ofFeatures approach and a multi-view shape matching scheme (named Clock Matching for the sake of convenience and intuition), we call it “CM-BOF” algorithm in this paper. The CM-BOF algorithm, depicted in Figure 1, is implemented subsequently in four steps: 1) Pose Normalization: Normalize 3D objects with respect to the canonical coordinate frame to ensure that their mass centers coincide with the origin, they are bounded by the unit sphere, and they are well aligned to three coordinate axes. 2) Local Feature Extraction: Capture depth-buffer views on the vertices of a given unit geodesic sphere whose mass center is also located in the origin and then extract salient local features from these range images. 3) Word Histogram Construction: For each view, quantize its local features into a word histogram using a pre-specified codebook. Normally, the codebook is obtained off-line by clustering the training data that are randomly sampled from the feature set of all models in the target database.
Two normalization examples are displayed in Figure 2. Note that, the method only performs incomplete pose normalization for rotation transformation. More specifically, only the positions of three axes are fixed for the model normalized by the composite method, that is, the direction of each axis is still undecided and the x-axis, y-axis, z-axis of the canonical coordinate system can be located in all three axes. That also means 24 different orientations are still plausible for the aligned models, or rather, 24 matching operations should be carried out when comparing two normalized objects. For more details of the pose alignment algorithm, we refer the reader to the paper [9] where convincing experimental results have been obtained to illustrate the advantage of this approach, in the context of pose normalization and 3D shape retrieval, against other methods. 3
Local-Feature-Extration
Pose-Normalization
Multi-view -Shape-Matching (Clock -Matching)
Word-Histogram -Construction
Fig. 1. An illustration of our method. First, a model is properly normalized. Second, depth-buffer views are captured from the vertices on a given geodesic sphere and then, for each view, we calculate salient SIFT descriptors [12]. Third, a word histogram is obtained by vector quantizing the view’s local features against the codebook, so that the object can be expressed by a set of histograms. Finally, an efficient shape matching is carried out to obtain the best match from all 24 matching pairs between two objects.
PCA
Rectilinearity
PCA
Rectilinearity
Selection
Selection
Final
Final
depth-buffer views are captured on the vertices of a given unit geodesic sphere whose mass center is also located in the origin. The geodesic spheres used here are obtained by subdividing the unit regular octahedron in the way shown in Figure 3. These kinds of polygonal meshes are suitable for our multi-view based shape retrieval mechanism, mainly because of the following three reasons. First, the vertices are distributed evenly in all directions. Second, these geodesic spheres enable different level resolutions in a natural manner. The coarsest (level-0) one is obtained using a unit regular octahedron with 6 vertices and 8 faces. Higher levels can be generated by recursive subdivisions. Third, since all these spheres are derived from an octahedron, given the positions of six vertices for the original octahedron, other vertices can be specified automatically. Moreover, all vertices are symmetrically distributed with respect to the coordinate frame axes. That means, when comparing two models, only 24 matching pairs need to be considered for the feature vector in an arbitrary level.
Fig. 2. Two alignment examples of the pose normalization method we use. The final result is chosen, using a selection criterion, from the normalization results of two methods.
Fig. 3.
After view rendering, a 3D object can be approximately represented by a set of depth-buffers from which we extract salient SIFT descriptors, as presented in [12]. The SIFT descriptor is calculated, using the VLFeat matlab source code developed by Vedaldi and Fulkerson [39], in the following two steps. First, obtain the scale, orientation, and position information of the salient points detected by the Different-of-Gaussian
Geodesic spheres generated from a regular octahedron.
3.3 Local Feature Extraction After pose normalization, 3D meshes have been well aligned to the canonical coordinate frame. Then their 4
(The-number-of-valid-bins) (Bin-No.) (The-number-of-salient-points-in-the-bin)
View -0 View -1
2 2 5 3
View -2
4
4
2 1
5 4 3 2 1
View -n
0
5 4 3 2 1 0 1 2 3
Feature Vector
3
4 4 0 1 2 3 4
2
Fig. 5. The data structure of our 3D shape descriptor that is composed of several word histograms.
time of the K-means clustering are significant, many other algorithms [40] (e.g. kd-tree, ERC-tree, and Locality sensitive hashing) have been applied to alleviate the computational cost. However, as we can see from the experiments described in Section 4.2, clustering is not necessary for the codebook construction of our method. In other words, randomly sampled local feature vectors can be directly used to create the vocabulary and these two codebook construction approaches result in almost the same discrimination for 3D shape retrieval. By searching for the nearest neighbor in the codebook, a local descriptor is assigned to a visual word. Then each view can be represented using a word histogram whose ith bin records the number of ith visual words in the depth-buffer image. In order to obtain satisfactory discrimination capability, usually the histogram should have thousands of bins. Let the number of views be 66 and the number of visual words in the codebook be 1500, without optimization, the 3D shape descriptor would be of dimension 99000. In fact, with the observation that, for our method, the average number of salient points in a view (with size 256 × 256) is only about 30, we can represent the histogram in a better way that not only makes the shape descriptor highly compact but also significantly improves the efficiency of dissimilarity calculation. Figure 5 demonstrates an example of the data structure for our 3D shape descriptor, where only the information (i.e. bin No. and bin value) of some bins, whose values are not equal to zero, appears in the feature vector. Experimental results show that, considering the method with 66 views and a 1500-dimension codebook, on average the new data structure requires about 30 times less spatial storage and performs approximately 21 times quicker for feature comparison.
Fig. 4. A demonstration on the robustness of the salient local descriptor against small viewpoint changes.
(DoG) approach. Second, compute SIFT descriptors for the local interesting regions which are determined by the scale and position of the salient points. Here, the SIFT descriptor, which is actually a 3D histogram of gradient location and orientation, is computed using its default parameters, where the location is divided into a 4 × 4 grid and the gradient angle is quantized into eight orientations. This results in a feature vector with 128 elements. The feature is designed to be robust, to some extent, against similarity transformation, affine distortion, noise and illumination changes of images. Figure 4 shows some examples of SIFT descriptors extracted from the range images which are scaled, rotated, and affine transformed. It can be seen that the SIFT descriptor is stable to various changes of 3D viewpoints, which is a desirable property for our visual similarity based 3D shape retrieval method to compensate its reliance on the stability of pose normalization. 3.4 Word Histogram Construction Directly comparing 3D models by their local visual features is time consuming, especially for the 3D shape retrieval methods using a large number of views. To address this problem, we quantize the SIFT descriptors extracted from a depth-buffer image into one word histogram so that the view can be represented in a highly compact and distinctive way. Before vector quantization, a codebook (also named as vocabulary) with Nw visual words should be created. Usually, the codebook is generated via off-line clustering. More specifically, huge numbers of feature vectors are first randomly sampled from the feature set of the target database to form a training set. Then, the training set is clustered into Nw clusters using the Kmeans algorithm. At last, centers of the clusters are selected as the feature vectors of visual words in the codebook. Since the spatial requirement and calculating
3.5 Multi-view Shape Matching The last step of our 3D shape retrieval method is the dissimilarity calculation (also called shape matching) between two shape descriptors. The multi-view shape matching (Clock Matching) scheme we use is originally proposed in [9], here we provide more details about this approach and apply it into our shape matching task with new distance measures. 5
The basic idea of Clock Matching is that, after we get the major axes of an object, instead of completely solving the problem of fixing the exact positions and directions of these three axes to the canonical coordinate frame, all possible poses are taken into account during the shape matching stage. The principle of the method is simple and reasonable, moreover, our previous experiments [9] have already illustrated considerable improvements against other approaches. As we mentioned above, 24 different poses still exist for a normalized model. Figure 6 shows all possible poses of a chair after pose alignment processing in the canonical coordinate frame. For the sake of convenience x+, x-, y+, y-, z+, and z- axis are denoted as 0, 1, 2, 3, 4, and 5, respectively. When comparing two models, one of them will be placed in the original orientation denoted as a permutation p0 = {p0 (k)|k = 0, 1, 2, 3, 4, 5} while the other one may appear in 24 different poses denoted as permutations pi = {pi (k)|k = 0, 1, 2, 3, 4, 5}, 0 ≤ i ≤ 23. From these 24 permutations (see the underneath of each small image in Figure 6), all possible matching pairs ((p0 , pi ), 0 ≤ i ≤ 23) between two models can be obtained. For instance, we can capture six silhouettes or depth buffers from the vertices of a unit regular octahedron and then extract 2D shape descriptors for these images to construct a view-based 3D feature vector. The vertices in the corresponding axes are also denoted as 0, 1, 2, 3, 4, and 5, respectively. Then we compare all 24 matching pairs for two models and the minimum distance is chosen as their dissimilarity.
p0
2 5
p1
p2
p3
0
1
4 3
{0,1,4,5,3,2}
{0,1,2,3,4,5} p4
{1,0,3,2,4,5}
{1,0,4,5,2,3} p8
{4,5,2,3,1,0}
{5,4,2,3,0,1}
{1,0,2,3,5,4}
{4,5,1,0,3,2}
p10
{4,5,3,2,0,1}
{5,4,0,1,3,2}
{4,5,0,1,2,3}
{5,4,3,2,1,0}
{2,3,4,5,0,1}
p15
{5,4,1,0,2,3} p18
{2,3,0,1,5,4} p21
{3,2,4,5,1,0}
p11
p14
p17
p20
p7
{1,0,5,4,3,2}
p13
p16
{2,3,1,0,4,5}
{0,1,5,4,2,3} p6
p9
p12
{3,2,0,1,4,5}
{0,1,3,2,5,4} p5
p19
{2,3,5,4,1,0} p22
{3,2,1,0,5,4}
p23
{3,2,5,4,0,1}
Fig. 6. All (24) possible poses of a chair after it has been incompletely aligned to the canonical coordinate frame. The corresponding permutations are listed underneath. The permutation pi , i = 0, 1, . . . , 23 denotes the positions of three major axes of the object in the context of pose i.
Generally speaking, Clock Matching performs in two steps:
the source model s is defined as,
1) Initialization. Recursively subdividing the original unit octahedron nd times, we get a geodesic sphere with the required resolution and the coordinates of its vertices should be recorded consecutively according to the time they emerge. During the process of subdivision, two tables (named edge table and vertex table, respectively) which indicate the relationship between old and new vertices are also obtained. An example of the edge table and the vertex table, utilized to store the information during the stage of subdividing the octahedron, are demonstrated in Figure 7. Note that we only need to process this step once. 2) Comparison.As mentioned above, when comparing two models represented by level-0 descriptors, we calculate the minimum distance among 24 matching pairs ((p0 , pi ), 0 ≤ i ≤ 23) which can be derived using the permutations shown in Figure 6. If higher-level shape descriptors are applied, we should use the edge table, vertex table, and pi , 0 ≤ i ≤ 23 to build new permutations 0 0 pi = {pi (k)|0 ≤ k < Nv }, 0 ≤ i ≤ 23 describing 0 0 all possible matching pairs (p0 , pi ), 0 ≤ i ≤ 23 for two models represented by Nv views. Finally, the dissimilarity between the query model q and
Disq,s = min
0≤i≤23
NX v −1
³ ´ 0 0 D F Vq (p0 (k)), F Vs (pi (k)) ,
k=0
where F Vm = {F Vm (k)|0 ≤ k < Nv } denotes the shape descriptor of 3D object m, F Vm (k) is the signature of view k, and D(·, ·) is the distance function. In Section 4.4, four metrics, denoted as DM axHis , DM inHis , DAvgHis , and DL1 , are defined and compared. By default, we utilize DM axHis to measure the dissimilarity between two views. 4. E XPERIMENTS In this section, we first present and discuss experimental results to study the influence of the number of views, codebook, training data, and distance function on retrieval performance for our CM-BOF algorithm. Then, 3D shape retrieval results are analyzed for the visual similarity based methods (CM-BOF and GSMD [9]) using local features and global features, respectively. Finally, we compare the retrieval accuracy of our methods with other approaches. We run the experiments on four publicly available 3D shape benchmarks briefly described as follows: 6
1 1
2
14
CM-BOF_258DB
16
2
0.9
CM-BOF_66DB CM-BOF_18DB
0.8
5
9
CM-BOF_6DB
0.7
1
0
6
10 0.6
0
7
3
Precision
4 13
8
0.5 0.4
11
0.3
4 15
Edge Vert Vert No. No1. No2. 0
2
1 2 3 4 5 6 7 8 9 10 11
4 0 5 0 0 4 5 1 1 1 1
2 4 2 5 3 3 3 2 4 5 3
EdgeTable
0.2 0.1
17
0
1 Vert No.
0
1
0
-1
-1
2
3
4
0
0.1
0.2
0.3
0.4
0.5 Recall
0.6
0.7
0.8
0.9
1
(a)-NSB
5
1 CM-BOF_258DB
6
11 8
10
0.9 0.8
1
-1
-1
14 17 15 16
2
6
14
-1
-1 7
3
11 17
-1
-1 12 13
4
8 15
7
12
-1
-1
5
10 16
9
13
-1
-1
CM-BOF_66DB CM-BOF_18DB CM-BOF_6DB
0.7
9
0.6 Precision
0
3
12
0.5 0.4 0.3
VertexTable
0.2 0.1
Fig. 7. The edge table and the vertex table generated when subdividing the original octahedron into the geodesic sphere with 18 vertices. The indexes of the vertices of the original edges are stored in the edge table. New vertices’ indexes can be obtained by using pairs of old vertices to search in the vertex table. A more intuitive illustration of the relations between the original vertices (green circles) and the new vertices (red pentagons) is given in the top-right of this figure.
0
0
0.1
0.2
0.3
0.4
0.5 Recall
0.6
0.7
0.8
0.9
1
(b)-PSB
Fig. 8. Influence of the number of views. (a) and (b) show the Precision-recall plots for the methods, with different numbers of views, run on the NSB and PSB databases, respectively.
PSB: The test set of the Princeton Shape Benchmark [1] contains 907 generic models which are classified into 92 categories. The maximum number of objects in a class is 50, while the minimum number is 4. • NSB: The NIST (National Institute of Standards and Technology) Shape Benchmark [4] is composed of 800 generic models which are classified into 40 categories. Each class contains 20 objects. • ESB: The Engineering Shape Benchmark [2] contains 867 CAD models which are classified into 45 categories. It has maximum 58 and minimum 4 objects in a class. • McGill: The McGill Shape Benchmark [3] consists of 255 articulated objects which are classified into 10 categories. The maximum number of objects in a class is 31, while the minimum number is 20. Since our methods are specifically designed for rigid models, most of our experiments (except the last one) are conducted only on the PSB and NSB databases. We implement the feature extraction in Matlab R2007, while the shape matching code is written in C++ of Microsoft Visual Studio 2005. All programs are run under windows XP on a personal computer with a 2.66GHz Intel Core2 Quad CPU, 4.0GB DDR2 memory, and a 128MB NVIDIA Quadro Fx550 graphics card. Note that: Unless otherwise specified, the default parameters of our CM-BOF method are selected as follows: the resolution of depth-buffer images is 256×256, •
the number of views Nv = 66, the size (i.e. the number of visual words) of the codebook Nw = 1500, the size (i.e. the number of local feature vectors) of the training set Nt ≈ 120000, the codebook is generated by clustering the training set, which is derived from the target database, using the Integer k-means method whose source code is available on the website [39].
4.1 Influence of the number of views In the first experiment, we investigate the influence of the number of views on retrieval performance. Figure 8 shows the precision-recall curves calculated for our CM-BOF methods using geodesic spheres with 6, 18, 66, and 258 vertices. It can be observed that retrieval performance can be improved by increasing the number of views, especially when the number of views jumps from 6 to 66. But the improvements slow down as the number of views keeps growing, while the computational cost still increases sharply. This is because an upper limit exists for the retrieval performance of viewbased methods, but more views involved always means that more time needs to be spent on calculating local descriptors and more memories are required to store the feature vectors. Consequently, in order to make the balance between quality and cost, the number of views is experimentally chosen as 66 in the following sections. 7
1 1
CM-BOF_66DB CM-BOF_66DB
0.9
DCG
0.9
0.8
0.8 0.7 0.6
0.7 DCG
BF-SIFT_66DB
BF-SIFT_66DB
0.5 0.6
0.5
2 x 10
5
(a) -NSB
0.5
1 CM-BOF_66DB BF-SIFT_66DB
0.9
DCG
0.4
0.3 0
1000
2000
3000
4000 5000 6000 Codebook size
7000
8000
9000
0.8 0.7
10000 0.6
(a)-NSB
0.5
1
0.5
CM-BOF_66DB BF-SIFT_66DB
0.9
1 1.5 Train data size
2 x 10
5
(b)-PSB
0.8
Fig. 10. Influence of the training data size. (a) and (b) show the DCG versus training data size curves for two methods (i.e. CM-BOF, BF-SIFT [11]) run on the NSB and PSB databases, respectively.
0.7 DCG
1 1.5 Train data size
0.6
0.5
clustering of the train data set which is composed of a large number of local descriptors randomly sampled from the database to be retrieved. The second method directly uses the randomly sampled feature vectors as the visual words in the codebook. Typically, the Bagof-Features method is implemented with clustering. The previous work [42] has also demonstrated that the first codebook construction method results in better performance in image classification against the second method. However, as we can see from Table 1, which presents the means and standard deviations of the DCG values over 10 runs of our CM-BOF algorithms with and without clustering. A conclusion can be made that the random sampling approach works as well as the clustering approach for our CM-BOF 3D shape retrieval algorithm when the codebook size has been properly chosen. We infer that this is mainly due to the carefullydesigned shape matching scheme and the fewer invalid information existing in the views captured from the 3D objects compared to the ordinary images used in other 2D applications.
0.4
0.3 0
1000
2000
3000
4000 5000 6000 Codebook size
7000
8000
9000
10000
(b)-PSB
Fig. 9. Influence of the codebook size. (a) and (b) show the DCG versus codebook size curves for two methods (i.e. CM-BOF and BFSIFT [11]) run on the NSB and PSB databases, respectively.
4.2 Influence of the codebook In the second experiment, we study the influence of the codebook size and creation methods by comparing retrieval performance among the shape descriptors corresponding to codebooks with different sizes and different construction methods. Codebook size. Probably, we can say that the most important parameter of the CM-BOF algorithm is the number of visual words (denoted as Nw ) in the codebook. This is because the codebook size not only determines the spatial requirement but also significantly affects the retrieval performance of the method. Figure 9 demonstrates results which report the Discounted Cumulative Gain (DCG, well-known as the most stable retrieval measure [41]) values for CM-BOF methods with steadily increased codebook size. We observe that, as the codebook size enlarges, DCG values go up sharply at the beginning and become stable approximately when Nw > 1000. Similar conclusions are obtained from Figure 9 for the BF-SIFT method presented in the paper [11], where only one word histogram is used to describe a 3D object. Here, both our CM-BOF and the BF-SIFT methods utilize 66 depth-buffer views. According to the experimental result, we set the number of visual words in the codebook as 1500 in this paper. Construction methods. Next, two codebook building methods are compared. The first one selects the centers of feature clusters to form the codebook, after the
TABLE 1 I NFLUENCE OF THE CODEBOOK CONSTRUCTION
METHOD . T HE TABLE GIVES THE MEANS AND STANDARD DEVIATIONS OF THE DCG VALUES OVER 10 RUNS OF OUR CM-BOF ALGORITHMS ON TWO BENCHMARKS , FOR CODEBOOKS GENERATED USING CLUSTERING (K- MEANS ), AND FOR RANDOMLY SAMPLED CODEBOOKS (R ANDOM )
NSB PSB
K-means 83.1± 0.1% 71.7± 0.2%
Random 83.1± 0.2% 71.7± 0.2%
4.3 Influence of the training data In the third experiment, we analyze the influence of the training data size and training source on retrieval performance. Training data size. Figure 10 shows the curves depicting the relation between DCG values and the 8
(a) -NSB
(b)-PSB
(a) -NSB
Fig. 11. Influence of the training data source on the retrieval results. (a) and (b) compare the DCG values of our CM-BOF methods, corresponding to four different training data sources, run on the NSB and PSB databases, respectively.
(b)-PSB
Fig. 12. Influence of the dissimilarity measure on retrieval results. (a) and (b) compare the DCG values of our CM-BOF methods, corresponding to four different distance functions, evaluated on two benchmarks. The metrics DM axHis , DM inHis , DAvgHis , and DL1 are denoted as Max, Min, Avg, and L1, respectively.
number of feature vectors in the training set. It can be seen that the size of the training data has very little impact on the retrieval performance. No matter how large or how small the training set is, the corresponding retrieval performance remains stable, even when the size of the training data is just a little bit larger than the codebook (e.g. Nw = 1500 and Nt = 1578). The experimental results provide an additional support to the aforementioned conclusion that clustering is not necessary for our method. Training data source. It is worthy of investigating whether it is necessary to create the training set by sampling the feature vectors in the database to be searched. In other words, we want to study the influence of the source database from which the local descriptors are randomly sampled to form the training set. Here, retrieval performance is evaluated on the NSB and PSB databases for the CM-BOF methods corresponding to four training sets generated from the PSB, NSB, ESB, and McGill databases, respectively. Figure 11 shows the results. Apparently, as we expected, the NSB training data gives the best result on the NSB database and the PSB training data gives the best result on the PSB database. Moveover, we also observe that better results could be obtained if more similar training data source, compared to the target database, is utilized.
1). Maximum dissimilarity histogram intersection distance. PNw −1 min(H1 (j), H2 (j)) j=0 DM axHis = 1 − . PNw −1 PNw −1 max( j=0 H1 (j), j=0 H2 (j)) 2). Minimum dissimilarity histogram intersection distance. PNw −1 min(H1 (j), H2 (j)) j=0 DM inHis = 1 − . PNw −1 PNw −1 min( j=0 H1 (j), j=0 H2 (j)) 3). Average dissimilarity histogram intersection distance. PNw −1 min(H1 (j), H2 (j)) j=0 . DAvgHis = 1 − PNw −1 PNw −1 ( j=0 H1 (j) + j=0 H2 (j))/2 4). Normalized L1 distance. ¯ ¯ NX w −1 ¯ ¯ H1 (j) H2 (j) ¯ ¯ DL1 = − PNw −1 ¯ PNw −1 ¯. ¯ H1 (j) H2 (j) ¯ j=0
j=0
j=0
As it can be seen from Figure 12, DM axHis outperforms other three metrics. 4.5 Comparison of local and global methods In this section, results of our fifth experiment are presented to discuss the advantages and disadvantages of two methods (CM-BOF and GSMD [9]), which utilize local and global features, respectively, to describe views. These two methods both capture 66 views and apply the same shape matching scheme, the only difference is that the local-based method (CM-BOF) uses a word histogram of local features to describe a view while the global-based method (GSMD [9]) represents the view by a global feature vector with 47 elements including 35 Zernike moments, 10 Fourier coefficients, eccentricity and compactness. The comparison is performed using the precision-recall curve on each class of the NSB database. Inspecting the comparison results shown in
4.4 Influence of the distance function In the forth experiment, we compare the performance of our methods, which use different metrics to calculate the distance between two views. Here we test four distance functions denoted as DM axHis , DM inHis , DAvgHis , and DL1 , respectively. Assume that view k is described by the word histogram Hk = {Hk (j)|j = 0, 1, . . . , Nw − 1}, given two histograms H1 , H2 , the distance between them can be calculated by the following four metrics, the first three of which are modified from the histogram intersection distance presented in [43]. 9
bed bed
car car
1
cabinet cabinet
1
biplane bioplane 1
1
Local
0.4
0.4 Local
0.2
0.2
0.2
0.4 0.6 Recall
0.8
0
1
Global
0
0.2
sword sword
0.4 0.6 Recall
0.4
0.8
0.4
0.2
sofa sofa
0.4 0.6 Recall
0.8
0.4
Global
0
0.2
0.4 0.6 Recall
0.8
0.8
0.8
1
0.8
1
Local
0.2
1
Global
0
0.2
0.4 0.6 Recall guitar guitar
1
0.8
0.6 0.4 0.2
0.4 0.6 Recall
1
0.6
0.4
0.8
0.6 0.4
Local Global
0.2
0.2
0.8
0.8
hand-gun hand -gun
Precision
Precision
0.4
0
0.4 0.6 Recall
1
1
0.8
0.6
0
0.2
Local
Global
0.8
0
glass glasses
0.6
0
1
1 Local
Global
Global
monitor monitor
1
0
1
0.2
0
Local
Local
0.6
0
1
0.8
1
0.2
0.4 0.6 Recall
0.4 0.6 Recall
0.8 Precision
Precision
0.6
0.2
0.2
0.4
ant ant
Global
0.8
0.8
0
0
Local
Global
Precision
0.2
1
1 Local
Precision
0.8
0.6
0.2
Global
missile missile
1
0.2
Local
0.4
Precision
0
0.6
Precision
0
0.8
0.8
0.6
Precision
Precision
Precision
0.8
0.6
Precision
Global
0.8
1
0
0.2
0.4 0.6 Recall
0.8
0
1
0
0.2
0.4 0.6 Recall
Local Global
0.4
0.2
0
0.6
0.8
1
0.2
0
0.2
0.4 0.6 Recall
Fig. 13. Precision-recall curves for specific object types on the NSB database. In this Figure, Local denotes the local feature based method (CM-BOF) while the global feature based method (GSMD) is denoted as Global.
Figure 13, we could classify them into the following three categories and suggest several possible reasons. Four examples of the first category are displayed in row 1, where the local-based method significantly outperforms the global-based method. 62.5% objects in the NSB database belong to this category. We speculate that, this is because, for these models in a same class, they have different global appearances but look similar when focusing on local regions, or their local descriptors provide more details than the global features. For instance, cabinet, telephone, and biplane, etc. can be better retrieved using the local-based method. Four examples of the second category are demonstrated in row 2, where the global-based method obtains much better results than the local-based one. Only 12.5% models belong to this category. Possible explanations are twofold, on the one hand, local salient features are extracted from unimportant but locally different subparts of these models (e.g. sword’s handle); on the other hand, overall appearances of these models (e.g. missile, glasses, and ant) in the same class are similar but not their local regions. The last row shows the third category, where the local-based and global-based methods get almost the same performance. 25.0% objects, such as sofa, monitor, hand gun, guitar and so on, belong to this category. To sum up, the local-based method (CM-BOF) is generally superior to the global-base method (GSMD) (the result comparisons for entire databases are shown in Figure 14), however, the global-base method may outperform the local-based method when searching for certain kinds of models. Furthermore, these two methods represent a depth-buffer view in quite different manners.
Therefore, to some extent, they are complementary and it is possible to create a more discriminative descriptor by using the combination of local feature and global feature to represent the depth-buffer views. 4.6 Comparison with the state-of-the-art In our last experiment, we compare the performance of our algorithms and other state-of-the-art methods. Figure 14 demonstrates the precision-recall curves on aforementioned four benchmarks for seven methods listed as follows, • D2: A method describing a 3D object as a histogram of distances between pairs of points on the surface [15]. The number of histogram bins is chosen as 64. • SHD: A method describing a 3D object as a feature vector consisting of spherical harmonic coefficients extracted from three spherical functions giving the maximal distance from center of mass as a function of spherical angle. See [16] [9] for details. • LFD: A well-known visual similarity based method proposed in [20]. See Section 2 for details. The length of the feature vector is 4700. • GSMD: See Section 4.5 for details. The number of viewpoints is selected as 66. • BF-SIFT: A method representing a 3D object as a word histogram by vector quantizing the visual salient SIFT descriptors [11]. Here, the depth-buffer views are capture on the vertices of a unit geodesic sphere. The number of views is selected as 66 and the length of the feature vector is 1500. 10
1
1 Hybrid
0.9
BF-SIFT
0.8
D2 Precision
0.4
0.3
0.3
0.2
0.2
0.1
0.1
0.1
0.2
0.3
0.4
0.5 Recall
0.6
0.7
0.8
0.9
SHD D2
0.5
0.4
0
GSMD LFD
0.6
0.5
0
BF-SIFT
0.7
SHD
0.6
CM-BOF
0.8
GSMD LFD
0.7
Precision
Hybrid 0.9
CM-BOF
0
1
0
0.1
0.2
0.3
(a) -NSB
0.4
0.5 Recall
0.6
0.7
0.8
0.9
1
0.6
0.7
0.8
0.9
1
(b)-PSB
1
1 Hybrid
0.9
CM-BOF
0.9
BF-SIFT 0.8
GSMD LFD
0.8
0.7
SHD
0.7 Precision
Precision
D2 0.6 0.5
0.6 0.5 Hybrid
0.4
0.4
0.3
0.3
0.2
0.2
CM-BOF BF-SIFT GSMD LFD SHD D2
0.1
0
0.1
0.2
0.3
0.4
0.5 Recall
0.6
0.7
0.8
0.9
0.1
1
(c)-ESB
0
0.1
0.2
0.3
0.4
0.5 Recall
(d)-McGill
Fig. 14. Precision-recall curves of seven methods run on the four benchmarks. (a), (b), (c), and (d) shows the results evaluated on the NSB, PSB, ESB, and McGill databases, respectively.
CM-BOF: See Section 3 for details. The default settings are chosen here and thus the average length of the feature vector is 3320. • Hybrid (CM-BOF+GSMD): A composite method based on a linear combination of CM-BOF and GSMD. More specifically, in this method, a view is expressed by a feature vector consisting of two different kinds of shape descriptors, which are used in CM-BOF and GSMD, with pre-specified weights. We experimentally select the weights as Wlocal = 7.0 and Wglobal = 1.0 for local and global features, respectively, by maximizing the retrieval accuracy on the PSB train set with base classification. The shape matching scheme and other parameters are exactly the same as the CMBOF algorithm described above. Several observations can be made from Figure 14. For the PSB and NSB databases which consist of generic models, the Hybrid method clearly outperforms other six methods, among which CM-BOF and BF-SIFT take the second place and the third place, respectively. For the ESB database which contains only CAD objects, although the Hybrid method still performs the best, BFSIFT obtains slightly better result than CM-BOF. For the McGill database which is composed of articulated models, three methods associated with local features markedly outperforms the methods only using global features. Despite applying pose normalization, CM-BOF
is still superior to all other methods, probably because of the salient local feature’s robustness against the small changes of viewpoints. The Hybrid method merely takes the third place mainly due to the poor performance of the global descriptor it combines. We also compare our Hybrid (CM-BOF+GSMD) method and CM-BOF method with the state-of-theart approaches including PANORAMA [26], MDLADPD [8], GSMD+SHD+R [9], DESIRE [21], and LFD [20] on the PSB test set with base classification. As shown in Table 2, our Hybrid method significantly outperforms other methods compared here, while the CM-BOF algorithm, whose feature vector is only of dimension 3320 on average, also obtains superior or comparable 3D shape retrieval performance. Moreover, for our CM-BOF method, comparing a pair of 3D objects takes less than 1.0 millisecond and, with the GPU-based implementation [44], the feature extraction of an object can be finished within 5.0 seconds.
•
5. C ONCLUSION In this paper, we presented a novel visual similarity based 3D shape retrieval method using Bag-of-Features. The key idea is to describe a view as a word histogram, which is obtained by the vector quantization of the view’s salient local features, and apply a multi-view shape matching to calculate the dissimilarity between 11
TABLE 2 C OMPARING RETRIEVAL RESULTS OF OUR METHODS ( FIRST TWO ROWS ) WITH OTHER STATE - OF - THE - ART APPROACHES ON THE PSB TEST SET WITH BASE CLASSIFICATION . CM-BOF+GSMD CM-BOF PANORAMA GSMD+SHD+R MDLA-DPD DESIRE LFD
1-NN 75.4% 73.1% 75.3% 73.1% 68.8% 66.5% 65.7%
1-Tier 50.9% 47.0% 47.9% 47.2% 43.6% 40.3% 38.0%
2-Tier 64.0% 59.8% 60.3% 60.2% 54.2% 51.2% 48.7%
[17] H. Laga, H. Takahashi, and M. Nakajima, “Spherical wavelet descriptors for content-based 3D model retrieval,” in Proc. SMI’06, 2006, pp. 15–15. [18] H. Sundar, D. Silver, N. Gavani, and S. Dickinson, “Skeleton based shape matching and retrieval,” in Proc. SMI’03, 2003, pp. 130–139. [19] D. Bespalov, W. Regli, and A. Shokoufandeh, “Reeb graph based shape retrieval for cad,” in Proc. ASME design engineering technical conferences, computers and information in engineering conference, 2003. [20] D.-Y. Chen, X.-P. Tian, Y.-T. Shen, and M. Ouhyoung, “On visual similarity based 3D model retrieval,” in Proc. Eurographics 2003, vol. 22, no. 3, 2003, pp. 223–232. [21] D. V. Vrani´c, “DESIRE: a composite 3D-shape descriptor,” in Proc. ICME’05, 2005. [22] G. Passalis, T. Theoharis, and I. A. Kakadiaris, “PTK: A novel depth buffer-based shape descriptor for three-dimensional object retrieval,” The Visual Computer, vol. 23, no. 1, pp. 5–14, 2007. [23] J. Shih, C. Hsing, and J. Wang, “A new 3D model retrieval approach based on the elevation descriptor,” Pattern Recognition, vol. 40, no. 1, pp. 283–295, 2007. [24] J. Pu, K. Lou, and K. Ramani, “A 2D sketch-based user interface for 3D CAD model retrieval,” Computer-Aided Design & Applications, vol. 2, no. 6, pp. 717–725, 2005. [25] M. Chaouch and A. Verroust-Blondet, “Enhanced 2D/3D approaches based on relevance index for 3D-shape retrieval,” in Proc. SMI’06, 2006, pp. 36–36. [26] P. Papadakis, I. Pratikakis, T. Theoharis, and S. Perantonis, “PANORAMA: A 3D shape descriptor based on panoramic views for unsupervised 3d object retrieval,” IJCV (in press). [27] H. Jegou, M. Douze, and C. Schmid, “Improving bag-of-features for large scale image search,” IJCV (in press). [28] L. Fei-Fei and P. Perona, “A bayesian hierarchical model for learning natural scene categories,” in Proc. CVPR’05, 2005, pp. 524–531. [29] J. Sivic and A. Zisserman, “Video google: A text retrieval approach to object matching in videos,” in Proc. ICCV’03, 2003, pp. 1470–1477. [30] A. E. Johnson and M. Hebert, “Using spin images for efficient object recognition in cluttered 3d scenes,” IEEE Trans. PAMI, vol. 21, no. 5, pp. 433–449, 1999. [31] A. Frome, D. Huber, R. Kolluri, T. Bulow, and J. Malik, “Recognizing objects in range data using regional point descriptors,” in Proc. ECCV’04, 2004. [32] T. R. Lo and J. P. Siebert, “Local feature extraction and matching on range images: 2.5D SIFT,” Computer Vision and Image Understanding, vol. 113, no. 12, pp. 1235–1250, 2009. [33] T. Funkhouser and P. Shilane, “Partial matching of 3D shapes with priority-driven search,” in Proc. SGP’06, pp. 131–142. [34] R. Gal and D. Cohen-Or, “Salient geometric features for partial shape matching and similarity,” ACM Transactions on Graphics, vol. 25, no. 1, pp. 130–150, 2006. [35] A. Tal and E. Zuckerberger, “Mesh retrieval by components,” Advanced in Computer Graphics and Computer Vision, pp. 44– 57, 2007. [36] Y. Liu, H. Zha, and H. Qin, “Shape topics: A compact representation and new algorithms for 3D partial shape retrieval,” in Proc. CVPR’06, 2006, pp. 2025–2032. [37] X. Li, A. Godill, and A. Wagan, “Spatially enhanced bags of words for 3D shape retrieval,” in Proc. ISVC’08, pp. 349–358. [38] R. Toldo, U. Castellani, and A. Fusiello, “Visual vocabulary signature for 3D object retrieval and partial matching,” in Proc. 3DOR’08, 2009, pp. 21–28. [39] A. Vedaldi and B. Fulkerson, “VLFeat: An open and portable library of computer vision algorithms,” http://www.vlfeat.org/. [40] T. Furuya and R. Ohbuchi, “Dense sampling and fast encoding for 3D model retrieval using bag-of-visual features,” in Proc. CIVR’09 (in press), 2009. [41] P. Shilane and T. Funkhouser, “Distinctive regions of 3d surfaces,” ACM Transactions on Graphics, vol. 26, no. 2, 2007. [42] E. Nowak, F. Jurie, and B. Triggs, “Sampling strategies for bagof-features image classification,” in Proc. ECCV’06, 2006, pp. 490–503. [43] M. J. Swain and D. H. Ballard, “Color indexing,” IJCV, vol. 7, no. 1, pp. 11–32, 1991. [44] C. Wu, “SiftGPU: A GPU Implementation of David Lowe’s SIFT,” http://cs.unc.edu/ ccwu/siftgpu/.
DCG 74.6% 72.0% 72.1% 67.8% 66.3% 64.3%
two objects. A set of experiments were carried out to investigate several critical issues of our CM-BOF method, including the impact of the number of views, codebook, training data, and distance function on the performance of 3D shape retrieval. It can be seen that clustering is not necessary for the method, and our local feature based method is somehow complementary with respect to the global feature based method (GSMD [9]). The experimental results also demonstrated that our methods (the composite method and the CM-BOF algorithm) are superior or comparable to the state-of-the-art. R EFERENCES [1] P. Shilane, P. Min, M. Kazhdan, and T. Funkhouser, “The princeton shape benchmark,” in Proc. SMI’04, 2004, pp. 167– 178. [2] S. Jayanti, Y. Kalyanaraman, N. Iyer, and K. Ramani, “Developing an engineering shape benchmark for CAD models,” Computer-Aided Design, vol. 38, no. 9, pp. 939–953, 2006. [3] J. Zhang, R. Kaplow, R. Chen, and K. Siddiqi, “The mcgill shape benchmark,” http://www.cim.mcgill.ca/ shape/benchMark/, 2005. [4] R. Fang, A. Godill, X. Li, and A. Wagan, “A new shape benchmark for 3D object retrieval,” in Proc. ISVC’08, 2008, pp. 381–392. [5] Aim@Shape, “SHape REtrieval Contest (SHREC),” http://www.aimatshape.net/event/SHREC/. [6] M. R. Ruggeri, G. patane, M. Spagnuolo, and D. Saupe, “Spectral-driven isometry-invariant matching of 3D shapes,” IJCV (in press). [7] P. Daras and A. Axenopoulos, “A 3D shape retrieval framework supporting multimodal queries,” IJCV (in press). [8] M. Chaouch and A. Verroust-Blondet, “A new descriptor for 2D depth image indexing and 3D model retrieval,” in Proc. ICIP’07, vol. 6, 2007, pp. 373–376. [9] Z. Lian, P. L. Rosin, and X. Sun, “Rectilinearity of 3D meshes,” International Journal of Computer Vision (in press). [10] K. Mikolajczyk and C. Schmid, “A performance evaluation of local descriptors,” IEEE Trans. PAMI, vol. 27, no. 10, pp. 1615– 1630, 2005. [11] R. Ohbuchi, K. Osada, T. Furuya, and T. Banno, “Salient local visual features for shape-based 3D model retrieval,” in Proc. SMI’08, 2008, pp. 93–102. [12] D. G. Lowe, “Distinctive image features from scale-invariant keypoints,” IJCV, vol. 60, no. 2, pp. 91–110, 2004. [13] J. W. Tangelder and R. C. Veltkamp, “A survey of content based 3D shape retrieval methods,” Multimedia Tools and Applications, vol. 39, no. 3, pp. 441–471, 2008. [14] M. Ankerst, G. Kastenmuller, H. Kriegel, and T. Seidl, “Nearest neighbor classification in 3D protein databases,” in Proc. the Seventh International Conference on Intelligent Systems for Molecular Biology, 1999, pp. 34–43. [15] R. Osada, T. Funkhouser, B. Chazelle, and D. Dobkin, “Shape distributions,” ACM Transactions on Graphics, vol. 21, no. 4, pp. 807–832, 2002. [16] M. Kazhdan, T. Funkhouser, and S. Rusinkiewicz, “Rotation invariant spherical harmonic representation of 3D shape descriptors,” in Proc. SGP’03, vol. 43, 2003, pp. 156–164.
12