Trajectory Smoothing and Transition Management for a Small Autonomous Helicopter
Andres Y. Agudelo-Toro
UNIVERSIDAD EAFIT ESCUELA DE CIENCIAS Y HUMANIDADES ´ DEPARTAMENTO DE CIENCIAS BASICAS MASTER PROGRAM IN APPLIED MATHEMATICS MEDELL´IN June 5, 2008
Trajectory Smoothing and Transition Management for a Small Autonomous Helicopter
Andres Y. Agudelo-Toro
Submitted to the Department of Basic Sciences in partial fulfillment of the requirements for the degree of Master of Science in Applied Mathematics
Advisor Carlos M. V´elez S´anchez Dr. in Physical Sciences Associate Professor
UNIVERSIDAD EAFIT ESCUELA DE CIENCIAS Y HUMANIDADES ´ DEPARTAMENTO DE CIENCIAS BASICAS MASTER PROGRAM IN APPLIED MATHEMATICS MEDELL´IN June 5, 2008
Acceptation Note
Master Degree Coordinator
Project Director
Medell´ın, June 5, 2008
Abstract Guidance of an autonomous helicopter requires transforming a predefined flight schedule, described as a series of discrete points, in a continuous smooth trajectory. A smooth flight schedule reduces the control system effort and decreases transients originated by direction and flight mode changes. Differently from airplanes, helicopter flight cannot be described only by position changes but also special flight mode changes (e.g. takeoff to hover). Reduced transients and control effort are dependent on the continuity of the planned three dimensional path, smooth velocity transitions and adequate management of mode transitions. This thesis is centered in the mathematical definition and experimental test of a hybrid control system based on spline functions and a finite state machine (FSM) for an autonomous small helicopter. The main goal of this work is to describe the system that transforms a flight mission, declared as a series of discrete points and actions, in a smooth trajectory that reduces transition effects and restrains vehicle operation to a predefined time and velocity envelope. The proposed methods are validated in simulation with the dynamic model of a hobby helicopter. In order to reduce direction and mode transients, the helicopter flight plan is transformed into a smooth trajectory. This trajectory is rendered in flight by the FSM, that is able to infer flight mode changes and in general, to direct the autonomous flight. The smoothing process requires transforming a fifth dimensional plan schedule of position, velocity and time to a structure of state descriptor functions and properties. Rendering the trajectory requires the FSM discrete event manager to translate this structure in continuous sampled set points, guiding the vehicle position, velocity and orientation. To test effectiveness of the overall system various trajectories are assigned to the system and multidimensional error comparisons across length, shape and velocity are made. Non smoothed versions of the trajectory are compared with smoothed positions and progressive velocity schedules to determine the benefits of the approach. Overall, experimentation shows a major advantage on using the proposed smoothing methods. Control error, and particularly attitude control error is reduced on the smoothed trajectories. Velocity linear transitions produce the lower errors in simulation. It is concluded that the smoothing methods proposed alleviate transients, reducing control error and control effort in simulation with the vehicle model.
Acknowledgements I would like to thank all the members of my family for their constant support during my life and studies. I would also like to thank my thesis supervisor Carlos M. V´elez S. for his help and advice during my postgraduate studies and the development of this thesis. I thank EAFIT University, the Basic Sciences Department and the Applied Mathematics Master’s program, program coordinator and professors for providing important tools I required during this work. This work was supported by EAFIT University and Colciencias Young Researcher Award proposal number p-2006-0716.
10
Contents 1 Introduction 1.1 Introduction . . . . . . . . . . . . . . . . . . . . . 1.2 Research Contribution and Methodology . . . . . 1.3 Thesis Outline . . . . . . . . . . . . . . . . . . . . 1.4 The Small Helicopter Dynamic Model . . . . . . . 1.4.1 State Variables and Parameters Definition 1.4.2 Equations of Motion . . . . . . . . . . . . 1.4.3 Equations of Force and Moments . . . . . 1.5 Control Strategy . . . . . . . . . . . . . . . . . . 1.5.1 Hybrid Systems . . . . . . . . . . . . . . . 1.5.2 Control System Architecture . . . . . . . . 1.6 Related Work . . . . . . . . . . . . . . . . . . . .
. . . . . . . . . . .
. . . . . . . . . . .
. . . . . . . . . . .
. . . . . . . . . . .
. . . . . . . . . . .
2 Method 2.1 Notation . . . . . . . . . . . . . . . . . . . . . . . . . . . . 2.2 Trajectory Smoothing . . . . . . . . . . . . . . . . . . . . 2.2.1 Spline Trajectory Functions . . . . . . . . . . . . . 2.2.2 Velocity Smoothing . . . . . . . . . . . . . . . . . . 2.2.3 Trajectory Properties . . . . . . . . . . . . . . . . . 2.2.4 The Smoothing Algorithm . . . . . . . . . . . . . . 2.2.5 Gain Scheduling . . . . . . . . . . . . . . . . . . . . 2.3 The Finite State Machine . . . . . . . . . . . . . . . . . . 2.3.1 Off, Ground and Runup states . . . . . . . . . . . . 2.3.2 Takeoff state . . . . . . . . . . . . . . . . . . . . . 2.3.3 Hover state . . . . . . . . . . . . . . . . . . . . . . 2.3.4 Waypoint follow state . . . . . . . . . . . . . . . . 2.3.5 Pilot assist, Waypoint land, Descent and End states 3 Results 3.1 Experimental Results . . . . . . . . . . . . . . . . . . 3.1.1 Linear Trajectory and Baseline Error . . . . . 3.1.2 Rectangular and Circular Trajectories . . . . . 3.1.3 Real World Trajectories and Time Estimation 3.1.4 Gain Scheduler Effects . . . . . . . . . . . . . 11
. . . . .
. . . . .
. . . . .
. . . . . . . . . . .
. . . . . . . . . . . . .
. . . . .
. . . . . . . . . . .
. . . . . . . . . . . . .
. . . . .
. . . . . . . . . . .
. . . . . . . . . . . . .
. . . . .
. . . . . . . . . . .
. . . . . . . . . . . . .
. . . . .
. . . . . . . . . . .
. . . . . . . . . . . . .
. . . . .
. . . . . . . . . . .
. . . . . . . . . . . . .
. . . . .
. . . . . . . . . . .
17 17 18 20 20 22 23 25 29 29 31 32
. . . . . . . . . . . . .
35 35 37 37 41 42 48 49 49 54 56 58 58 59
. . . . .
61 61 63 66 70 74
12
CONTENTS 3.2 3.3 3.4
Real-Time Execution Tests . . . . . . . . . . . . . . . . . . . . . . . . . The Mission Planner . . . . . . . . . . . . . . . . . . . . . . . . . . . . Conclusions and Future Work . . . . . . . . . . . . . . . . . . . . . . .
74 78 78
4 References
83
A Source Code A.1 Matlab Trajectory Smoothing . . . . . . . . . . . . . . . . A.2 Matlab Multidimensional Catmull-Rom Polynomial . . . . A.3 Matlab Two Dimensional Catmull-Rom Polynomial Length A.4 Matlab Smooth Velocity Time Calculation . . . . . . . . .
87 87 90 91 91
. . . .
. . . .
. . . .
. . . .
. . . .
. . . .
. . . .
List of Figures 1.1 1.2 1.3 1.4
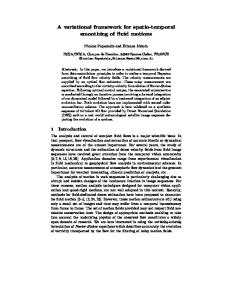
Model implementation displaying main subsystems in Simulink. Basic helicopter vocabulary and components. . . . . . . . . . . . Helicopter body axes and forces. . . . . . . . . . . . . . . . . . . Control system architecture. . . . . . . . . . . . . . . . . . . . .
. . . .
. . . .
. . . .
. . . .
21 21 22 32
Waypoint and trajectory notation. . . . . . . . . . . . . . . . . . . . . . Cardinal spline notation. . . . . . . . . . . . . . . . . . . . . . . . . . . A velocity change example. . . . . . . . . . . . . . . . . . . . . . . . . . Smoothed velocity example. . . . . . . . . . . . . . . . . . . . . . . . . An equally divided distance L covered at variable speed vi . . . . . . . . Efficient Hermite interpolation method implemented for the gain scheduler on Simulink. . . . . . . . . . . . . . . . . . . . . . . . . . . . . . . 2.7 Implementation of the Hermite Interpolation block in the Efficient Hermite interpolation method for the gain scheduler on Simulink. . . . . . 2.8 Finite State Machine implementation. . . . . . . . . . . . . . . . . . . . 2.9 Finite state automaton complete inputs and outputs. . . . . . . . . . . 2.10 Implementation of the Takeoff maneuver on Stateflow. . . . . . . . . . 2.11 Implementation of the Waypoint follow main trajectory production algorithm in Stateflow. . . . . . . . . . . . . . . . . . . . . . . . . . . . .
36 40 42 43 47
2.1 2.2 2.3 2.4 2.5 2.6
3.1 3.2 3.3 3.4
3.5 3.6
3.7
System response to a non smooth vs. a smooth velocity transition in meters per second. . . . . . . . . . . . . . . . . . . . . . . . . . . . . . An 85 meters linear trajectory to determine baseline error. . . . . . . . Ramp-like velocity transition in meters per second. . . . . . . . . . . . Linear trajectory average error Ex on different smoothness configurations (nn,nr,sn,sr,ss) and velocities (1,3,5 m/s) for position (x, y, x), attitude (φ, θ, ψ) and velocity (vx , vy , vz ) . . . . . . . . . . . . . . . . . . . . . . Linear trajectory control output standard deviation (σ) and absolute maximum values for each vehicle input (δcol , δlon , δlat , δped ). . . . . . . . Rectangular trajectory average error Ex on different smoothness configurations (nn,nr,sn,sr,ss) and lengths (10x10,30x30,50x50 m) for position (x, y, x), attitude (φ, θ, ψ) and velocity (vx , vy , vz ) . . . . . . . . . . . . Rectangular trajectory smoothed. Axis are in meters. . . . . . . . . . . 13
50 51 52 54 57 59 62 62 63
64 65
66 67
14
LIST OF FIGURES 3.8 3.9 3.10 3.11 3.12 3.13
3.14 3.15 3.16 3.17
3.18 3.19
3.20 3.21 3.22 3.23 3.24 3.25 3.26 3.27 3.28 3.29
Rectangular trajectory control standard deviation (σ) and absolute maximum values for each vehicle input (δcol , δlon , δlat , δped ). . . . . . . . . . . 10 meters circular trajectory on the non smooth and smooth cases. . . 30 meters circular trajectory section on the non smooth and smooth cases. 50 meters circular trajectory on the non smooth and smooth cases. . . 50 meters circular trajectory schedule for the ramp-like (sr) and smooth velocity (ss) cases. . . . . . . . . . . . . . . . . . . . . . . . . . . . . . Circular trajectory average error Ex on different smoothness configurations (nn,nr,sn,sr,ss) and radii (10, 30, 50 m) for position (x, y, x), attitude (φ, θ, ψ) and velocity (vx , vy , vz ) . . . . . . . . . . . . . . . . . Circular trajectory control standard deviation (σ) and absolute maximum values for each vehicle input (δcol , δlon , δlat , δped ). . . . . . . . . . . A simple trajectory at low speed and no major velocity changes. Axis are in meters. . . . . . . . . . . . . . . . . . . . . . . . . . . . . . . . . A complex trajectory with hover points (∗). Axis are in meters. . . . . A simple trajectory average error Ex on different smoothness configurations (nn,nr,sn,sr,ss) for position (x, y, x), attitude (φ, θ, ψ) and velocity (vx , vy , vz ) . . . . . . . . . . . . . . . . . . . . . . . . . . . . . . . . . . Simple trajectory control standard deviation (σ) and absolute maximum for each vehicle input in various smoothness configurations. . . . . . . . A complex trajectory average error Ex on different smoothness configurations (nn,nr,sn,sr,ss) for position (x, y, x), attitude (φ, θ, ψ) and velocity (vx , vy , vz ) . . . . . . . . . . . . . . . . . . . . . . . . . . . . . . . . . . Complex trajectory control standard deviation (σ) and absolute maximum for each vehicle input in various smoothness configurations. . . . Expected time compared to average time on the simple and complex trajectories. . . . . . . . . . . . . . . . . . . . . . . . . . . . . . . . . . Lateral control Ti scheduled gain. . . . . . . . . . . . . . . . . . . . . . Gain scheduler test with a random trajectory. (∗) are hover waypoints, (#) are 1 m/s waypoints. . . . . . . . . . . . . . . . . . . . . . . . . . . Gain scheduler average error Ex results for the trajectory of Figure 3.23. Gain Scheduler test with a random trajectory. . . . . . . . . . . . . . . CPU usage of the FSM, Control System and Kalman Filter generating a trajectory on the flight computer. The QNX command hogs -n was used. The Mission Planner user interface. . . . . . . . . . . . . . . . . . . . . The Mission Planner displaying a time exceeded alert. . . . . . . . . . . Actual smooth velocity schedule compared to the ideal velocity schedule shape. . . . . . . . . . . . . . . . . . . . . . . . . . . . . . . . . . . . .
67 68 68 69 69
71 72 72 73
73 74
75 76 76 76 77 77 78 79 79 80 81
List of Tables 2.1 2.2 2.3 2.4
Trajectory notation. . . . . . . . . . . . . . . . . . . . . . . . . . . . . 8-point values for u and weights w for the Gauss-Legendre integration method . . . . . . . . . . . . . . . . . . . . . . . . . . . . . . . . . . . Length numerical results for a 6 waypoints trajectory. . . . . . . . . . . Length numerical results for a 360 waypoints trajectory. . . . . . . . .
15
38 45 46 47
16
LIST OF TABLES
Chapter 1 Introduction 1.1
Introduction
Guidance of an autonomous helicopter requires transforming a predefined flight schedule, described as a series of discrete point locations and maneuvers, in a continuous smooth three dimensional trajectory. A smooth flight schedule reduces the control system effort and decreases transients caused by changing directions and flight modes. Finding a smooth trajectory that covers the flight objectives is not problematic in human guided flight, as the pilot naturally directs the helicopter from one point to another in a continuous way. In the case of an autonomous helicopter however, the guidance system is required to produce an optimized trajectory that meets the flight itinerary. The importance of a smooth trajectory to avoid sudden direction and flight mode changes for autonomous helicopters has been identified in simulation and the literature (Sanders, DeBitetto, Feron, Vuong, & Leveson, 1998; Guler, Clements, Wills, Heck, & Vachtsevanos, 2001; Harbick, Montgomery, & Sukhatme, 2004; Geyer & Johnson, 2006). Importantly, and differently from vehicles such as airplanes, helicopter flight cannot be described only by three dimensional position changes but also special flight mode changes (e.g. a hover maneuver requires special considerations for the vehicle attitude and hover time.) Besides describing its position, the regular flight schedule of a helicopter is conformed by sequences of maneuvers that should be seamlessly executed to reach any desired location. A successful autonomous helicopter system should change from one maneuver to another in a coordinated way. Reduced transients and control effort depend on the continuity of the planned three dimensional path, velocity transitions and adequate management of mode transfers. Accomplishing a successful flight can then be divided in two basic operations: generating and following a smooth trajectory and maintaining control during mode changes. Generation of a smooth trajectory to avoid too rapid position, velocity and attitude changes can be done before flight and an n-dimensional regression method such as spline functions can be used. Spline functions (Bartels, Beatty, & Barsky, 1987; Weisstein, 2002) can produce series of continuous at the joints curves that meet discrete position criteria. Velocity transitions can also be produced with regression methods creating progressive changes and meeting additional time and acceleration constrains. 17
18
CHAPTER 1. INTRODUCTION
Maintaining control during mode changes is governed by trajectory and control system transfers. A small hobby helicopter and in general any helicopter is a non linear dynamic system (Gavrilets, 2003; Mettler, 2003), so single control systems may not be effective for every flight mode (Koo, Hoffmann, Shim, Sinopoli, & Sastry, 1999; Guler et al., 2001). A mode change manager for this type of system requires the characteristics of a hybrid control system to combine discrete asynchronous event logic with continuous time sampled dynamics (Brockett, 1993; Branicky, Borkar, & Mitter, 1998). This type of system can be described through a formalism such as the Discrete Event Systems theory of (Zeigler, Praehofer, & Kim, 2000) that combines event based finite state machines (FSM) with continuous dynamics. In summary, to achieve a stable flight, a combination of smoothing methods and event based handling mechanisms is required. This thesis is centered on the mathematical definition and experimental testing of a hybrid control system based on spline functions and a finite state machine for an autonomous small helicopter (Velez & Agudelo, 2005; Velez, Agudelo, & Alvarez, 2006). The main goal of this work is to describe the system that transforms a flight mission, declared as a series of points and actions, in a smooth trajectory that reduces transition effects and restrains vehicle operation to a predefined time and velocity envelope. The proposed methods will be validated in simulation with the dynamic model of a small helicopter and will also be tested on a real flight computer to verify it meets computational constrains. The trajectory smoothing algorithm and FSM will be defined and implemented on a rapid prototyping platform for further reference. Although the dynamical model of the helicopter will be presented, there will be less attention to modeling, controller design and state estimation as they are separated problems in the design of the autonomous system. As the proposed method is applied, results are expected to show benefits from the use of the smooth trajectory, FSM and the hybrid control strategy. Experimental results will be presented to support this assertion.
1.2
Research Contribution and Methodology
Mathematical definitions and tools from digital control systems theory, numerical and recursive methods, computational analysis, kinematics and logic will be used to describe the proposed methods. The main consequence of this study will be substantial advance in the study of hybrid control systems with smooth transition management for small autonomous helicopters and obtention of numerical results to support it. In particular, results will be an important contribution to the Colibri project (Velez & Agudelo, 2005; Velez et al., 2006) as this system integrates already existing components such as Proportional-Integral-Derivative (PID) controllers and a Kalman filter, in a single system able to plan and direct flight. The study of methods for hybrid control is important to various fields of research, especially robotics, because it deals with several types of signals, both continuous and discrete. The general field of control systems is profited from the study of hybrid control methods as it represents a recent and expanding field that deals with the increasing diversity of the systems to be controlled. Many of the hybrid control strategies proposed
1.2. RESEARCH CONTRIBUTION AND METHODOLOGY
19
in the literature are stated in theory but not taken to real applications. The construction of the control system for a robotic helicopter is not a trivial task, and represents a source of interesting results for applied mathematical methods. The aeronautics field benefits from this type of study, as it represents a novel aerospace engineering problem and a practical solution. The subject of Unmanned Air Vehicles (UAVs) is of large interest to several institutions due to its importance for the future of commercial and military aviation. UAVs can largely reduce costs and human risk. An additional interesting theoretical study related to position and velocity smoothing is presented. While it is relatively simple to smooth position and velocity independently, it is not that simple to smooth a 2D position and velocity simultaneously with time based functions. If the two-dimensional position of a particle is described by hx, yi = f (t) its velocity is implicitly declared by f 0 (t), so if f (t) was designed to traverse a set of points it is harder at the same time to make it reach expected velocities at these points. A mathematical contribution of this thesis will be to implement a numerical method that optimizes position and velocity at the same time meeting a set of position and velocity constrains. The proposed trajectory optimization method is mostly two-dimensional and considers altitude changes only during the takeoff sequence. Some of the methods here proposed can be easily extended to three-dimensional space but still full 3D flight, such as the one in acrobatic maneuvers, requires a more detailed study of attitude changes, and is beyond the purpose of this thesis. Results and developments of this work will be restricted to simulation and experiments in real flight are not expected as real flight deals with control and state estimation effectiveness rather than trajectory generation. Development will be centered on software implementation techniques and component based design. Incremental result comparing non smooth versus smooth trajectories will be used to measure the real benefits of the approach. The research question to be answered is: “Is it possible to reduce the difference between a planed flight route and the real route of a small autonomous helicopter minimizing transients and control effort, with a finite state machine and a spline optimized trajectory?”. The research question directly leads to the research hypothesis: “A hybrid control system based on a FSM with transition management and trajectory smoothing with splines reduces the position, velocity and attitude error in the flight of an autonomous helicopter.” Formally the error can be defined as follows. Let the helicopter estimated state vector sampled in the k-th instant be x ˆ(k) and let xf sm (k) be the expected state determined by the smooth trajectory and FSM. The state error at moment k is the difference, ex (k) = |ˆ x (k) − xf sm (k)| .
(1.1)
The entire trajectory average error will be defined as, Ex =
m X ex (k) k=1
m
(1.2)
With m the total number of samples in simulation. The final goal of this work will
20
CHAPTER 1. INTRODUCTION
be to reduce Ex .
1.3
Thesis Outline
The main objective of the thesis is to measure the benefits of using a smooth trajectory and FSM to reduce transition effects in the controlled flight of a small autonomous helicopter. Specifically, this requires first to define the system to control, and then mathematically define the position and velocity smoothing methods which transform a finite set of two dimensional points into a smooth trajectory. Once this is defined, the finite state machine to process the smoothed trajectory and handle mode changes is described. The FSM will handle transitions between three specific flight modes: Takeoff, Hover and Forward flight and will be implemented with the Stateflow toolbox (Mathworks, 2006d) of the Matlab platform (Mathworks, 2006a). To test this in simulation, each of the components will be integrated in a single simulation program, including the helicopter model and control system. To determine the true benefits of the approach, the difference between the planned and actual route in simulation will be measured in various types of conditions. The remaining sections of this chapter will describe the helicopter simulation model and the control strategy to be used. In the second chapter the soothing algorithms are presented and some of its properties are explored. The finite state machine is formally defined then, and the trajectory following algorithm is explored. In the third chapter the benefits of the hybrid control system are measured and additional results related to implementation details are reported, followed by conclusions and proposed future work.
1.4
The Small Helicopter Dynamic Model
Trajectory optimization and transition management methods presented in this work will be tested on the Colibri simulation environment. The Colibri simulation environment core component is the dynamic model of an X-Cell Gas Graphite remote controlled miniature helicopter with a 155 cm rotor. (Miniature Aircraft USA, 1999). The dynamic model (Velez & Agudelo, 2005, 2006; Velez, 2007) is an improved implementation of the X-Cell model, first designed and validated in real flights by (Gavrilets, 2003; Mettler, 2003). This model was developed in Simulink and has been validated in human-in-the-loop simulation tests (Figure 1.1). This section presents a summarized description of the model, identifying some of its basic equations and non-linearities. Figure 1.2 presents the main vocabulary and helicopter components useful for the remaining of the section. Helicopter flight is governed by four basic forces: lift, drag, thrust and weight. Lift and drag rely on fuselage and blade shapes and interact mainly with external wind conditions and flow produced by the main and tail rotors. Thrust and weight counteract to maintain the helicopter in flight but are also related to aerodynamic interactions of the helicopter blades and body. The helicopter dynamic model tries to emulate
1.4. THE SMALL HELICOPTER DYNAMIC MODEL
Figure 1.1: Model implementation displaying main subsystems in Simulink.
Figure 1.2: Basic helicopter vocabulary and components.
21
22
CHAPTER 1. INTRODUCTION
Figure 1.3: Helicopter body axes and forces. this relationships between forces and to predict the vehicle behavior provided a set of inputs. There are five basic controllable inputs to any helicopter and in consequence the model. The first is the collective setting which increases or decreases the main blades angle and alter together with the fifth input, engine throttle, the total thrust produced. Second and third inputs are the cyclic control which tilts the main rotor and determines longitudinal or lateral flight direction. The fourth input is equivalent to pedals in large scale helicopters and controls the tail rotor blades inclination and in consequence direction.
1.4.1
State Variables and Parameters Definition
The model has nine inputs and twelve state variables. State variables evolve in the vehicle frame of reference as presented in Figure 1.3. The input vector is, [δcol , δlon , δlat , δped , δt , uw , vw , ww ]T where δ values represent collective, longitudinal, lateral, pedal and throttle control input and are restricted to the interval [−1, 1] to represent actuators saturation; and uw , vw , ww values represent the wind speed vector (which might also be considered as a disturbance) in body frame reference. State variables are, [u, v, w, p, q, r, ϕ, θ, ψ, a1 , b1 , Ω]T where (u, v, w) are the linear velocities in body frame reference; (p, q, r) are the angular rates corresponding to roll, pitch and yaw Euler angles (ϕ, θ, ψ); a1 , b1 are the longi-
1.4. THE SMALL HELICOPTER DYNAMIC MODEL
23
tudinal and lateral flapping angles; and Ω is the main rotor angular speed. Important model parameters include mass, denoted with a capital Ma and that varies from Mf ull to Mempty as fuel is consumed; moments of inertia are denoted with a capital I and also vary (linearly) as fuel is consumed; tail rotor and main rotor radius are denoted with a capital R; a capital C will denote lift coefficient, a measure related with the ability of a rotary blade or wing to produce lift; capital S will refer to effective areas and l, h will be used to indicate distances within the vehicle from the center of gravity c.g. or center of pressure c.p., considered equal for simplification. Sub- and super-scripts mr, tr, vf, ht and e will refer respectively to main rotor, tail rotor, vertical fin, horizontal stabilizer and engine. Notice that all cross-axis moments of inertia, except Ixz are neglected in the model. A more detailed list of parameters can be found on (Velez, 2007; Gavrilets, 2003).
1.4.2
Equations of Motion
The combined Newton’s Second Law and Euler’s Equations for linear and angular motion of a rigid body around its center of gravity, together with the flapping and main rotor speed dynamics that model the vehicle are presented in Eq. (1.3). In this equation, X, Y, Z symbolize forces and L, M, N moments around the x, y and z axes. g is the gravity constant and Qe is the engine torque. u˙ = vr − wq − g sin θ + (Xmr + Xf us ) /Ma v˙ = pw − ru + g sin ϕ cos θ + (Ymr + Yf us + Ytr + Yvf ) /Ma w˙ = uq − vp + g cos ϕ cos θ + (Zmr + Zf us + Zht ) /Ma p˙ = qr (Iy − Iz ) /Ix + (Lmr + Ltr + Lvf ) /Ix q˙ = pr (Iz − Ix ) /Iy + (Mmr + Mht ) /Iy r˙ = pq (Ix − Iy ) /Iz + (−Qe + Ntr + Nvf ) /Iz φ˙ = p + q tan θ sin φ + r tan θ cos φ θ˙ = q cos φ − r sin φ ψ˙ = q sin φ/ cos θ +�r cos φ/ cos θ �
∂a1 w−ww 1 u−uw + + ∂µ a˙ 1 = −q − aτe1 + τ1e ∂a ∂µ Ωmr Rmr z Ωmr Rmr θ ∂a b 1 v−v w 1 1 lat b˙ 1 = −p − τe − τe ∂µv Ωmr Rmr + τe δlat Ω˙ = r˙ + 1 (Qe − Qmr − ntr Qtr )
(1.3)
θlon δ τe lon
2.5Iβmr
Eq. (1.3) describes a non-linear time invariant system where X, Y, Z, L, M, N and Q are also non linear functions of other states. The equations for linear acceleration (u, ˙ v, ˙ w) ˙ rely on the components of acceleration determined by gravity, roll, pitch and yaw angular velocities and the effects of axial forces exerted by the main rotor, air pressure on fuselage, stabilizers and tail. Linear accelerations can be zero at rest, hover flight, or individually, in purely longitudinal, lateral or vertical flight. Although this exact conditions are rarely met in real flight, they are special linearization points that can predict behavior in takeoff, forward flight and hover. Eq. (1.3) has been linearized both analytically and numerically in Simulink and the linearized forms had been used to verify the validity of the model. Equations for (u, ˙ v, ˙ w) ˙ are non-linear for multiple
24
CHAPTER 1. INTRODUCTION
reasons including products of angular and linear velocities, trigonometric functions dependent on the Euler angles and saturations on the force components. Equations for angular acceleration (p, ˙ q, ˙ r) ˙ are a simplification of the inertia tensor products implemented in the Simulink model. A fourth inertia tensor component not displayed here, Ixz was included in equations to represent cross-axis rolling and yawing moments. This factor will be considered near zero for the purpose of this description. Angular accelerations depend on moments produced by the same forces in linear acceleration plus the engine drive. Angular accelerations are likely to be close to zero during most of the flight if the attitude is kept steady. This equilibrium is maintained by the acting helicopter forces and is essential for regular flight. Although a complete analytical description of equilibrium points for this system could be cumbersome, a few interesting results for flight operation modes can be found if some assumptions are made about state relations. At hover for example, linear and angular accelerations tend to be zero, so, if only the equations of motion are considered (denoting now forces and moments with a hat to account for the effects of zero velocities in their calculations): � � ˆ mr + X ˆ f us /Ma g sin θ = X � � g sin ϕ cos θ = − Yˆmr + Yˆf us + Yˆtr + Yˆvf /Ma � � ˆ ˆ ˆ g cos ϕ cos θ = − Zmr + Zf us + Zht /Ma ˆ mr = −L ˆ vf − L ˆ tr L ˆ mr = −M ˆ ht M ˆe = N ˆtr + N ˆvf Q To further simplify this expression it can be assumed that the pitch angle is close to zero and dropping the horizontal stabilizer and vertical fin effects the following expression is obtained: ˆ mr = −X ˆ f us X � � ˆ ˆ ˆ g sin ϕ = − Ymr + Yf us + Ytr /Ma � � g cos ϕ = − Zˆmr + Zˆf us /Ma ˆ mr = −L ˆ tr L ˆ mr = 0 M ˆe = N ˆtr Q This expression shows the balance of forces required to maintain hover: equivalent fuselage, tail and main rotor forces to keep the longitudinal and lateral position, relations between thrust an gravity to sustain flight and the tail and engine interaction required to maintain direction. Interestingly enough, thanks to Newton’s First Law, horizontal and vertical flight at constant velocities produce similar equations with the
1.4. THE SMALL HELICOPTER DYNAMIC MODEL
25
only difference that this time, a zero pitch angle can not be assumed. Regarding to stability in the equilibrium points it should be noted that with a few exceptions in forward flight, helicopters are in general dynamically unstable (Wagtendonk, 1996, p. 183) and require of constant pilot or automatic control attention to preserve balance. This indicates that the equilibrium points of the model are likely to be unstable knots, focuses or saddle points. Next section will present particular non linearities on the force and moment equations and the flapping angle and rotor speed equations which are related to engine and main rotor descriptions.
1.4.3
Equations of Force and Moments
The four basic forces of flight are lift, drag, thrust and weight. This four forces are represented in Eq. (1.3) by forces X, Y, Z and moments L, M, N and their magnitudes depend on both internal properties and external effects acting upon the vehicle. Lift and drag are mainly related to wind and aerodynamic characteristics of the helicopter surfaces. Thrust and weight depend on the engine, rotor and helicopter mass. For this model, it is always assumed that the fuselage center of pressure coincides with the center of gravity, therefore moments created by the fuselage aerodynamic forces are neglected. Equations for forces related to the main rotor and engine will be first described and a description of fuselage and tail forces and moments will continue. Rotational motion power, defined as angular velocity times torque was modeled by Gavrilets as a linear function of throttle input (due to the absence of maps from the X-cell engine) as, Pe = Pemax δt
(1.4)
Engine torque is then computed as, Qe =
Pe Ω
˙ of Eq. Providing one of the variables on yawing acceleration (r) ˙ and rotor speed (Ω) (1.3). The equation for rotor speed is again, Ω˙ = r˙ +
1 (Qe − Qmr − ntr Qtr ) 2.5Iβmr
Factors Iβmr and ntr are parameters of the main rotor blades flapping inertia and the tail rotor to main rotor gear ratio. The equation for Ω˙ is non linear as it is dependent on the expression for r˙ and the non linearities on Qmr and Qtr . Main rotor torque (Eq. (1.5)) is proportional to rotor speed, air density and main rotor radius. The CQ coefficient represents drag on main blades and is dependent on the blade profile drag parameterized as QD0 and blade surface trust coefficient CT . 3 Qmr = CQ ρ (ΩRmr )2 πRmr
(1.5)
26
CHAPTER 1. INTRODUCTION
Even though the flapping dynamics were neglected in the expression for total thrust, it is certainly true that the thrust vector is dependent upon flapping angles (a1 , b1 ). The stabilizer or Hiller bar influence on flapping angles has been shown to be low (Gavrilets, 2003, p. 39) and the main rotor and stabilizer bar were considered as a single unit. The flapping dynamics equation, first presented in Eq. (1.3) is next: � � ∂a1 w−ww 1 u−uw + + θτlon δlon a˙ 1 = −q − aτe1 + τ1e ∂a ∂µ Ωmr Rmr ∂µz Ωmr Rmr e θ ∂b b b˙ 1 = −p − 1 − 1 1 v−vw + lat δlat τe
τe ∂µv Ωmr Rmr
τe
Here p and q are states, θlon δlon and θlat δlat represent the commanded control input 1 ∂b1 converted to their equivalent changes in the blade angle of attack and τe , ∂a , are ∂µ ∂µ the damping time constant and dihedral derivatives. Dihedral derivatives go beyond the purpose of this description but are presented in detail by (Mettler, 2003). As the main blades rotate air is pushed downward and a resulting force is produced normal to the plane formed by the blades in motion. The three components of this force are the (Xmr , Ymr , Zmr ) elements in the equations of linear motion and depend on thrust and flapping angles (a1 , b1 ). If Tmr is the thrust force magnitude, its components can be found with trigonometric functions as in (1.6). Xmr = −Tmr sin a1 cos b1 Ymr = Tmr sin b1 cos a1 Zmr = −Tmr cos a1 cos b1
(1.6)
Main blades longitudinal and vertical inclinations are usually lower than 10 degrees so a linear approximation is employed (Eq. (1.7)) to simplify (1.6). This simplification avoids calculation of trigonometric functions but is still non linear as both (a1 , b1 ) and Tmr dependent on other states.
Xmr = −a1 Tmr Ymr = b1 Tmr Zmr = −Tmr
(1.7)
To model thrust force, it is assumed that the inflow is steady and uniform. Such model is presented on Eq. (1.8) and is dependent on air density, main rotor radius, rotor speed and the so called thrust coefficient CTmr . The thrust coefficient provides a variable relationship between the trust, air density, rotor radius, speed and collective input δcol . Notice this implies a two way relation between the thrust coefficient and thrust, so calculation of Tmr and CTmr is implemented as a recursive algorithm. CT mr is also limited by aerodynamic characteristics an depends on state Ω making Tmr non linear. 2 Tmr = CTmr ρ (ΩRmr )2 πRmr
(1.8)
1.4. THE SMALL HELICOPTER DYNAMIC MODEL
27
An additional property of the engine and main rotor system model is the inclusion of a digital governor, an external device that controls engine throttle maintaining constant rotor angular speed. This device is particularly useful for autonomous flight to preserve near constant RPMs. The digital governor was modeled as a proportional-integral controller whose parameters were identified in absence of manufacturer descriptions. Moments of inertia produced by main rotor are those of Eq. (1.9) and depend on trust, distance to the tail rotor head, and flapping angles. The restriction of the blade to the rotor head (there is no conning) is modeled as a linear torsional spring with constant of stiffness Kβ . Lmr = (Kβ + Tmr hmr ) b1 Mmr = (Kβ + Tmr hmr ) a1
(1.9)
Drag forces on fuselage (Xf us , Yf us , Zf us ) are the result of dynamic pressure exerted by air and the rotor downwash and opposite to movement. Conditions of this force may vary if the vehicle is at hover or at relatively high forward or lateral velocity compared to the main rotor induced velocity Vimr . The approximation used in the model makes these forces proportional to absolute air speed V∞ and the area of the affected frontal, lateral and vertical surfaces as in Eq. (1.10). Notice the influence of the rotor downwash is added to vertical velocity respect to air and is considered in the absolute air velocity equation. Velocity respect to air or air velocity is the difference of vehicle velocity and wind velocity and is expressed as ua = u − uw , va = v − vw , wa = w − ww . The equation finding (Xf us , Yf us , Zf us ) is again nonlinear as it involves powers of state variables. V∞ =
q
u2a + va2 + (wa + Vimr )2
Xf us = −0.5ρSxf us ua V∞ Yf us = −0.5ρSyf us va V∞ Zf us ua va wa
= −0.5ρSzf us (wa + Vimr ) V∞ = u − uw = v − vw = w − ww
(1.10)
Due to fixation of the frame of reference to the vehicle body it can be considered that tail rotor produced forces only affect the y axis dynamics. This side force, noted Ytr is related to tail rotor physical characteristics such as radius, speed at the hub, wind effects and tail control trim setting and command. The tail rotor trust model is similar to the main rotor trust and is computed as in Eq. (1.11). Corresponding moments are in Eq. (1.12). 2 Ytr = −ft CTtr ρ (Ωtr Rtr ) πRtr (1.11) Ntr = −Ytr ltr Ltr = Ytr htr
(1.12)
28
CHAPTER 1. INTRODUCTION
In Eq. (1.11), ft is the fin blockage factor, a constant parameter related to the effect of the tail pressure on the tail vertical fin. The tail rotor speed Ωtr is obtained from the main rotor angular speed as they are connected mechanically by gearing. The gear ratio ntr is found as a division of the number of teeth of the main rotor gear by the number of teeth of the tail rotor gear (Eq. (1.13)). The tail rotor thrust coefficient CTT r is similarly to CT and is found with an iterative method, this time considering the tail rotor characteristics. The side force Ytr is non linear because states such as velocity v are involved in the non linear expressions used to calculate the variable coefficient CTtr . This same coefficient is limited above and below to represent stall conditions establishing a saturation point for Ytr . Ωtr = ntr Ωmr
(1.13)
The helicopter small wing like attachments depicted in Figure 1.2 referred as horizontal stabilizer and vertical fin have the function of stabilizing the fuselage in longitudinal inclination and yaw orientation (Wagtendonk, 1996). Particularly, the horizontal stabilizer helps a helicopter in forward flight to keep the nose down providing a grater angle of attack if straight gust causes the body to pitch up. Dorsal and ventral vertical fins provide directional stability acting in a similar form as a wind direction indicator, tending to keep the tail steady in forward flight. The vertical fin is usually located near the tail rotor and is affected by the tail rotor air flow. The horizontal stabilizer is normally under the main rotor downwash. For this reason the vertical fin and horizontal stabilizers apply forces in y and z axes and moments around the x, y and z axes. The vertical fin side force is approximated in the model by Eq. (1.14) and it is dependent upon air density, the vertical fin area Svf , the vertical fin drag curve slope CLvfα , the tr axial velocity at the tail rotor center Vinf , tail rotor distance to the center of mass ltr and side velocities found at the tail rotor vvf . These relations are presented in Eq. (1.15). Vitr is the velocity induced by the tail rotor which is multiplied by factor εtr vf , representing the area of the vertical fin exposed to the tail rotor influx. The equation for Vitr is in (1.16). The Yvf equation contains an absolute value, powers of states and is also limited to represent stall conditions. Its minimum and maximum are determined by Eq. (1.17). � � vf tr Yvf = −0.5ρSvf CLα V∞ + |vvf | vvf (1.14)
V∞tr
q 2 = u2a + wtr
(1.15)
vvf = va − εtr vf Vitr − ltr r wtr = wa + ltr q − Kλ Vimr Vitr = λtr 0 Ωtr Rtr |Yvf | ≤ 0.5ρSvf
�
V∞tr
�2
(1.16) 2 + vvf
�
(1.17)
1.5. CONTROL STRATEGY
29
Vertical fin corresponding moments are: Nvf = −Yvf ltr Lvf = Yvf htr
(1.18)
Horizontal stabilizer contributes to the vertical Z direction sum of forces and is noted Zht . Value Zht is determined as a function of its area Sht , lift coefficient CLhtα and speed at its location. The equation describing force Zht is Eq. (1.19). The wht component represents velocity and is influenced by the main rotor downwash, pitching speed, distance and the wake turbulence generated by the main blade tips. This is presented on Eq. (1.20). � (1.19) Zht = 0.5ρSht CLhtα |ua | wht + |wht | wht wht = wa + lht q − Kλ Vimr
(1.20)
Horizontal stabilizer force is limited by stall condition to take values in Eq. (1.21) becoming non linear. � 2 |Zht | ≤ 0.5ρSht u2a + wht (1.21)
1.5 1.5.1
Control Strategy Hybrid Systems
Complex systems typically possess a hierarchical structure, characterized by a mixture of both continuous dynamics at the lower levels and logical decision-making at the higher levels. This type of system is common in the real world, and is typical on the field of flight control systems. Complex systems such as an autonomous helicopter are hybrid because they exhibit discrete and continuous dynamics that appear in the form of step-wise changes of state at discrete points in time, or event-driven changes occurring at any time. From this definition, hybrid systems involve both continuous and discrete state variables, and their evolution is described by equations that depend on both. These equations contain mixtures of logic and discrete-valued dynamics and continuous variable dynamics. The continuous dynamics may be of continuous time, discrete-time or sampled. Continuous dynamics emerge from system evolution in continuous time, and are described by dynamic laws modeled by differential or difference equations. Discrete variable dynamics are generally governed by a digital automaton with a finite number of states. Continuous and discrete dynamics interact whenever events occur. The occurrence of the events is determined either by internal or external sources. Hybrid control systems are control systems for hybrid systems. Hybrid control systems deal with continuous and discrete dynamics and require continuous and discrete controllers. A hybrid controller depends on discrete phenomena and each discrete state
30
CHAPTER 1. INTRODUCTION
may correspond to independent continuous states, dynamics and controllers. The typical approach in control design for this kind of system is to convert the system to a system purely continuous or purely discrete, as there are already engineering tools to describe and analyze each of them (Branicky et al., 1998). Converting the system to a pure continuous system is known “continuation” while converting the system to a pure discrete system is known as “aggregation”. In the continuation paradigm, the complete system is treated as a single differential equation, by either embedding the discrete actions in nonlinear ordinary differential equations or treating the discrete actions as disturbances of a differential equation. In the aggregation approach, the entire system is treated as a finite automaton or discrete event system. This is accomplished by partitioning the continuous space state and considering only the aggregated dynamics from cell to cell in the partitions. In this approach two states could contain two different controllers for the same plant or plant subsystem, so the hybrid system is an indexed set of dynamical systems and a set of rules for transitions among those. The transitions are initiated when one continuous state satisfies certain conditions. The rules of the transition establish the initial continuous state of the new dynamical system. The aggregation approach will be the one taken in this thesis as each state might control a different linearized version of the dynamic system. Transition management is then a central issue on hybrid control systems implementation. A transition strategy is needed to smooth transitions after events, avoiding transients caused by a discrete switches amongst controllers. Such changes can excite high frequency dynamics in the system, causing undesired reactions and over stressing the actuators. There are various approaches to handle transition effects, which range from creation of additional discrete states for every transition to simply ignoring them assuming the dynamics of the transition take place very fast. Commonly, the designer tries to alleviate transitions between discrete states without altering the discrete set of states. One of the approaches is to adjust the parameters of the two controllers, blending their values during the transition. The blending could start just before the transition occurs if certain conditions are met. A good review of transition management strategies can be seen in (Guler et al., 2001). In this paper, five generic transitions strategies are identified: discrete switching, output blending, transient management, state initialization and parameter blending. In the discrete switching strategy, no attention is paid to the transition and the controller switching is done without any extra action. In the output blending scheme, the output of the two controllers is mixed so once the switching occurs, the combined output of the controllers resembles that of the previous controller and it is then smoothly transferred to that of the new controller. In the transient management strategy, the designer focuses more in reducing the transient effects that in the actual switching. For this, a transient compensator is added at the output of the controller and activated prior and during the switching. The state initialization technique is in principle similar to the transient management strategy with the difference that in this case, known initial values are assigned to the control signal before the transition. This ensures the output it is not an extreme value
1.5. CONTROL STRATEGY
31
for the actuators. If the controllers in the transition have the same structure, the second controller could be initialized with the last state of the previous controller preserving continuity. Finally, the parameter blending strategy tries to solve the problem focusing on the controller parameters instead of the controller output. If the controllers to be used in the different modes have the same structure but different parameters, a single controller could be used an then be smoothly converted to another moving from the parameters of the first to the second. The so called “parameter blender”, an additional observer added in the feedback signal, knows the output of the plant and uses this information to schedule the transition. The approach taken for transition management in this thesis will be based in the parameter blending strategy. The transient management and state initialization schemes were considered reactive, instead of proactive, and in consequence inappropriate for systems with fast dynamics as a helicopter. Within the parameter blending strategy, was of particular interest the technique known as “gain scheduling”. The main idea behind gain scheduling is to identify so called “auxiliary variables” (AV), which are variables of the system that correlate well with changes in process dynamics. The AVs are then used to reduce the effects of controller switching simply by changing the control parameters as functions of the auxiliary variables. The gain scheduling concept originated from the development of flight control systems and has been used in autopilots of high-performance aircraft (Astrom & Wittenmark, 1995). Once the auxiliary variables have been determined the controller parameters are calculated at each plant mode or operation condition. For the case of the unmanned helicopter, auxiliary variables are replaced by the finite state machine which predicts when transitions take place. The system performance of a gain scheduled controller is typically evaluated by simulation (Astrom & Wittenmark, 1995, p. 392).
1.5.2
Control System Architecture
The control system architecture for the autonomous small helicopter is presented on Figure 1.4. Every flight of the autonomous vehicle starts from a mission assigned by a human operator who indicates a route to follow (X) to an automated mission planner on a ground computer. The mission planner converts the waypoint defined trajectory and actions in a smooth description and a set of properties of each waypoint. The mission planner provides the finite state machine (that runs in the flight computer) with a routine to follow (P). The FSM will make decisions regarding to the best way to execute each routine, selecting continuous controllers and discrete time actions. The control system carries out the tasks assigned by the FSM (xf sm ) executing the final actions in the vehicle inputs (δ) with the help of the current estimated state (ˆ x). Control system transitions are assisted by a gain scheduler which determines the current controller set of gains or parameters (Kgs ) and slowly transitions among them. At any moment an emergency pilot can take control of the vehicle (δman ) sending a switching signal (ma ). The mission operator knows at every moment the Kalman filter (Rogers,
32
CHAPTER 1. INTRODUCTION
Figure 1.4: Control system architecture. 2000) estimated state from a monitoring interface. This architecture is not unique and is in part based on similar previous works (Sanders et al., 1998; Koo, Hoffmann, et al., 1999). Commonly, in other implementations, the system coordinating the transitions is also defined by a finite state machine or by extended formalisms of state automata that add characteristics such as parallel execution and hierarchy (Liu, Liu, Eker, & Lee, 2003). For this case Stateflow and Simulink are used (Mathworks, 2006a, 2006d). Stateflow defines a visual language based on the FSM extended formalism of Statecharts first introduced by (Harel, 1987). A Statechart adds hierarchy and parallelism to the formal definition of a FSM. Only the classic FSM features will be used on this work to better comply with the Discrete Events System formalism of (Zeigler et al., 2000).
1.6
Related Work
Linear programming and mixed integer lineal programming are common approaches used before for helicopter path planning and route optimization (Menon & Kim, 1990; Richards, 2002). One clear disadvantage of the linear programming solution is its computational expensiveness and inability to modify a path interactively. Regeneration of a trajectory requires finding a new solution of the lineal programming problem which usually takes a large amount of time. The increase on the number of waypoints also increases computational cost and the time required to obtain a solution. An interesting aspect of this approach however, is the ability to include another constrains in the solution, as for example, fuel constrains. For the approach presented on this thesis fuel and time constrains can be controlled by the flight operator interactively as the route is defined. The use of FSM and hybrid controllers for unmanned helicopters has also been
1.6. RELATED WORK
33
explored before. In (Coleman, Creel, & Drinka, 2002) emphasis is made on the use of a state machine for the mission control of a helicopter and the control of discrete events. However, the automaton defined was designed specifically to fulfill a single mission and there is not a clear description of the flight modes or how they influence the control actions. In (Doherty et al., 2004) a distributed architecture for an unmanned helicopter UAV is discussed. The flight modes of the state automaton are described although experimental results do not appear in the paper. The specific use of a tool for the design of hybrid control systems with the hybrid control architecture Ptolemy II, appears in (Schrage & Vachtsevanos, 1999) and (Guler et al., 2001). The authors emphasize in the necessity of using transition handling schemes at controller switches. The study is nevertheless limited to the architecture and benefits from the framework and not its implementation. The use of Simulink and Stateflow in a configuration similar to the one in this work is presented in (Stone, 2004). This work reports the satisfactory use of a combination of Simulink and Stateflow diagrams in a T-Wing vehicle control system for vertical and horizontal flight. This system also employs gain scheduling techniques for transition management between states and reports satisfactory results in the use of the method, although no experimental data is presented to support this claim. Stateflow and Simulink also are used by (Ledin, 2002) in a simulation environment for a limited three degrees of freedom helicopter. This work does specify the flight modes and transitions for this vehicle but does not show any resulting values from experimentation. The use of a FSM an autonomous helicopter appears in (Saripalli, Sukhatme, & Montgomery, 2002), but this work is limited to the landing problem. In (Koo, Sinopoli, Sangiovanni-Vicentelli, & Sastry, 1999) a formal method for the design of reactive systems is described and applied to the flight control system of a robot helicopter. The system is divided in subcomponents and organized in layers in a form similar to this thesis proposed architecture. Simulation results are presented on this work, describing complete trajectories, but no transition management schemes are acknowledged. This is partly because the paper deals more with validation of a proposed theoretical simulation method. The work in (Sanders et al., 1998) describes a FSM for autonomous helicopter flight and provides a detailed description of each state on and its integration with the system architecture. Nevertheless this work lacks description of the transitions. In (Geyer & Johnson, 2006) a type of Bezier splines is used for obstacle avoidance in simulation of a laser guided helicopter. Some results are shown but more precise error data has not been found. Finally, the work in (Harbick et al., 2004) describes an smoothing strategy based in Catmull-Rom splines (Catmull & Rom, 1974) for helicopter flight. This work covers trajectory smoothing but not velocity or mode management.
34
CHAPTER 1. INTRODUCTION
Chapter 2 Method In order to reduce direction and mode change transients, the helicopter flight plan is transformed into a smooth trajectory. This trajectory is rendered in flight by a finite state machine, able to infer flight mode changes and in general, to direct the autonomous flight. The smoothing process requires transforming a fifth dimensional plan schedule of position, velocity and hover time to a structure of state descriptors. Rendering the trajectory requires a FSM based discrete event manager able to translate this structure in continuous sampled set points, and guiding the vehicle position, velocity and orientation. Transforming the original flight plan into state descriptors requires conversion of the flight schedule in spline polynomial functions and deducing arc length and traversal time of such functions. Designing the FSM requires knowledge of the operation modes of the helicopter and transitions among modes. As will be described in this chapter, transforming the 3D flight plan to a set of smooth functions goes beyond simply smoothing the flight plan. Velocity and mode changes need also to be integrated in the resulting description. This chapter describes the trajectory smoothing process and then describes the FSM mechanics, trajectory processing and mode management. The set of symbols used to describe the trajectory is presented first and then the spline smoothing method is specified. Once the required parameters are extracted from the smoothed flight plan, a formal description of the FSM will be helpful to model conversion of these in control system input.
2.1
Notation
The trajectory is described as a sequence of points assigned by a flight operator (Figure 2.1). The series of flight waypoints will be referred as the vector sequence: � X = x1 , x2 , . . . , xi, xi+1 , . . . , xn+1 where xi = hxi , yi , zi , vi i contains a three dimensional point and a speed value. According to this notation, vi will indicate the expected velocity of the vehicle at the moment it reaches xi , yi , zi . If two successive waypoints have the same velocity 35
36
CHAPTER 2. METHOD
Figure 2.1: Waypoint and trajectory notation. values, the trajectory within those points should be covered at constant velocity. If two consecutive points have different velocity values, the trajectory smoothing algorithm and FSM should provide a velocity transition to meet the specified velocities from the starting to end waypoint. A hover waypoint will be indicated as hxi , yi , zi , 0i and a separated sequence: � Th = th1 , th2 , . . . , thi , th(i+1) , . . . , th(n+1) corresponding to the hover time for each waypoint (zero if a velocity waypoint) should be specified. As hover implies velocity is zero or near zero it is true that ∀i, thi 6= 0 ⇔ vi = 0. On this definition, two successive waypoints cannot be zero as the velocity of the trajectory between them will be zero. As only the two dimensional problem being considered, the zi component of xi will be a constant height value, except z1 which will be the startup ground position. The first waypoint will be normally specified as x1 = hx1 , y1 , z1 , 0i with x1 , y1, z1 the initial position and zero velocity. To reach one of the waypoints in a given moment, the main task of the trajectory smoother will be to find points between two successive waypoints xi and xi+1 . The trajectory between xi and xi+1 will be called the segment xi , xi+1 or just segment i. A piecewise polynomial vector describing the smooth trajectory and velocity on segment i will be denoted: pxi (u) = hpxi (u) , pyi (u) , pzi (u) , pvi (u)i
2.2. TRAJECTORY SMOOTHING
37
where any of the elements will have the form p (u) = au3 + bu2 + cu + d with u is always in the interval [0, 1). Also pxi (0) = xi and, lim pxi (u) = xi+1
u→1
Note that in the last definition, the parameter u is directly related to distance and not time, this will become more clear as this chapter evolves. The entire set of polynomial arrays will be referred as: � P = px1 , px2 , . . . , pxi , px(i+1) , . . . , pxn The length of arc segment xi , xi+1 , that is, the length of the three-dimensional arc described by hpxi (u) , pyi (u) , pzi (u)i , u ∈ [0, 1) will be denoted li and the complete sequence of lengths will be the set L = {l1 , l2 , . . . , li , li+1 , . . . ln } The set of times required to cover each smooth segment at variable speed pvi (u) will be denoted T = {t1 , t2 , . . . , ti , ti+1 , . . . tn } The fundamental sample time, at which the trajectory generator will produce its output will be called Ts and a velocity value which is very close to zero but not zero will be called vε . This concept will be introduced in next sections. Table 2.1 presents a summary of the notation here described.
2.2 2.2.1
Trajectory Smoothing Spline Trajectory Functions
A spline is a polynomial function defined in very simple disjoint subsets of its domain having the characteristic of globally being smooth and flexible (Bartels et al., 1987; Weisstein, 2002). A spline can also be defined as the mathematical mean of representing a complex curve1 . For the two dimensional case, a curve can be defined parametrically as, px (u) = hpx (u) , py (u)i where px (u) and py (u) are single-valued polynomial functions of the parameter u. Functions px (u) and py (u) are piecewise functions that produce the x and y coordinates of every point of the curve as u progresses. The curve is broken in a finite number of segments, each defined by individual polynomials pxi (u) and pyi (u). As the u parameter increases between a minimal value umin and a final value umax , values of u called knots 1
Here complex is understood as feature rich and not as in Complex Numbers.
38
CHAPTER 2. METHOD Symbol X xi = hxi , yi , zi , vi i Th thi xi , xi+1 Xi P pxi = hpxi , pyi , pzi , pvi i u ∈ [0, 1) L li T ti Ts vε
Description Set of waypoints A waypoint at position xi , yi , zi and expected velocity vi Set of hover waypoint times Hover time at waypoint xi Segment from xi to xi+1 , or segment i Set of sub-waypoints Set of polynomial arrays Polynomial describing the arc for segment xi , xi+1 Polynomial distance parameter Set of arc lengths X Length of the arc formed by polynomials hpxi (u) , pyi (u) , pzi (u)i Set of times required to cover waypoints X Time to cover arc hpxi (u) , pyi (u) , pzi (u)i at speed pvi (u) Fundamental sample time A very small but not zero velocity value
Table 2.1: Trajectory notation. will be encountered and correspond to the joints between the segments. The sequence of knot values is increasing, so umin = u1 < u2 < . . . < un+1 = umax The sequence u1 , u2 , . . . , un+1 is known as the knot sequence or knot vector. The parametric functions px (u) and py (u) are composed of polynomial pieces, the first covering the interval u1 to u2 , then from u2 to u3 and so on, so: hpx1 (u) , py1 (u)i , u1 ≤ u < u2 hpx2 (u) , py2 (u)i , u2 ≤ u < u3 px (u) = .. .. . . hp (u) , p (u)i , u ≤ u ≤ u xn yn n n+1 Usually px (u) and py (u) are required to satisfy some continuity constrains at the knots. If the 0th through dth derivatives of px are continuous at the joints then px is called a C d continuous spline. On many spline definitions the knots are assumed to be at a constant parameter distance apart so ui+1 = ui + ∆u and the knot sequence is called a uniform knot sequence. In many cases for convenience ui = i, so ∆u = 1. There are two basic forms of splines: interpolating and approximating splines. In the case of interpolating splines, the curve is required to pass through all data points xi
2.2. TRAJECTORY SMOOTHING
39
in sequential order. In the case of approximation the curve is required only to pass near data points. In both cases moving any of the points changes the curve either locally or globally. For trajectory generation, it will be required that only a local portion of the curve changes with the movement of one of the data points. Additionally, the curve should pass through all data points. Several methods exist for finding the functions pxi (u) and pyi (u), depending on requirements such as the shape of the curve, smoothness, number of data points touched and computational cost. Common methods are B-splines, Bezier, Hermite and Cubic splines. A good review of spline methods can be found in (De Boor, 1978; Bartels et al., 1987). Of particular interests are the Catmull-Rom splines (Catmull & Rom, 1974), which are a subset of Cardinal splines and Hermite splines. Hermite splines pass through all data points, something desired in the helicopter route. A Hermite spline is also smooth enough (C 1 ) to avoid extreme direction and velocity changes. An additional property of Hermite splines is local control, so modifying one of the knots only affects the surrounding knots and not the entire trajectory. Cardinal splines and the CatmullRom spline for a 2D trajectory will be defined next. u Let pxi (u) = px (u) |ui+1 be a Cardinal spline with point restrictions for ui and ui+1 i such that, xi = hpx (ui ) , py (ui )i = pxi (ui ) xi+1 = (px (ui+1 ) , py (ui+1 )) = pxi (ui+1 )
(2.1)
Let also be two additional restrictions on the derivatives (tangents) at pxi (ui ) and pxi (ui+1 ) such that, 0
pxi (ui ) = α (xi+1 − xi−1 )
(2.2)
0
pxi (ui+1 ) = α (xi+2 − xi ) That is, the tangent at the first point xi is semi-parallel (α 6= 1) to the line formed by the point xi−1 and xi+1 and the same for the second point xi+1 (See Figure 2.2). Here α is a tension parameter, which determines the slant of the derivatives and how strained the curve will be. For simplicity let ui = 0 and ui+1 = 1 (as it can be verified this does not affect the final result). The restrictions of the segment are again, pxi (0) = xi pxi (1) = xi+1 0
pxi (0) = α (xi+1 − xi−1 ) 0
pxi (1) = α (xi+2 − xi ) The general equation of a parametrical two dimensional cubic curve is, pxi (u) = au3 + bu2 + cu + d
40
CHAPTER 2. METHOD
Figure 2.2: Cardinal spline notation. 0
With a = hax , ay i , b = hbx , by i , c = hcx , cy i , d = hdx , dy i. Since pxi (u) = 3au2 + 2bu + c then,
pxi (0) = d pxi (1) = a + b + c + d 0
pxi (0) = c 0
pxi (1) = 3a + 2b + c This can be expressed in matrix form as, pxi (0) 0 pxi (1) 1 0 pxi (0) = 0 0 3 pxi (1)
0 1 0 2
0 1 1 1
1 a 1 b 0 c 0 d
From equation (2.1) and (2.2) it is also true that, pxi (0) 0 1 pxi (1) 0 0 0 pxi (0) = −α 0 0 0 −α pxi (1)
0 1 α 0
0 xi−1 0 xi 0 xi+1 α xi+2
2.2. TRAJECTORY SMOOTHING
41
and comparing this last two, −1 a 0 0 0 1 0 1 0 0 xi−1 b 1 1 1 1 0 0 1 0 = xi c 0 0 1 0 −α 0 α 0 xi+1 d 3 2 1 0 0 −α 0 α xi+2 xi−1 −α 2 − α α − 2 α 2α α − 3 3 − 2α −α xi = −α 0 α 0 xi+1 0 1 0 0 xi+2 For the two dimensional case, as the tension parameter α approaches zero the tension in each knot is higher, so the spline becomes closer to a polygon. Catmull-Rom splines are those Cardinal splines where α = 1/2, so the parameters a, b, c, d can be obtained as, 1 3 xi−1 a − 2 2 − 32 21 b 2 − 5 4 − 1 xi 2 2 2 = 21 1 c − 0 0 xi+1 2 2 2 0 0 0 xi+2 d 2 −1 3 −3 1 xi−1 1 2 −5 4 −1 xi = 1 0 xi+1 2 −1 0 0 2 0 0 xi+2 With this procedure the polynomial coefficients for each segment are determined.
2.2.2
Velocity Smoothing
Changing from a constant flight velocity to another, for example from 1 to 2 m/s, implies a sudden change on the control system velocity set point and in consequence an unwanted transient in the system. Suppose the flight plan of Figure 2.3 was assigned to the helicopter. When the vehicle reaches position x = 100, velocity is changed suddenly from 1m/s (3.6 Km/h) to 2m/s (7.2 Km/h). On the helicopter, forward velocity is directly related to nose inclination, so this command will cause the vehicle suddenly increasing its pitch generating dangerous levels of stress on the actuators. It would be desirable to progressively change velocity to reduce forward and pitch acceleration. The smoothing method used to produce the trajectory was considered a good candidate for smoothing velocity due to continuity at the joints. The method can be easily translated to a one dimension function of the u parameter. The one dimensional factors av , bv , cv , dv of the velocity function pvi (u) = av u3 + bv u2 + cv u + dv can then be determined as, −1 3 −3 1 vi−1 av bv 1 2 −5 4 −1 vi = (2.3) cv 2 −1 0 1 0 vi+1 0 2 0 0 vi+2 dv
42
CHAPTER 2. METHOD
Figure 2.3: A velocity change example. with vi and vi+1 the initial and final velocity for the given segment. Figure 2.4 presents an equivalent fight plan that meets the velocity values but changes from one value to the other smoothly. A particular property of the shape of pvi (u) is the asymptotic behavior of the curve near zero. Near zero velocity values implies longer times (v → 0 ⇒ t = x/v → ∞) and discontinuities in the time calculation integral. This problem was solved replacing zero velocities in the calculation of pvi (u) with a near zero value vε = 0.01m/s = 1cm/s and increasing the slope of the near zero velocity knot with an arbitrary vi−1 value (usually −10). This improved the stability on the time calculations and reduced trajectory times. As it will be presented on the FSM formal definition values near vε are treated as zero in any state and in consequence zero velocity maneuvers (e.g. hover) do not accumulate error. Catmull-Rom smoothing is however not the only way velocity can be optimized for flight. Other approaches such as ramps and variations of the α parameter on the Cardinal function were tested on simulation. The FSM was designed to be flexible enough to allow lower order polynomials such as pvi (u) = cv u + dv . Indeed, as the final chapter of this thesis will show, simulation results showed similar results for smooth and ramp like trajectories, and apparently overshoots on the smooth curve resulted to be detrimental in velocity changes.
2.2.3
Trajectory Properties
Two important attributes of the smooth trajectory are its length and traversal time. Length of the trajectory will establish its importance once the FSM converts it from its polynomial description to controller set points. The u parameter is directly related to length as it will be shown later in this chapter. Knowing the traversal time guarantees
2.2. TRAJECTORY SMOOTHING
43
Figure 2.4: Smoothed velocity example. the helicopter will not surpass the maximum time allowed by fuel or battery constrains. Although flight time could be approximated from the flight operator established velocities and trajectory length, modification of the velocity itinerary through smoothing alters the real traversal time. Length of the two dimensional trajectory for segment i can be found with the arc length function for parametric curves: Z li =
1
q
pxi (u)2 + pyi (u)2 du 0
0
(2.4)
0
Integral of Eq. (2.4) is in general not solvable analytically for second order polynomials, so the Gauss-Legendre integration method is suggested (Guenter & Parent, 1990). Gauss-Legendre integration is preferred due to its accuracy for polynomial related functions and exactness for up to 2N −1 degree polynomials, with N the number of Gauss-Legendre points (Mathews & Fink, 2004, p.398). The two point Gauss-Legendre integration method is defined for a function, p = f (u) , − 1 ≤ u ≤ 1 whose integral is approximated by the weighted values, Z
1
f (u) dx ≈ w1 f (u1 ) + w2 f (u2 ) −1
As the method is defined to be exact for a cubic polynomial let f (u) = au3 + bu2 + cu + d so,
44
CHAPTER 2. METHOD
Z
1
−1
�
� � � au3 + bu2 + cu + d du = w1 au31 + bu21 + cu1 + d + � � w2 au32 + bu22 + cu2 + d
Applying the undetermined coefficients method, Z 1 � a u3 du = a w1 u31 + w2 u32 −1 Z 1 � u2 du = b w1 u21 + w2 u22 b −1 Z 1 udu = c (w1 u1 + w2 u2 ) c −1 Z 1 du = d (w1 + w2 ) d −1
An replacing in last equation with the values from (2.5), (1)4 (−1)4 − = 0 = w1 u31 + w2 u32 4 4 2 (1)3 (−1)3 − = = w1 u21 + w2 u22 3 3 3 2 2 (1) (−1) − = 0 = w1 u1 + w2 u2 2 2 (1) − (−1) = 2 = w1 + w2 Now, comparing zeros, w2 u32 w1 u31 = w1 u1 w2 u2 2 u1 = u22 Also u1 = −u2 so, w 1 u1 −w2 u2 = u1 −u2 w1 = w2 Finally, w1 = w2 = 1 w1 u21 + w2 u22 = u22 + u22 = u22 =
1 3
2 3
(2.5)
2.2. TRAJECTORY SMOOTHING k 1, 8 2, 7 3, 6 4, 5
45
uk ±0.9602898565 ±0.7966664774 ±0.5255324099 ±0.1834346425
wk 0.1012285363 0.2223810345 0.3137066459 0.3626837834
Table 2.2: 8-point values for u and weights w for the Gauss-Legendre integration method Establishing that for the two point method, the values of f are, r 1 u1 = −u2 = ≈ 0.5773502692 3 As mentioned, the 2 points formula is exact for integration of cubic polynomials. If f is a third order polynomial then, � � � � Z 1 −1 1 +f √ f (u) du = f √ F2 (f ) = 3 3 −1 This rule can be extended to N-points. The general N-pont Gauss-Legendre rule which is exact for polynomials of degree ≤ 2N − 1 is, FN (f ) = w1 f (u1 ) + w2 f (u2 ) + · · · + wN f (uN ) Values uk and weights wk have been tabulated and are available in the literature. As (2.4) is not exactly a polynomial but the square root of one, values of the 8-point method were used for a better approximation. Corresponding u values and weights are presented on Table 2.2. Notice the Gauss-Legendre formula is defined for the interval [−1, 1]. To map it to an arbitrary interval [a, b] the following change of variables is required, a+b b−a + u 2 2 b−a d˜ u= du 2 The integral is now defined as, � Z b Z 1 � a+b b−a b−a f (˜ u) d˜ u= f + u du 2 2 2 a −1 And the N point Gauss-Legendre formula is, u˜ =
Z a
b
N
b − aX f (˜ u) d˜ u= wk f 2 k=1
�
a+b b−a + uk 2 2
�
In particular for the interval of interest a = 0, b = 1 the following mapping needs to be applied, 1+u u˜ = 2
46
CHAPTER 2. METHOD Algorithm Gauss-Legendre Numerical Parallelogram Real (l = 2πr)
Result 62.7752416101168 62.7752236408856 62.8318530717959
Table 2.3: Length numerical results for a 6 waypoints trajectory. And the final integral droping the tilde is, 1
Z 0
8
1X wk f f (u) du = 2 k=1
�
1 + uk 2
�
The Gauss-Legendre method is attractive not only for its precision but also its computational efficiency. With it, the length a two dimensional segment can be calculated with only eight iterations instead of a number of iterations proportional to the trajectory length. The length of the segment for polynomials, px (u) = ax u3 + bx u2 + cx u + dx py (u) = ay u3 + by u2 + cy u + dy whose derivatives are, p0x (u) = 3ax u2 + 2bx u + cx p0y (u) = 3ay u2 + 2by u + cy is specified by, Z
1
q
p0x (u)2 + p0y (u)2 du 0 s � �2 � �2 8 X 1 1 + u 1 + u k k ≈ wk p0x + p0y 2 k=1 2 2
li =
Precision of li is fundamental for trajectory rendering as it reduces irregularities at the knots, so numerical tests were made to test the Gauss-Legendre method. To validate the results a radius 10 circular trajectory was chosen. A circle was used because its circumference can be found exactly with many significant digits. The test was performed in two different configurations of the spline. On the first configuration the trajectory was generated for six equally spaced points on the circle perimeter. Results for six subdivisions and comparison to an additional numerical method are presented on Table 2.3. Note the numerical parallelogram method required two hundred iterations to reach that precision. The error is around six centimeters.
2.2. TRAJECTORY SMOOTHING Algorithm Gauss-Legendre Numerical Parallelogram Real (l = 2πr)
47 Result 62.8318530735243 62.8318530622568 62.8318530717959
Table 2.4: Length numerical results for a 360 waypoints trajectory. As the six points spline is not necessarily a circumference because of the low resolution a second test with a circular trajectory defined by 360 points was performed. The results obtained are those of Table 2.4. The Gauss-Legendre formula reached excellent numerical precision with only eight iterations compared to the parallelogram method with two hundred operations. Estimated traversal time can be obtained from the trajectory length, the velocity function and the basic relation t = x/v. One might intuitively believe that traversal time depends on the trajectory shape given by polynomials px (u) and py (u), however, as the velocity vector is always tangent to the trajectory, the change on velocity over the curve is equivalent to a particle following a line. Trajectory traversal was then estimated with the next method and its exactitude was verified in simulation with excellent results (around 1 to 2 seconds of error for considerably long trajectories of 15 minutes). Recall the definition of the definite integral for a function f continuous in x ∈ [a, b]: lim
n→∞
n X j=1
Z
b
f (x) dx
f (xj ) ∆x =
(2.6)
a
To find time t at a constant velocity v for the displacement from xj to xj+1 , the constant speed equation is xj+1 − xj t= v
Figure 2.5: An equally divided distance L covered at variable speed vi . For a list of constant velocities v1 , v2 , . . . , vj , . . . , vn (Figure 2.5) the time required by a particle to travel a distance l divided at equally spaced segments ∆x = xj+1 − xj (covering segment j at speed vj ) is the sum, t=
∆x ∆x ∆x ∆x + + ... + + ... + v1 v2 vj vn
48
CHAPTER 2. METHOD or also, n X 1 t= ∆x v j=1 j
Lets say the number of divisions is increased to a very large number and that the velocity at every division is described now by the function fv (xj ), so n X
t = lim
n→∞
j=1
1 ∆x fv (xj )
which fits with the definite integral definition 2.6, t = lim
n→∞
n X j=1
1 ∆x = fv (xj )
Z 0
l
1 dx fv (x)
or in this work notation, Z ti = 0
li
1 du pvi (u)
(2.7)
Whit this procedure traversal time for every segment can be found. Continuity of 1/pvi (u) is an issue, specially due to the initial and hover waypoints. For this reason the constant vε = 0.01 was introduced ensuring that always pvi (u) ≥ vε . Implementation of the time integral was done with numerical methods. The Gauss-Legendre method was tested but results were very inaccurate for near zero speeds. A simple numerical parallelogram method was used instead with excellent results.
2.2.4
The Smoothing Algorithm
The smoothing algorithm unifies position, velocity smoothing and extracted properties of length and time to produce the trajectory structure to be passed to the FSM. The basic smoothing algorithm is: smooth_trajectory(X,n,vepsilon) { X = replace_zero_velocities(X,vepsilon) for i = 2 to n+1 { P(i) = catmull_rom_poly(X(i),vepsilon) L(i) = gauss_hermite_len(P(i)) T(i) = num_time_calc(P(i),L(i)) } P(1) = takeoff_sequence(P(2))
2.3. THE FINITE STATE MACHINE
49
INI = initial_conditions(P(1)) return P,L,T,INI,n=n+1 } In the first operation zero velocities are replaced to avoid discontinuities at time calculation. The next section of the algorithm produces the smooth trajectory and velocity polynomials on P and calculates length and time for every segment i. The takeoff sequence is produced separately as the algorithms generating the trajectory are implemented for the two dimensional case only. Initial conditions are important to initialize the state estimation algorithm in flight so they are also produced. The smoothing algorithms final implementation is presented on appendix A.
2.2.5
Gain Scheduling
As described in the control architecture a gain scheduler helps the FSM and control system to move from a set of controller gains to another smoothly. This feature was implemented in Simulink as an array of discrete time Proportional-Integral-Derivative (PID) controllers with parameters Kp , Ti , Td and relaxation coefficient N able to change in time. Once the gain scheduler detects a mode transition, values Kp , Ti , Td , N for each controller are smoothly changed to new values creating a new controller. The smoothing method used was a Hermite spline with tangents zero equivalent to a Cardinal spline with tension value α = 0. This spline was chosen due to a lower number of operations and smoothness features. Parameter transition needs to be performed for four parameters on six controllers (24 polynomials are required to be found) so efficiency is an issue. The efficient Hermite interpolator is presented on Figure 2.6 and 2.7.
2.3
The Finite State Machine
The main function of the Finite State Machine is to render the predefined trajectory produced by the smoothing algorithm and perform event driven actions during each operation mode change. Event driven actions include default behavior once a waypoint is reached, executing takeoff and landing maneuvers, maintaining hover for a given time, and performing safety operations on mode changes such as autonomous to manual mode. Mode change transitory such as reaching a waypoint or manual to autonomous mode are alleviated thanks to a smooth trajectory and velocity and the gain scheduler. Flight modes and flight mode changes map directly to FSM states and transitions. The states of the FSM implementation were established from previous knowledge of helicopters flight, observation of manned flights and the autonomous helicopter flight modes proposed by (Sanders et al., 1998). Moreover, current implementation of the FSM is not arbitrary as several forms of it had been implemented and tested in simulation. The FSM presented in this work represents a two year effort on simplifying and minimizing its number of operations, memory consumption and time delays. On the first implementation of the FSM every trajectory point was computed before flight and
50
CHAPTER 2. METHOD
Figure 2.6: Efficient Hermite interpolation method implemented for the gain scheduler on Simulink. the FSM was left to recall each trajectory point. One of the clear advantages of this implementation was that computations required to render the trajectory were made before flight, freeing the flight computer from trajectory generation methods. The main disadvantage was that large amounts of memory were required to store the entire trajectory. The amount of memory used was directly proportional to the trajectory length and inversely proportional to velocity, making a long slow trajectory hard to store in the computer flight memory. A completely different approach was then considered and the idea was to provide the FSM with the initial waypoints letting it calculate the optimal trajectory on the fly. An additional advantage of this approach was that the flight computer would be in every moment independent of a ground computer in case of a communication failure. This option moreover surpassed the processing capacity of the flight computer and made the FSM unnecessarily complex and prone to logic errors. A third approach, and the one taken on the final implementation was an intermediate solution. Given that the optimized trajectory could be defined as polynomials and that computational resources required to render third order polynomials are relatively low (4+3+2 products and 4 additions per polynomial that could be reduced to 2+3+2 products with u3 = u2 u), the trajectory in form of polynomials could be passed
2.3. THE FINITE STATE MACHINE
51
Figure 2.7: Implementation of the Hermite Interpolation block in the Efficient Hermite interpolation method for the gain scheduler on Simulink. to the FSM. This solution reduced the amount of memory required to describe a trajectory without making its implementation more complex. The Finite State Machine, implemented on Stateflow is presented on Figure 2.8 and is now formally defined. Definition of a FSM besides being important for modeling and implementation, is fundamental to having a clear account of state transitions and to know the machine working variable space. A proper formal definition is in general required for state machines to check its consistency. The FSM presented here has been tested under various conditions in simulation responding well to a number of input considerations. A detailed validation of the machine was considered out of the scope of the primary objective of this project. Still, if validation were required at some point, the existence of automated verification tools for Stateflow (Sims, Cleaveland, Butts, & Ranville, 2001; Toyn & Galloway, 2007) can greatly simplify this process. A classic finite state machine Mc is defined by the 6-tuple: Mc = hΣ, ∆, S, δ, λ, s0 i Where Σ is the set of input values, ∆ is the set of output values, S is the finite set of states, δ is the transition function δ : S × Σ → S, λ is the output function λ : S → ∆ and s0 is the initial state. The machine can be visualized as a time depended inputoutput system which alters is current state δ and produces an output λ as the current input value in Σ evolves in time (Hopcroft, Motwani, & Ullman, 2001). With this type of definition a FSM is required to be constantly excited by an external event generator to produce an output. This is however not the case for an autonomous system which should itself determine evolution of its output from current internal states (i.e. the
52
CHAPTER 2. METHOD
Figure 2.8: Finite State Machine implementation.
2.3. THE FINITE STATE MACHINE
53
overall trajectory definition does not change but the current expected position should). An extension of classic FSMs is the Discrete Event System (DEVS) definition scheme by (Zeigler et al., 2000). This definition fits more with the intended machine as not only externally initiated state changes are considered but also internally triggered state transitions. A DEVS FSM Md is a 9-tuple: Md = hΣ, ∆, S, δint, δext , λ, s0 , Γ, ta i
(2.8)
With Σ the set of input values, ∆ the set of output values, S the set of states, δint : S × Γ → S × Γ a function of internal transitions, δext : S × Γ × Σ → S × Γ a function of external transitions, λ : S × Γ × Σ → ∆ the output function triggered after entering any state, s0 the initial state, Γ the set of internal variables and ta : S → R0,∞ the time advance function. This definition can be interpreted as follows. In a given moment the system is in a certain state of S × Γ. If an external event (e.g. changing from autonomous to manual mode) does not occur the system will remain in the state s for the time defined by ta (s), s ∈ S. In this sense ta (s) can be interpreted as the time the system remains in a given state s if there are no external events. According to the DEVS formalism the value of ta (s) could vary from 0 to ∞, indicating an immediate transition for the first case or a passive state for the second. When the waiting time finishes, that is, ta (s) reaches a predefined time Ta the system produces the output λ(s, γ), γ ∈ Γ and proceeds to state δint (s, γ). If an external event σ ∈ Σ occurs before the expiration time, the system changes to state δext (s, γ, σ). This means that the external transition function determines the new state of the system when there is an external event. With this interpretation in mind, the Finite State Machine for transition management can now be defined. The FSM for autonomous control of the helicopter can be defined as Mc : Mc = hΣ, ∆, S, δint, δext , λ, s0 , Γ, ta i
(2.9)
With, Σ = {hma , pxi , n, li , thi i | ma ∈ {0, 1} , pxi ∈ P, n ∈ Z1,K , li ∈ L, thi ∈ Th } � ∆ = hxf sm , vf sm , ψ, mo i | xf sm ∈ R3 , vf sm ∈ R3vε ,vmax , ψ ∈ [−π, π] , mo ∈ {0, 1, . . . , 9} Off,Ground,Runup,Takeoff,Hover, Waypoint follow,Waypoint land, S = s|s ∈ Descent,Pilot assist Γ = {hi, l, th , u, vi | i ∈ Z1,n , l ∈ R1,max L , th ∈ R1,max Th , u ∈ [0, 1) , v ∈ Rvε ,vmax } And δ, λ and ta functions defined in the domain and ranks as in (2.8). Input values on Σ are the structure produced by the smoothing algorithm and notation corresponds exactly as it was specified on section 2.1. ma is the manual/autonomous mode flag received from the pilot and n is the cardinality of Pxi and in consequence, the cardinality of L and Th . ma is deactivated (0) by the emergency pilot of the helicopter in case this
54
CHAPTER 2. METHOD
wanted to take control of the vehicle. The subscript on the integers Z1,K indicate the subset of Z allowed, in this case n can be any integer from 1 to a finite number K. Output values in the set ∆ are the actual control system position set point xf sm , the tree dimensional velocity set point vf sm , the vehicle orientation ψ and an integer value mo that tells the gain scheduler the current operation mode. The black box diagram of the Stateflow implementation in Figure 2.9 can also clarify the input and output sets of the machine.
Figure 2.9: Finite state automaton complete inputs and outputs. Functions δ, λ are depend of each state and will be presented next. Function ta is single valued for this implementation and is defined as ta (s) = Ts , ∀s ∈ S with Ts the constant sample time defined as in section 2.1. The only source of internal transitions is then the system clock at every sample time, agreeing with the discrete time based nature of the system and complying with Stateflow’s semantics. With this in mind, the machine will wake-up every simulation step and δint will be executed. Most states update internal variables and re-enter the current state most of the time, being consistent with the during keyword in Stateflow (Mathworks, 2006c).
2.3.1
Off, Ground and Runup states
Off, Ground and Runup states are special initialization modes added to the machine to perform start-up routines prior to flight. Only the transitions of this states will be described. The Off state main goal is to reset initial the internal values of the machine. The Off state also acts as the initial state so 2.9 it is true that, s0 = Off Initial values are fundamental for initialization of the state estimation algorithm and during simulation tests. The output function defined for the Off state is,
2.3. THE FINITE STATE MACHINE
55
� � � � dpy1 (u)/du λ (Off, hi, l, th , u, vi , hma , pxi , n, li , thi i) = px1 (0) , 0, arctan ,0 dpx1 (u)/du 0 Here the arctan function produces the initial orientation from derivatives of the first polynomial. The Off state is a transitory state and is immediately followed by the transition: δint (Off, hi, l, th , u, vi) = (Ground, h1, 0, 0, 0, 0i) The Ground state is intended to perform ground actions just after the helicopter engine has been started. In future implementations this state will prepare servo actuators for flight and will also initialize and calibrate sensors. The Ground state does not change current output so the corresponding function can be defined as, λ (Ground, hi, l, th , u, vi , hma , pxi , n, li , thi i) = hxf sm , vf sm , ψ, 1i After Ground initialization is ready the following transition will take place, δint (Ground, hi, l, th , u, vi) = (Runup, hi, l, th , u, vi) Unless external pilot control is acquired producing the state change, δext (Ground, hi, l, th , u, vi , hma , pxi , n, li , thi i) = � ma = 0 (Pilot assist, hi, l, th , u, vi) (Ground, hi, l, th , u, vi) ma 6= 0 The Runup state main objective is to provide the necessary setup to allow the engine to achieve takeoff RPMs (Sanders et al., 1998). Its output function is defined as, λ (Runup, hi, l, th , u, vi , hma , pxi , n, li , thi i) = hxf sm , vf sm , ψ, 2i And this is immediately followed by the Takeoff state, δint (Runup, hi, l, th , u, vi) = (Takeoff, hi, l, th , u, vi) Unless, δext (Runup, hi, l, th , u, vi , hma , pxi , n, li , thi i) = � ma = 0 (Pilot assist, hi, l, th , u, vi) (Runup, hi, l, th , u, vi) ma 6= 0
56
2.3.2
CHAPTER 2. METHOD
Takeoff state
The Takeoff state main purpose is to lift the helicopter to a predefined flight altitude slowly transitioning from zero to takeoff velocity and then back to zero. Takeoff is the first state to actually produce a trajectory and to determine the control system input at every sample time. Trajectory generation on Takeoff produces values on the z axis while smoothly changing velocity as specified by the smoothing algorithm. The position described by pz1 (u) and velocity described by pv1 (u) are then rendered. Knowing already how pz1 and pv1 are created the next question is how the u parameter is used. From traditional definition of position and velocity functions one might expect that time is the independent variable on pz1 and pv1 , and in consequence that u is directly related to time progression. From the spline definition u is always on the interval [0, 1) so the mapping u = t/ti could be employed. The smooth velocity function pv1 is however expected to describe the velocity changing from zero on ground to a maximum and them back to zero once the takeoff maneuver is completed. If the position was described by pz1 (t/ti ) that will immediately 0 imply that velocity would be v1 (t) = pz1 (t/ti ) making pv1 useless and not following the expected velocities. This also will apply for the two dimensional case on the curve hpxi (u) , pyi (u)i, where the velocity will necessarily be, vi (t) =
dli (t/ti ) dli (u) du = du dt dt
With li the length integral of Eq. (2.4). For this reason the u parameter in the spline polynomial pxi (u) cannot relate to time and another way to relate position and velocity needs to be found. If velocity is expected to be restrained at the waypoints, a value u0 should determine both position hpxi (u0 ) , pyi (u0 )i and velocity pv (u0 ) at the same moment. The unifying term is arc length l. Arc length is nicely related to velocity with the equation, Z u
l (u) =
pvi (ω) dω 0
So u can be easily mapped from u = l/li with l a variable that takes a value in [0, li ) for segment i. As distance progresses in the curve the position and orientation can be obtained from hpxi (l/li ) , pyi (l/li )i. Variable l can be visualized as a progress meter of the position and velocity splines. However, finding the current velocity pvi (u) requires u that at the same time requires l and l requires pvi (u) to be found. This can be solved with an iterative scheme so, in the discrete case, l (uk+1 ) = l (uk ) + Ts pv (uk ) with, l (uk+1 ) li and knowing that always pv > 0. This method was used for traversing position on the Takeoff and Waypoint follow states. uk+1 =
2.3. THE FINITE STATE MACHINE
57
Figure 2.10: Implementation of the Takeoff maneuver on Stateflow. The output function for the Takeoff state can then be defined as,
λ (Takeoff, hi, l, th , u, vi , hma , pxi , n, li , thi i) = hxtakeof f (l, u, i) , vtakeof f (u, i) , ψ, 3i With functions xtakeof f , vtakeof f defined as, � xtakeof f (l, u, i) = pxi
l + Ts pvi (u) li
�
vtakeof f (u, i) = h0, 0, −pvi (u)i Note that every time the state is reentered λ is recalled and the trajectory is produced until the condition u ≥ 1 is meet and the δint function exits the state. For takeoff pxi is defined by the smoothing algorithm as a z only trajectory and x, y remain constant. ψ remains constant too during the takeoff. Internal states on Takeoff are updated with the function, δint (Takeoff, hi, l, th , u, vi) = D E� ( � l+Ts pv (u) Takeoff, i, l + Ts pv (u) , th , , pv (u) li (Hover, hi + 1, l, th , 0, vi)
u<1 u≥1
Unless the external event occurs and δext is called,
δext (Takeoff, hi, l, th , u, vi , hma , pxi , n, li , thi i) = � (Pilot assist, hi, l, th , u, vi) ma = 0 (Takeoff , hi, l, th , u, vi) ma 6= 0 Implementation of the takeoff program in Stateflow is presented on Figures 2.8 and 2.10.
58
CHAPTER 2. METHOD
2.3.3
Hover state
Every time the Hover state is entered or re-entered the output produced is determined by, λ (Hover, hi, l, th , u, vi , hma , pxi , n, li , thi i) = hpxi (0) , 0, ψ, 4i Notice that during hover xf sm and ψ remain constant and vf sm remains zero. Internal states are updated so hovering expected time is counted until the hover time is reached, δint (Hover, hi, l, th , u, vi) = � (Hover, hi, l, th + Ts , u, 0i) (Waypoint follow, hi + 1, l, 0, u, 0i)
th < thi th ≥ thi
Unless, δext (Hover, hi, l, th , u, vi , hma , pxi , n, li , thi i) = � (Pilot assist, hi, l, th , u, vi) ma = 0 (Hover, hi, l, th , u, vi) ma 6= 0
2.3.4
Waypoint follow state
The Waypoint follow state progression is similar to the Takeoff state. The main difference is that xf sm remains constant in z and changes in x, y. Also vf sm remains zero in vz and changes in vx , vy and ψ remains tangential to the trajectory. Each time the state is entered or ta expires output of Waypoint follow is determined by, λ (Waypoint follow, hi, l, th , u, vi , hma , pxi , n, li , thi i) = hxf lw (i, l, u) , vf lw (i, u, ψf lw (i, u)) , ψf lw (i, u) , 5i With functions xf lw , vf lw , ψf lw defined as, xf lw (i, l, u) = pxi (unew ) vf lw (i, u, ψf ) = hpvi (u) cos (ψf ) , pvi (u) sin (ψf ) , 0i � ψf lw (i, u) = arctan
pyi (unew ) − pyi (u) pxi (unew ) − pxi (u)
�
l + Ts pvi (u) li After every wake up call internal states are then updated with the following conditions, unew =
2.3. THE FINITE STATE MACHINE
59
Figure 2.11: Implementation of the Waypoint follow main trajectory production algorithm in Stateflow.
δint (Waypoint follow, hi, l, th , u, vi) = (Hover, hi + 1, l, th , 0, vi) u ≥ 1 − Tlsiv ∧ v ≤ vε ∧ i 6= n (End, hi + 1, l, th , 0, vi) u ≥ 1 − Tlsiv ∧ v > vε ∧ i = n (Waypoint follow, hi + 1, l, th , 0, vi) u ≥ 1 − Tlsiv ∧ v > vε ∧ i 6= n � � Waypoint follow, u < 1 − Tlsiv hi, l + Ts pvi (u) , th , unew , pvi (u)i Note the term 1 − Tlsiv is extremely important for discontinuities at the end of the polynomial because it prevents u leaving the interval [0, 1). Implementation of this state main rendering algorithm is presented in Figures 2.8 and 2.11.The Waypoint follow state can be interrupted if, δext (Hover, hi, l, th , u, vi , hma , pxi , n, li , thi i) = � (Pilot assist, hi, l, th , u, vi) ma = 0 (Hover, hi, l, th , u, vi) ma 6= 0
2.3.5
Pilot assist, Waypoint land, Descent and End states
The Pilot assist, Waypoint land and Descent states were added to the machine with the purpose of providing future functionality but are still not required and are empty states. The main function of the Pilot assist mode will be to include additional logic to the assisted flight mode transition. Most requirements for this transition are now implemented on the control system PIDs as bump-less transfer controllers. The helicopter autonomous landing process has not been specified but a Waypoint land mode
60
CHAPTER 2. METHOD
will be required to perform any required action before landing, such as being guided by an independent sensor. The same is true for the Descent state. The End state indicates end of the trajectory and was added for simulation purposes only.
Chapter 3 Results 3.1
Experimental Results
The methods proposed were implemented and tested to verify its behavior in simulated flight. The main goal of the simulation tests was to check if the trajectory generated and the finite state machine performed as expected and the control error was reduced. Reduction of the control error implies reduction of transients and control effort during flight. Simulation test provide a measure of the benefits of the control strategy over simpler or computationally less expensive control systems. To test effectiveness of the overall system various trajectories were assigned to the system and multidimensional error comparisons across length, shape and velocity were made. Non smoothed versions of the trajectory position and velocity were compared with smoothed positions and semi-smoothed and smoothed velocity schedules. All trajectories included mode transitions from takeoff to hover, hover to forward flight and in some cases forward flight to hover. A test focused on the gain scheduler performance was also effectuated to identify its advantages over non scheduled schemes. In all tests, a wind perturbation of 1 m/s and random direction was used. Overall, experimentation showed a major benefit from using the proposed smoothing method and the FSM implementation worked as expected, handling well changes at the trajectory knots. Control error, and specially attitude control error, was reduced on the smoothed trajectories. An important conclusion of experimental tests was that simpler velocity transitions (not smooth but just linearly progressive) resulted in the less error in simulation. Other observations will be presented as the chapter progresses. A set of results, not experimental, but related to implementation will also be presented as they are considered important outcomes of this work and substantial contributions to the Colibri project. Those are a mission planner and a real time implementation of the complete system. At the end of the chapter conclusions are presented and future work is proposed. Figure 3.1 compares the system response to a non smooth and smooth velocity transitions. 61
62
CHAPTER 3. RESULTS
Figure 3.1: System response to a non smooth vs. a smooth velocity transition in meters per second.
Figure 3.2: An 85 meters linear trajectory to determine baseline error.
3.1. EXPERIMENTAL RESULTS
63
Figure 3.3: Ramp-like velocity transition in meters per second.
3.1.1
Linear Trajectory and Baseline Error
A basic initial test involving takeoff, a short hover and a simple constant speed linear trajectory was simulated to obtain an estimate of the baseline average control error (Figure 3.2). The baseline error is always present and can be attributed to PID control deficiencies. A constant velocity linear trajectory was conceived as a good measure of base error as it does not include any trajectory smoothing and just one velocity change (from zero to a constant speed value). The same simulation was executed for three different velocities (1, 3 and 5 m/s) and five smoothing configurations. The current control system implementation is not intended for velocities over 5 m/s (18 km/h). The five configurations were: (1) a non smooth trajectory and a non smooth velocity (nn) schedule; (2) a non smooth trajectory and a ramp-like velocity (nr) schedule; (3) a smooth trajectory and a non smooth velocity (sn) schedule; (4) a smooth trajectory and a ramp-like velocity (sr) schedule; and (5) a smooth trajectory and a smooth velocity (ss) schedule. The so called “non smooth trajectory” is simply a trajectory formed by lines connecting the waypoints with no smoothing applied. In a non smooth velocity schedule, once the vehicle reaches a waypoint the control system velocity reference is changed immediately just as in Figure 2.3. A ramp like velocity establishes velocity changes that progress from one velocity value to another in a ramp as in Figure 3.3. Even though the resulting x, y trajectory for all cases in this test was a line, the different configurations (nn,nr,sn,sr,ss) were used to have an indication of the overhead imposed by the smoothing method on the trajectory rendering. During the experiment, the trajectory, velocity and attitude values produced by the FSM (xf sm ) and the state of the helicopter simulation model were recorded to obtain the average error Ex as presented on Eq. (1.2). Note that values of roll and pitch are actually generated by the PID control as a function of the expected x, y, vx , vy , while yaw is directly established by the FSM. The control system commands δcol , δlon , δlat , δped were also logged and their standard deviation and absolute maximum were obtained as an indicator of control effort. The Kalman filter was disabled for this and subsequent tests to limit extrinsic effects. Handling estimation error is not the main focus of attention of the trajectory generator but are its effects on the control system and helicopter.
64
CHAPTER 3. RESULTS
Figure 3.4: Linear trajectory average error Ex on different smoothness configurations (nn,nr,sn,sr,ss) and velocities (1,3,5 m/s) for position (x, y, x), attitude (φ, θ, ψ) and velocity (vx , vy , vz )
3.1. EXPERIMENTAL RESULTS
65
Figure 3.5: Linear trajectory control output standard deviation (σ) and absolute maximum values for each vehicle input (δcol , δlon , δlat , δped ). Figure 3.4 presents the average error obtained in the test for different velocities. For further comparison and as baseline error for the rest of experiments, the average error for the best (sr at 1m/s) and worst (nn at 5m/s) configuration was added as a shadowed area on all graphics. A value on the first row of graphics of Figure 3.4 indicates the average positional error and can be interpreted as “during the entire trajectory, on average the helicopter was E meters away from its intended position”. The same applies for the second and third rows of graphics changing meters for degrees or meters per second and position for attitude or velocity. Results of Figure 3.4 show how increasing velocity affects control error. This effect was expected, as faster dynamics make harder for to the control system to maintain stable flight. Lower errors are obtained in ramp-like velocity changes (recall the only change performed in this case is from zero to 1, 3 or 5 m/s at the beginning of flight). Results from the non-smooth trajectory/ramp velocity (nr) and smooth trajectory/rampvelocity (sr) could be expected to be the same as not trajectory smoothing is necessary. That is however not the case and non smooth trajectories present lower errors in this case (i.e. x, y, vx , vy ). Comparing both trajectories, this effect was found to be caused by the behavior of the smoothing algorithm on the first segment of the trajectory. Note that although the trajectory hpxi (u) , pyi (u)i could parametrically produce a line, it does not imply that alone pxi and pyi are lines. Producing the � � initial section on the Catmull-Rom algorithm requires the vector x1 x1 x2 x3 , so a proper tangent is not used but an approximate producing a small curvature on the first segment. As will be seen in other trajectories this difference is minimal compared to the benefits on trajectory smoothing in curved paths. Figure 3.5 displays the control system output standard deviation and absolute maximums. δ values are restricted to the interval [−1, 1] and their maximum absolute
66
CHAPTER 3. RESULTS
Figure 3.6: Rectangular trajectory average error Ex on different smoothness configurations (nn,nr,sn,sr,ss) and lengths (10x10,30x30,50x50 m) for position (x, y, x), attitude (φ, θ, ψ) and velocity (vx , vy , vz ) value was used for this graphics. Larger deviations at the control system output represent more effort maintaining the reference value. Again, higher velocities represented significantly larger effort and more extreme control values on the actuators. In this experiment the smallest variations on δlat are due to the trajectory (a line). Transition management and progressive velocity changes already show some benefits on this case but still, their full capacity will be more clear with other types of trajectories. Similarly to the plot of average error Ex , a gray shaded area is used here to show the average lower (sr, 1 m/s) and higher results (nn, 5 m/s).
3.1.2
Rectangular and Circular Trajectories
Regular trajectories with obtuse and right angles were used to measure benefits of trajectory smoothing on mild to sharp direction changes. Velocity increments and decrements were also considered. For the rectangular trajectories, squares of side 10, 30 and 50 m with velocities 0, 1, 2, 1 m/s at the vertices were used. On the circular trajectories, 12 points chosen on a circle with velocities ranging from 0 to 3.5 m/s and
3.1. EXPERIMENTAL RESULTS
67
Figure 3.7: Rectangular trajectory smoothed. Axis are in meters.
Figure 3.8: Rectangular trajectory control standard deviation (σ) and absolute maximum values for each vehicle input (δcol , δlon , δlat , δped ).
68
CHAPTER 3. RESULTS
Figure 3.9: 10 meters circular trajectory on the non smooth and smooth cases.
Figure 3.10: 30 meters circular trajectory section on the non smooth and smooth cases. from 3.5 to 0 m/s were assigned at the joints. Three of this trajectories were generated for circles with radius 10, 30 and 50 m and the results cross compared. Figure 3.6 presents the average control error for each state variable at the rectangular trajectories. The shaded area and configurations (nn,nr,sn,sr,ss) are as specified in section 3.1.1. The smoothed trajectory is presented on Figure 3.7. For all cases the larger the trajectory the less the average error. Larger trajectories allow more space for velocity transitions and in consequence, the control system finds it easier to conserve the reference value. Ramp-like velocity changes again demonstrate lower positional and velocity errors than the smooth and non smooth transitions. Smooth trajectories however reduce attitude error in all instances. Non smooth trajectories cause large yaw errors of 10-20 degrees even on progressive velocity changes. This can be attributed to abrupt direction changes. The control effort plots are presented on Figure 3.8 and show again larger variations and impulses on the non smooth trajectories and velocities (nn,nr,sn).
3.1. EXPERIMENTAL RESULTS
69
Figure 3.11: 50 meters circular trajectory on the non smooth and smooth cases.
Figure 3.12: 50 meters circular trajectory schedule for the ramp-like (sr) and smooth velocity (ss) cases.
70
CHAPTER 3. RESULTS
Figures 3.9, 3.10 and 3.11 compare the rendered and simulation trajectories for circles of radius 10, 30 and 50 meters. Figure 3.12 shows the corresponding schedules for the smooth configurations (sr, ss). It can be observed how the control system tries to preserve a smooth trajectory on the duodecagon1 edges for the non smoothed trajectory (nn), but still fails to meet many of the trajectory waypoints compared with the smooth case for 30 and 50 meters. For the 10 meters circle it is hard, even on the smooth trajectories to reach each waypoint. These effects are reflected on the error measure of Figure 3.13. An important effect observed in Figure 3.13 is the importance of not just positional smoothing but also its combination with progressive velocity changes. This is observed in the case where a smooth trajectory is not enough (sn) to alleviate the 0.5 m/s velocity changes (See Figure 3.12). Control system deviation and maximum impulse show reduced control effort on all the smooth trajectories (sn,sr,ss) with exception of longitudinal control δlon , which is directly related with the pitch setting and in consequence forward velocity.
3.1.3
Real World Trajectories and Time Estimation
A simple trajectory with no major velocity changes and a complex trajectory with several hover waypoints and large velocity transitions were tested in simulation. Errors for the same five configurations: non-smooth trajectory/non-smooth velocity (nn), nonsmooth trajectory/ramp velocity (nr), smooth trajectory/non-smooth velocity (sn), smooth trajectory/ramp velocity (sr) and smooth trajectory/smooth velocity (ss) were measured in both cases. Figure 3.15 and 3.16 display the two trajectories. On the simple trajectory, only changes from 0 to 1 m/s were made while in the complex, hover points and changes from 0 to 4 m/s and 4 to 0 m/s were performed. On the position and velocity x, y error no major benefits were found due to smoothness of the trajectory and the error remained within 6 - 7 centimeters (Figure 3.17). This can be attributed to the low velocity changes and considerable length of each segment (10 to 15 m). Attitude error however was largely decreased by a smooth trajectory, and the same is true for the control system output (Figure 3.18). Positional and velocity errors for the complex trajectory test show a larger influence of the ramp-like velocity changes on decreasing errors (Figure 3.19). Smoother trajectories and smoother velocities do not show lower positional or axial velocity errors when compared to non smooth trajectories. This shows that smooth velocities and trajectories may be in some cases detrimental to positional error. Notice the x error for (sr) is in this case around 8-9 cm. In general, results on Figure 3.19 for x, y, vx , vy show larger benefits from ramp-like velocity changes. Attitude errors and control effort (Figure 3.20) are smaller for the smooth trajectories and velocities. Accuracy in time estimation is extremely important for flight planning due to fuel and battery constrains as specified in section 2.2.3. A good estimation of traversal time might save the vehicle from crashing in the middle of a planned trajectory. Figure 1
A polygon with twelve sides and 150◦ inner angles.
3.1. EXPERIMENTAL RESULTS
71
Figure 3.13: Circular trajectory average error Ex on different smoothness configurations (nn,nr,sn,sr,ss) and radii (10, 30, 50 m) for position (x, y, x), attitude (φ, θ, ψ) and velocity (vx , vy , vz )
72
CHAPTER 3. RESULTS
Figure 3.14: Circular trajectory control standard deviation (σ) and absolute maximum values for each vehicle input (δcol , δlon , δlat , δped ).
Figure 3.15: A simple trajectory at low speed and no major velocity changes. Axis are in meters.
3.1. EXPERIMENTAL RESULTS
73
Figure 3.16: A complex trajectory with hover points (∗). Axis are in meters.
Figure 3.17: A simple trajectory average error Ex on different smoothness configurations (nn,nr,sn,sr,ss) for position (x, y, x), attitude (φ, θ, ψ) and velocity (vx , vy , vz )
74
CHAPTER 3. RESULTS
Figure 3.18: Simple trajectory control standard deviation (σ) and absolute maximum for each vehicle input in various smoothness configurations. 3.21 compares estimated versus final simulation time for both trajectories. The parallelogram integration method was used to calculate Eq. (2.7) and the simulation time was recorded on each case. Time estimation was in general very accurate for smooth velocities and the error was always within 1 to 2 seconds. As it can be seen on Figure 3.21 traversal time of trajectories with ramp velocity changes (nr,sr) is larger due to lower accelerations.
3.1.4
Gain Scheduler Effects
Effects of the gain scheduler (GS) on the overall error were found to be small and are presented in this section. Figure 3.22 presents the effects of the GS in one of the parameters of the lateral PID control during a takeoff-hover-forward maneuver. Testing the effects of the gain schedule required a trajectory including several mode changes (Figure 3.23 presents the trajectory used). Figures 3.24 and 3.25 present a close up on errors for the configurations of interest (sr,ss) with GS disabled and enabled. With GS disabled, control parameters are switched immediately. Although differences are minimal in simulation, a GS will be desirable in a real flight implementation of the control system.
3.2
Real-Time Execution Tests
To verify applicability of the methods proposed in a real world implementation, the control system was translated to C code with an automated code generation tool (Mathworks, 2006b) and ran on a 300Mhz flight computer using a real time operating system (QNX Software Systems, 2008). Figure 3.26 presents the computer tasks and
3.2. REAL-TIME EXECUTION TESTS
75
Figure 3.19: A complex trajectory average error Ex on different smoothness configurations (nn,nr,sn,sr,ss) for position (x, y, x), attitude (φ, θ, ψ) and velocity (vx , vy , vz )
76
CHAPTER 3. RESULTS
Figure 3.20: Complex trajectory control standard deviation (σ) and absolute maximum for each vehicle input in various smoothness configurations.
Figure 3.21: Expected time compared to average time on the simple and complex trajectories.
Figure 3.22: Lateral control Ti scheduled gain.
3.2. REAL-TIME EXECUTION TESTS
77
Figure 3.23: Gain scheduler test with a random trajectory. (∗) are hover waypoints, (#) are 1 m/s waypoints.
Figure 3.24: Gain scheduler average error Ex results for the trajectory of Figure 3.23.
78
CHAPTER 3. RESULTS
Figure 3.25: Gain Scheduler test with a random trajectory. CPU usage during the test. Individual tests showed that the CPU usage of the finite state machine and control system never surpassed 1% usage of CPU at sample rates of Ts = 0.02 sec. The rest of the system time was occupied by the Kalman filter process (colibri air, 17%) and communication threads (devc-ser8250, 50%), leaving more than 30% of the processor free.
3.3
The Mission Planner
As part of this work, a computer application for trajectory planning was developed on Matlab. The so called Mission Planner (Figure 3.27) allows the mission operator to select a series of points on a geographically adjusted map and modify the hover time and velocity properties of each knot. The trajectory planner also has the function of telling the operator, properties of the trajectory and predefined limitations of the vehicle, such as maximum velocity and time. When any of this limits is exceeded the user is notified as shown in Figure 3.28. Appendix A contains the main functions implemented for this application.
3.4
Conclusions and Future Work
A method to smooth the planned trajectory an manage mode transitions for a small autonomous helicopter was presented. The smoothing methods based on spline curves for integrated position and velocity were mathematically described and combined with a finite state machine able to render the trajectory in real time and to determine the position of the vehicle. The proposed methods were taken beyond definition and were implemented on a rapid prototyping and simulation environment able to translate them to real avionics hardware. To further support the claim that the proposed methods were significantly better than a simpler and computationally cheaper control system,
3.4. CONCLUSIONS AND FUTURE WORK
79
Figure 3.26: CPU usage of the FSM, Control System and Kalman Filter generating a trajectory on the flight computer. The QNX command hogs -n was used.
Figure 3.27: The Mission Planner user interface.
80
CHAPTER 3. RESULTS
Figure 3.28: The Mission Planner displaying a time exceeded alert. several test were effectuated. Experimental results showed that the smoothing methods proposed alleviate transients, reducing control error and effort in simulation with the vehicle model. Numerical methods intended to extract length and time properties of the trajectory were proposed and showed good accuracy, estimating properties of polynomial functions non solvable analytically. The Gauss-Legendre method was successfully applied to obtain length of two dimensional Catmull-Rom curves, showing accuracy on the order of millimeters. The same method was also found to be inaccurate for time calculation with the combined smoothed velocity and position schedule. A numerical-recursive method able to combine a parametric smooth trajectory with a velocity function was proposed and formally defined for a finite state machine. The method was useful to describe the trajectory in real time and minimized computer memory usage. A simplified spline interpolation method, based on Hermite curves, was proposed to smooth a 24-dimensional schedule of controller parameters. Experiments showed that a smooth trajectory combined with progressive linear velocity changes are able to reduce control effort (at the cost of larger traversal times). This result also applies to trajectories with small direction changes where linear velocity changes are beneficial. Reduced error in first order velocity schedules compared to smooth third order velocities can be attributed to resulting zero order accelerations. To further reduce errors imposed at the joints of ramp velocities and reduce traversal time, the velocity transition curve of Figure 3.29 is proposed. Compared to Catmull-Rom smoothed velocity, which has a slow start and overshot at the end, the ideal velocity shape is almost lineal, grows faster (reducing traversal time) and has no overshot. Such trajectory might be described by Hermite curves with chosen tangents. An important issue will be to automate the process of choosing the right tangents. Simulation tests showed that smooth trajectories tend to improve vehicle attitude and control more than smooth velocities. At the same time, progressive velocities decrease positional error. Due to helicopter dynamics, attitude error tends to be less acceptable than positional error, making smooth trajectories a priority. Additional
3.4. CONCLUSIONS AND FUTURE WORK
81
Figure 3.29: Actual smooth velocity schedule compared to the ideal velocity schedule shape. observations from the experimental tests are that larger trajectory segments decrease overall error while larger velocities worsen it. These considerations might be taken by the trajectory designer to minimize error or could be added as heuristics in the Mission Planner. The PID based control system used for the tests demonstrated robustness for various operating modes and trajectory configurations. Exploring better forms to produce the first segment of the Catmull-Rom algorithm are suggested. The current algorithm repeats the first element on the vector � � x1 x1 x2 x3 creating an approximated tangent in the first point. Extrapolation methods could be used to generate x−1 . Implementing an algorithm to choose the tangents of the ideal velocity shape (Figure 3.29) could further reduce the errors obtained in the smooth trajectory and ramp-like velocity configuration. The problem might look simple for simple velocity transitions but becomes more interesting when successive velocity increases and decreases are required. Formal definition of the finite state machine offers an important source of research subjects to explore more deeply its properties and forms of validation. Description of the position and velocity within the proposed methods lefts open the question if the three polynomials describing them could be compacted in two polynomials describing position and velocity at the same time, simplifying the FSM description. Information from the trajectory and results of this work could be used to improve the Mission Planner and produce safer missions. Time, shape and trajectory length could be combined with vehicle information to hint the mission operator with better schedules. Velocity and length could be used to calculate accelerations before flight and warn the operator of
82 dangerous situations.
CHAPTER 3. RESULTS
Chapter 4 References Astrom, K. J., & Wittenmark, B. (1995). Adaptive control. Addison-Wesley. Bartels, R. H., Beatty, J. C., & Barsky, B. A. (1987). An introduction to splines for use in computer graphics & geometric modeling. Morgan Kaufmann. Branicky, M., Borkar, V., & Mitter, S. (1998). A unified framework for hybrid control: Model and optimal control theory. IEEE Trans. Automatic Control , 32 , 31–45. Brockett, R. (1993, July). Hybrid models for motion control systems. In H. L. Ttentleman & J. C. Willems (Eds.), Essays on control: Perspectives in the theory and its applications (pp. 29–54). Birkhauser. Catmull, E. E., & Rom, R. J. (1974). Computer aided geometric design. In R. E. Barnhill & R. F. Riesenfeld (Eds.), (p. 317-326). Academic Press. Coleman, D., Creel, D., & Drinka, D. (2002). Implementation of an autonomous aerial reconnaissance system entry for the international aerial robotics competition (Tech. Rep.). University of Texas Austin. De Boor, C. (1978). A practical guide to splines. Springer. Doherty, P., Haslum, P., Heintz, F., Merz, T., Nyblom, P., Persson, T., et al. (2004). A distributed architecture for autonomous unmanned aerial vehicle experimentation. In 7th international symposium on distributed autonomous robotic systems. Gavrilets, V. (2003). Autonomous aerobatic maneuvering of miniature helicopters. Unpublished doctoral dissertation, Massachusetts Institute of Technology. Geyer, M., & Johnson, E. (2006). 3d obstacle avoidance in adversarial environments for unmanned aerial vehicles. In Proceedings of the AIAA guidance, navigation, and control conference. Guenter, B., & Parent, R. (1990). Motion control: Computing the arc length of parametric curves. IEEE Computer Graphics and Applications, 10 (3), 72-78. Guler, M., Clements, S., Wills, L., Heck, B., & Vachtsevanos, G. G. (2001, June). Generic transition management for reconfigurable hybrid control systems. In Proceedings of the 20th american control conference. Arlington, VA. Harbick, K., Montgomery, J., & Sukhatme, G. (2004). Planar spline trajectory following for an autonomous helicopter. Journal of Advanced Computational Intelligence Computational Intelligence in Robotics and Automation, 8 (3), 237–242. Harel, D. (1987). Statecharts: A visual formalism for complex systems. Science of 83
84
CHAPTER 4. REFERENCES
Computer Programming, 8 , 231–274. Hopcroft, J. E., Motwani, R., & Ullman, J. D. (2001). Introduction to automata theory, languages, and computation, 2nd edition. New York, NY, USA: Addison-Wesley. Koo, T., Hoffmann, F., Shim, H., Sinopoli, B., & Sastry, S. (1999, Octuber). Hybrid control of model helicopter. In IFAC workshop on motion control (pp. 285–290.). Grenoble, France. Koo, T., Sinopoli, B., Sangiovanni-Vicentelli, A., & Sastry, S. (1999, August). A formal approach to reactive system design: Unmanned aerial vehicle flight management system design example. In Proceedings of the IEEE international symposium on computer-aided control system design. Kohala Coast, Hawaii. Ledin, J. (2002, April). Simulation takes off with hardware. Embedded Systems Design Magazine. Liu, X., Liu, J., Eker, J., & Lee, E. A. (2003). Heterogeneous modeling and design of control systems. In T. Samad & G. Balas (Eds.), Software-enabled control: Information technology for dynamical systems. New York City: IEEE Press. Mathews, J. H., & Fink, K. D. (2004). Numerical methods using matlab (4th ed.). NJ USA: Perentice Hall. Mathworks. (2006a). Matlab Ver. 7.3. Software Package. (Natick, Massachusetts) Mathworks. (2006b). Real-time workshop user’s guide [Computer software manual]. Mathworks. (2006c). Stateflow and stateflow coder, user’s guide [Computer software manual]. Mathworks. (2006d). Stateflow Ver. 6.5. Software Package. (Natick, Massachusetts) Menon, P. K. A., & Kim, E. (1990). Optimal helicopter trajectory planning for terrain following flight (Tech. Rep.). NASA Contractor Report. Mettler, B. (2003). Identification modeling and characteristics of miniature rotorcraft. Kluwer Academic Publishers. Miniature Aircraft USA. (1999). X-Cell .60 graphite SE Helicopter Kit (Special Edition). Manual. Orlando, Florida. QNX Software Systems. (2008). QNX momentics development suite [Computer software manual]. Richards, A. G. (2002). Trajectory optimization using mixed-integer linear programming. Unpublished master’s thesis, MIT. Rogers, R. M. (2000). Applied mathematics in integrated navigation systems. Reston, VA: AIAA Education Series. Sanders, C. P., DeBitetto, P. A., Feron, E., Vuong, H. F., & Leveson, N. (1998, December). Hierarchical control of small autonomous helicopters. In Proceedings of the 37th IEEE conference on decision and control (Vol. 4, pp. 3629–34). Tampa, FL. Saripalli, S., Sukhatme, G., & Montgomery, J. (2002). An experimental study of the autonomous helicopter landing problem. In Proceedings, international symposium on experimental robotics. Sant’Angelo d’Ischia, Italy. Schrage, D., & Vachtsevanos, G. (1999, August). Software-enabled control for intelligent UAV’s. In Proc. 1999 int. conference on control applications. Hawaii. Sims, S., Cleaveland, R., Butts, K., & Ranville, S. (2001). Automated validation of
85 software models. In 16th IEEE international conference on automated software engineering (p. 91). Los Alamitos, CA, USA: IEEE Computer Society. Stone, R. (2004). Control architecture for a tail-sitter unmanned air vehicle. In 5th asian control conference (pp. 736–744). Toyn, I., & Galloway, A. (2007). Formal validation of hierarchical state machines against expectations. In 2007 australian software engineering conference (p. 181190). Los Alamitos, CA, USA: IEEE Computer Society. Velez, C. M. (2007). Rapid software prototyping environment for development of an autonomous mini-helicopter robot - Colibri (Ver 3.1.12 ed.) [Computer software manual]. Medellin, Colombia. Velez, C. M., & Agudelo, A. (2005). Multirate control of an unmanned aerial vehicle. WSEAS Transactions on Circuits and Systems, 4 , 1628-1634. Velez, C. M., & Agudelo, A. (2006, July). Rapid software prototyping for real-time simulation and control of a mini-helicopter robot. In 10th WSEAS International Conference on Systems (p. 289-295). Athens, Greece. Velez, C. M., Agudelo, A., & Alvarez, J. (2006). Modeling, simulation and rapid prototyping of an unmanned mini- helicopter. In AIAA modeling and simulation technologies conference and exhibit conference proceedings. Keystone, Colorado, USA. Wagtendonk, W. J. (1996). Principles of helicopter flight. Aviation Supplies & Academics, Inc. Weisstein, E. W. (2002). Spline. From MathWorld–A Wolfram Web Resource. http://mathworld.wolfram.com/Spline.html. Zeigler, B. P., Praehofer, K., & Kim, T. (2000). Theory of modeling and simulation 2nd ed. Academic Press.
86
CHAPTER 4. REFERENCES
Appendix A Source Code A.1
Matlab Trajectory Smoothing
function [px_i py_i pz_i pv_i INI l_i t_h_i epsilon t_i] = ... smooth_trajectory(X,VT,INI_Z) %SMOOTH_TRAJECTORY Prepares a trajectory defined by position and velocity % waypoints to be rendered by the Colibri Finite State Automaton. % Polynimials are described using the standard Matlab notation. % % Input parameters: % X is the set of threedimensional waypoints in an n-by-3 array. % VT is the set of velocity and hover time waypoints in an n-by-2 array. % INI_Z is the initial height of the helicopter. % % Output values: % px_i,py_i,pz_i are the resulting smooth third order polynomials % coefficients in an n-by-4 array % pv_i is the velocity polynomial % INI is are the six initial conditions for [x,y,z,roll,pitch,yaw] % l_i has the lenght of every 3D polynomial on px_i,py_i,pz_i % t_h_i has the hover times extracted from VT after zeros are removed for % a more compact array % epsilon is the minimum velocity value % t_i are the times required to traverse every segment of the trajectory % % For more information on this file see Andres Agudelo’s Master Thesis % Author: Andres Agudelo %Definitions epsilon = 0.01; minus_v = -10; %Do some checking on the VT array if min(VT)<0 error(’Malformed velocity array. Should be positive.’); end if VT(1,1) > epsilon error(’Malformed velocity array. Should start in zero’);
87
88
APPENDIX A. SOURCE CODE
end n = size(VT,1); %Save hover times t_h_i = []; i_h = 1; %Hover times index for i = 1:n if VT(i,1) <= epsilon t_h_i(i_h,1) = VT(i,2); %Hover time i_h = i_h+1; end end %Stateflow presents errors if ht_i is only 1x1, add a trail t_h_i = [t_h_i; -1]; %Get size of VT n = size(VT,1); %Replace zeros with epsilons and avoid singularities with velocity %polynomials for i = 1:n %If hover replace zero speed with epsilon if VT(i,1) <= epsilon VT(i,:) = [epsilon VT(i,2)]; end end %Repeat first and last points to comply with Catmull-Rom algorithm Xext = [X(1,:); X ;X(end,:)]; VText = [VT(1,:); VT ;VT(end,:)]; %Test other initial points %VText(1,:) = [-10 5]; %Get polynomials (pxy(i)) from the non smooth 2D trajectory on Xext %omitting Z [Pxy n] = catmullrompoly(Xext(:,1:2)); %Get velocity polinomials but have special considerations %for pre- and post-hover segments Pv = zeros(4,n); for i=1:n if VText(i+1) <= epsilon %Previous wp was hover Pv(:,i) = catmullrompoly([minus_v;VText(i+1:i+3,1)]); elseif VText(i+2) <= epsilon %Next wp is hover Pv(:,i) = catmullrompoly([VText(i:i+2,1);minus_v]); else %Nothing to worry about Pv(:,i) = catmullrompoly(VText(i:i+3,1)); end end
A.1. MATLAB TRAJECTORY SMOOTHING %Calculate lenghts for every segment l_i = zeros(n,1); for i=1:n l_i(i) = catmullromlen(Pxy(:,1,i),Pxy(:,2,i)); %Use Gauss-Legendre 2D end %Calculate times for every segment t_i = zeros(n,1); for i = 1:n t_i(i) = catmullromtimet(Pv(:,i)’,l_i(i)); %Displacement time end %Extract list of polynomials for x and y px_i = zeros(n,4); py_i = zeros(n,4); pv_i = zeros(n,4); for i=1:n px_i(i,:) = Pxy(:,1,i); py_i(i,:) = Pxy(:,2,i); pv_i(i,:) = Pv(:,i)’; end %Use the polynomial after takeoff to aproximate initial yaw dx_INI = polyval(px_i(1,:),0.1)-polyval(px_i(1,:),0); dy_INI = polyval(py_i(1,:),0.1)-polyval(py_i(1,:),0); yaw = atan2(dy_INI,dx_INI); %Generate initial conditions INI = [X(1,1),X(1,2),INI_Z,0,0,yaw]; %Next Z and takeoff code is temporal. %Should be changed if Z smoothing is implemented %Add constant polynomials to indicate take off position px_i = [[0 0 0 INI(1)];px_i]; py_i = [[0 0 0 INI(2)];py_i]; n = size(px_i,1); h = X(1,3); %Get height for fist waypoint, will be kept constant %Create the Z polynomial, increasing only during takeoff and then %remaining constant pz_i = zeros(n,4); %Takeoff is a rect line pz_i(1,:) = [0 0 (h - INI(3)) INI(3)]; %The rest is constant pz_i(2:n,4) = h; %Create a smooth takeoff velocity poly %(Max takeoff speed is 0.13 m/s^2) Pv = catmullrompoly([-1;epsilon;epsilon;-1]);
89
90
APPENDIX A. SOURCE CODE
pv_i = [Pv’; pv_i]; %Lenght is simply the difference in height l_i = [abs(h - INI(3)); l_i]; %Time is found also with the new l_i t = catmullromtimet(Pv’,l_i(1)); t_i = [t; t_i];
A.2
Matlab Multidimensional Catmull-Rom Polynomial
function [Cp n m] = catmullrompoly(P,a) %CATMULROMPOLY Returns the n-dimensional Catmul-Rom spline polynomials in % the 3th order polynomials in Cp, the number of polynomials n % and dimension m. ’a’ is the tension parameter. % Author: Andres Agudelo %Tension parameter, a high value makes the spline so tense that seems %a set of straight lines if (nargin == 1) a = 0.5; end %The number of segments that need to be calculated n = size(P,1)-3; %Dimension of the input points m = size(P,2); %P must be a n x 2 matrix with more than 4 pairs of coordinates if size(P,1) < 4 error([’Input P must be a n x m matrix with n >= 4 and m the dimension’, ... ’(e.g. m = 4, 4D space. Note m can also be 1)’]); end %Catmull-Rom matrix, allows to calculate the polynomials for each dimension CR = [ [ -a 2-a a-2 a] [ 2*a a-3 3-2*a -a] [ -a 0 a 0] [ 0 1 0 0]]; Cp = zeros(4,m,n); %Find the polynomials corresponding to a %four point window using the Catmul-Rom matrix. %Cp(:,:,i) is a 4 x m matrix, with each column j the %corresponding j dimension polynomial for i=1:n Cp(:,:,i) = (CR*P(i:i+3,:)); %4 x m matrix end
A.3. MATLAB TWO DIMENSIONAL CATMULL-ROM POLYNOMIAL LENGTH91
A.3
Matlab Two Dimensional Catmull-Rom Polynomial Length
function L = catmullromlen(Xu,Yu) %CATMULROMLEN Returns the length of a Catmul-Rom spline 2D % segment using the Gauss-Legendre method with N=8 for the arc lenght % integral. % Xu and Yu are the X an Y Catmull-Rom polynomials in Matlab polynomial % format. % More information on: Mathews, J. H. and Fink, K. D., Numerical Methods % Using Matlab 4th Ed, Perentice Hall, NJ, USA, p.398. 2004. % Author: Andres Agudelo %Gauss-Legendre Abscissas uNk = [ -0.9602898565, -0.7966664774, -0.5255324099, -0.1834346425, ... +0.1834346425, +0.5255324099, +0.7966664774, +0.9602898565 ]; %Gauss-Legendre weights: wNk = [ 0.1012285363, 0.2223810345, 0.3137066459, 0.3626837834, ... 0.3626837834, 0.3137066459, 0.2223810345, 0.1012285363 ]; L = 0; %Sum over k to find approximate integral on the special interval [0,1] for i=1:8 L = L + wNk(i)*arclenfun(Xu,Yu,(1+uNk(i))/2); end %Divide by the general translation factor to compensate for the interval %[0,1] L = L*0.5; end %Non-integrable arc lenght function for Catmull-Rom %for a parametrical curve the function is sqrt(dXp(u)^2+dYp(u)^2) %where dXp and dYp are the derivatives function f = arclenfun(Xu,Yu,u) dXp = polyder(Xu); %Polynomial derivatives dYp = polyder(Yu); %Polinomial derivatives evaluated, added and then square rooted f = sqrt(polyval(dXp,u)^2 + polyval(dYp,u)^2); end
A.4
Matlab Smooth Velocity Time Calculation
function TLn = catmullromtimet(Vu,L) %CATMULROMTIMET Returns the time required for a particle with velocity % determined by a Catmull-Rom spline polynomial to cover distance L. % This procedure requires integration over distance of 1/Vu, a numerical % trapezoid metod is used.
92 % %
APPENDIX A. SOURCE CODE Vu us the velocity polynomial and L is the distance. Author: Andres Agudelo
%Num steps N = 5000; l = linspace(0,L,N); %Find V(l) in [0, L] mapping from V(u) in [0 1] VLn = Vu./[L^3 L^2 L 1]; TLn = 0; for i=1:N-1 TLn = TLn + (l(i+1)-l(i))/polyval(VLn,(l(i+1)+l(i))/2); end