Company Update
Thailand
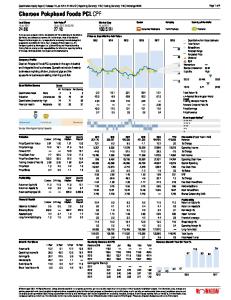
TICON Industrial Connection PCL (TICON.BK/TICON TB)*
นักลงทุนโปรดทราบ!
Outperform‧Maintained Price as of 12 Jan 2018
17.10
12M target price (Bt/shr)
19.30
Unchanged/Revised up(down)(%)
Unchanged
Upside/downside (%)
12.9
Key messages
เราคาดว่า TICON จะได้อานิ สงส์จากวัฎจักรการลงทุนรอบใหม่ เพราะธุ รกิจของบริ ษทั เกี่ยวข้องกับการพัฒนาโรงงานและโกดัง สิ นค้าให้เช่ า ซึ่ งลูกค้าหลักอยู่ในกลุ่ มยานยนต์และ Logistic ซึ่ ง อยูใ่ น 10 อุ ตสาหกรรมเป้ าหมายของ EEC นอกจากนี้ งบดุลที่ แข็งแกร่ งขึ้น และพันธมิตรที่มีชื่อเสี ยงก็จะเป็ นปั จจัยบวกเฉพาะ ของบริ ษัท ซึ่ งจะช่ วยเปิ ดโอกาสที่จะสร้างการเติบโตของธุ รกิ จ ในอนาคต ทั้งนี้ ราคาหุ ้น TICON ยังปรับขึ้นน้อยกว่าหุ ้นอื่นใน กลุ่ ม นับตั้งแต่ SET index เริ่ มวิ่งขึ้นมา (เดือนสิ งหาคม 2560) ในขณะที่เรามองว่า downside น่ าจะอยูท่ ี่ 15.90 บาท ดังนั้น เรา จึงเชื่ อว่าการที่ราคาหุ ้นยังแกว่งตัวในช่ วงแคบจะเป็ นโอกาสให้ เข้าซื้ อสะสม เรายังคงแนะนาให้ซ้ื อ โดยให้ราคาเป้ าหมายปี 2561 ที่ 19.30 บาท
Trading data 31.7/793
Mkt cap (Btbn/US$mn) Outstanding share (mn)
1,834
Foreign ownership (mn)
883.5
3M avg. daily trading (mn)
4
52-week trading range (Bt)
Bt12.7-17.3 3M
6M
12M
Absolute
0
16.9
4.8
Relative
-5
2.3
-8.8
Performance (%)
Quarterly EPS EPS 2014 2015 2016 2017
Q1 0.16 0.00 0.23 0.05
Q2 0.00 -0.03 -0.01 0.02
Q3 0.02 0.01 0.02 0.06
Q4 0.55 0.72 0.01 n.a.
Share price chart 20
10 18
Event อัพเดตข้อมูลบริ ษทั lmpact ถึงไม่ ใช่ บริษทั แรกที่จะได้อานิสงส์ จาก EEC แต่ กอ็ าจเป็ นบริษทั ถัดไป TICON ยังคงได้รับประโยชน์ จากวัฏจักรการลงทุนรอบใหม่ เนื่ องจากโรงงานและโกดังสิ นค้าของ บริ ษทั ให้บริ การกับอุตสาหกรรมที่มีศกั ยภาพ ได้แก่ ยานยนต์ (37% ของโรงงานทั้งหมด) และ logistic (40% ของโกดังสิ นค้า) โดยในปั จจุบนั 65% ของโรงงานและโกดังสิ นค้าของบริ ษทั ตั้งอยูใ่ นพื้นที่ EEC (Figure 5) ในขณะที่ TICON ยังมีพ้ืนที่เปล่าในมืออีกประมาณ 1,500 ไร่ ในพื้นที่ EEC ซึ่ งพร้อมพัฒนา เพื่อตอบสนองต่ออุปสงค์ที่รออยูข่ า้ งหน้า (Figure 6) เราคาดการพื้นที่ใหม่ของคลังสิ นค้าที่ 180,000ตรม. และ 5,000ตรม. สาหรับโรงงาน มีโอกาสเติบโตสู งจากปัจจัยเฉพาะ: งบดุลที่แข็งแกร่ งขึน้ และพันธมิตรที่มีชื่อเสียง หนี้ ที่มีภาระดอกเบี้ยของบริ ษทั ลดลงอย่างต่อเนื่ องจาก 2.22 หมื่นล้านบาทใน 4Q59 เหลือ 1.33 หมื่น ล้านบาทใน 3Q60 และคาดว่าจะลดลงเหลื อ 8.5 พันล้านบาทในปี 2562 ซึ่ งจะฉุ ดให้ค่าใช้จ่ายดอกเบี้ ย ลดลงจาก ~800 ล้านบาทในปี 2559 เหลือแค่ ~300 ล้านบาทในปี 2562 เนื่ องจากเราไม่คิดว่าจะมีการใช้ เงิ นลงทุนก้อนใหญ่อย่างน้อยก็จนกว่าจะถึ งปี 2562 จากที่ดินในมือ นอกจากนี้ พันธมิ ตรอย่าง Fraser น่าจะยังเปิ ดโอกาสการลงทุนให้กบั บริ ษทั ราคาหุ้นขยับช้ ากว่าหุ้นอืน่ ในกลุ่ม เป็ นโอกาสให้ เข้ าซื้อสะสม SET Index วิ่งแรงมาตั้งแต่เดื อนสิ งหาคม 2560 หลังจากที่ตลาดหลักทรัพย์แห่ งประเทศไทย (SET) จัด งาน Thailand Focus 2560 ซึ่ งคิดเป็ นอัตราผลตอบแทน 15.8% งาน Thailand Focus เป็ น platform เฉพาะที่เปิ ดโอกาสให้รัฐบาลได้แสดงวิสยั ทัศน์ พันธกิจ นโยบาย กลยุทธ์หลัก และอัพเดตข้อมูลเกี่ยวกับ โครงการขนาดใหญ่ หุ้นของทั้ง AMATA, WHA, และ TICON ต่างก็ให้ผลตอบแทนดี กว่า SET index โดยอยูท่ ี่ 56.4%, 43.7% และ 22.9% ตามลาดับ (Figure 7) เรามองว่าราคาหุ ้น TICON ที่ขยับเพิ่มขึ้นช้า กว่าหุ้นอื่นในกลุ่มเป็ นโอกาสาให้นกั ลงทุนเข้าซื้อสะสม Downside ของราคาหุ้นไม่ น่าหลุด15.90 บาท เรามองว่า downside ของราคาหุ้นอยู่ที่ 15.90 บาท หลังจากที่เราทาการวิเคราะห์ sensitivity ระหว่าง พื้นที่ใหม่สาหรับให้เช่าโรงงานและโกดังสิ นค้ากับราคาเป้ าหมาย (Figure 9) ในขณะที่ต้ งั แต่เราเริ่ มดูแล TICON มาราคาหุ ้นก็แกว่งตัวอยูใ่ นช่ วง 16.10 และ 17.70 บาท ดังนั้น เราจึงเชื่ อว่า downside ของราคา หุ ้นไม่น่าจะหลุด 15.90 บาท ซึ่ งจากราคาปิ ดล่าสุ ดที่ 17.10 บาท แปลว่ามี downside แค่ 7% แต่มี upside ถึง 13% ซึ่งเท่ากับหุ้น TICON มีสดั ส่วน reward/risk ratio ที่น่าสนใจสมควรเข้าลงทุน Valuation & Action เรายังคงแนะนาให้ซ้ื อ โดยให้ราคาเป้ าหมาย DCF ปี 2561 ที่ 19.30บาท โดยใช้ WACC ที่ 7.9% เราใช้i) RFRที่ 3.7%ii) RPที่ 8.0%iii) beta ที่ 0.65x (เทียบกับหุ ้นนิ คมอุตสาหกรรมในโลก)และ iv) terminal growth ที่ 3.0%
0
16
(10)
14
(20)
12 10 Jan-17
(30) (40) Mar-17 Share Price
Jun-17
Aug-17
Oct-17
Price performance relative to SET
Jan-18
Risks ความเสี่ ยงด้านภูมิรัฐศาสตร์ , เศรษฐกิ จชะลอตัว, ภัยธรรมชาติ, การกระจุกตัวของกลุ่มอุตสาหกรรม, ความเพียงพอของเงินทุนและช่วงที่สญ ั ญาเช่าระยะสั้นหมดอายุ Key financials and valuations
Source: SET
Chananthorn Pichayapanupat 66.2658.8888 Ext.8849
[email protected]
Revenue (Btmn) Gross Profit (Btmn) SG&A (Btmn) Net Profit (Btmn) Normalized Profit (Btmn) EPS(Bt) Normalized EPS(Bt) DPS(Bt) EPSGrowth (%) Normalized EPSGrowth P/E(X) P/B (X) EV/EBITDA (X) Net Debt to Equity (%) Dividend Yield (%) Return on Average Equity (%)
Dec - 15A 4,460 1,700 757 770 843 0.70 0.77 0.50 1.1 (22.9) 19.9 1.3 24.3 178.3 3.6 6.6
Dec - 16A 1,502 943 704 275 112 0.25 0.10 0.08 (64.3) (86.7) 57.0 1.4 32.7 192.2 0.6 2.4
Dec - 17F 5,649 2,476 711 1,307 1,307 0.71 0.71 0.57 184.8 598.9 24.0 1.3 13.5 22.0 3.3 5.2
Dec - 18F 2,011 1,359 718 701 701 0.38 0.38 0.32 (46.4) (46.4) 44.7 1.3 22.8 25.1 1.9 2.8
Dec - 19F 2,444 1,648 725 1,019 1,019 0.56 0.56 0.47 45.3 45.3 30.8 1.2 19.6 27.2 2.8 4.0
Source: KGI Research
January 15, 2018
*The Company may be issuer of Derivative Warrants on these securities. http://research.kgi.com; Bloomberg: KGIT
Please see back page for disclaimer
1
Thailand
TICON Industrial Connection PCL
Figure 1: Factory tenants by Industry
Figure 2: Factory tenants by country
Percent
Percent Food
Plastic 3.0
Logistic
Thailand
N.America
3.0 3.0
3.0
7.0
Others 8.0
18.0
Others
37.0
Automotive
Singapore
9.0 59.0
Japan
14.0
Europe Electronics
36.0
Source: Company data, KGI Research
Source: Company data, KGI Research
Figure 3: Warehouse tenants by industry
Figure 4: Warehouse tenants by country
Percent
Percent Electronics
Trading
Australia
5.0
Others
8.0
Wholesale/Retailer
9.0 40.0
Automotive
N.America 3.0 3.0
5.0
38.0
Logistic
Japan
Europe
25.0
16.0
22.0
26.0
Others
Thailand
Source: Company data, KGI Research
Source: Company data, KGI Research
Figure 5: Most existing Factory and warehouse located in EEC
Figure 6: Raw land of 1,500 rai in EEC area for serving upcoming demand
Percent
rai 4,000 3,500 3,000
Non-EEC
2,500
35.3
2,000 1,500 1,000
64.7
500
EEC
0
Rayong
Chonburi Developed Land
Source: Company data, KGI Research
Chachoengsao
Total
Available Land
Source: Company data, KGI Research
Figure 7: Share price return since Aug 2017 to date Percent
56.4
43.7
22.9 15.8
AMATA
January 15, 2018
WHA
TICON
SET
*The Company may be issuer of Derivative Warrants on these securities. http://research.kgi.com; Bloomberg: KGIT
Please see back page for disclaimer
2
Thailand
TICON Industrial Connection PCL
Source: Biznews, KGI Research
Figure 8: Assumption and leasable summary Leasable area under TICON Leasable area Warehouse Occ Rate New leasable Leasable area Factory Occ Rate New leasable Leasable area Total Occ Rate New leasable
sqm % sqm sqm % sqm sqm % sqm
2015 816,144 71.0 93,664 360,630 46.0 25,350 953,144 61.5 119,014
2016 886,144 72.0 223,630 399,780 49.1 39,150 1,215,924 63.2 262,780
2017F 1,066,144 80.0 200,000 449,780 57.0 50,000 1,335,924 72.3 250,000
2018F 1,246,144 83.3 180,000 454,780 62.0 5,000 1,520,924 76.9 185,000
2019F 1,246,144 86.4 180,000 459,780 66.9 5,000 1,705,924 81.1 185,000
Leasable area under REIT and PF TFUND TLOGIS TGROWTH TREIT Total REIT and PF Occupancy Rate
sqm sqm sqm sqm sqm %
2015 579,985 243,625 296,545 369,705 1,489,860 83.0
2016 579,985 243,625 296,545 369,705 1,489,860 88.0
2017F 579,985 243,625 296,545 499,705 1,619,860 88.0
2018F 579,985 243,625 296,545 499,705 1,619,860 88.0
2019F 579,985 243,625 296,545 499,705 1,619,860 88.0
Total space Occupancy rate
sqm %
2,666,634 74.6
2,775,784 76.9
3,135,784 80.9
3,320,784 82.6
3,325,784 84.5
Source: Company Data, KGI Research
Figure 9: Sensitivity analysis of new leasable area of factories and warehouses to 2018 target price
New Leasable area of Warehouse (sqm)
2018 Target price 0 25,000 50,000 75,000 100,000 125,000 150,000 175,000 200,000 225,000 250,000 275,000 300,000
0 15.9 16.4 16.9 18.0 18.5 19.0 19.6 20.1 20.6 21.2 21.7 22.3 22.8
5,000 15.9 16.4 16.9 18.0 18.5 19.0 19.6 20.1 20.6 21.2 21.7 22.3 22.8
10,000 15.9 16.4 16.9 18.0 18.5 19.0 19.6 20.1 20.6 21.2 21.7 22.3 22.8
15,000 16.1 16.6 17.1 18.2 18.7 19.3 19.8 20.3 20.9 21.4 21.9 22.5 23.0
20,000 16.1 16.6 17.1 18.2 18.7 19.3 19.8 20.3 20.9 21.4 22.0 22.5 23.0
New leasable area of Factory (sqm) 25,000 30,000 35,000 40,000 16.1 16.1 16.1 16.1 16.6 16.6 16.6 16.6 17.1 17.1 17.1 17.1 18.2 18.2 18.2 18.2 18.7 18.7 18.7 18.7 19.3 19.3 19.3 19.3 19.8 19.8 19.8 19.8 20.3 20.3 20.3 20.4 20.9 20.9 20.9 20.9 21.4 21.4 21.4 21.4 22.0 22.0 22.0 22.0 22.5 22.5 22.5 22.5 23.0 23.0 23.0 23.0
45,000 16.1 16.6 17.1 18.2 18.7 19.3 19.8 20.4 20.9 21.4 22.0 22.5 23.0
50,000 16.1 16.6 17.1 18.2 18.7 19.3 19.8 20.4 20.9 21.4 22.0 22.5 23.1
55,000 16.1 16.6 17.1 18.2 18.8 19.3 19.8 20.4 20.9 21.4 22.0 22.5 23.1
60,000 16.1 16.6 17.1 18.2 18.8 19.3 19.8 20.4 20.9 21.4 22.0 22.5 23.1
65,000 16.1 16.6 17.1 18.2 18.8 19.3 19.8 20.4 20.9 21.4 22.0 22.5 23.1
Source: KGI Research
January 15, 2018
*The Company may be issuer of Derivative Warrants on these securities. http://research.kgi.com; Bloomberg: KGIT
Please see back page for disclaimer
3
Thailand
TICON Industrial Connection PCL
Figure 10: Company profile
Figure 11: Solid revenue growth
TICON Industrial Connection PCL (TICON) engages in developing
Revenue(excl. sell to REIT), Btmn (LHS); revenue growth, percent(RHS)
factories
and
logistic
warehouses
for
rent
in
industrial
estates,
industrial parks, industrial zones, industrial promotions, and other strategic locations throughout Thailand. At the end of 2016, the company provided 15 different location for factories and 33 different
3,000
35.0
2,500
30.0 25.0
2,000
20.0 1,500 15.0
locations for logistic warehouses. Currently, the major shareholder of
1,000
TICON is Fraser Centrepoint Limited (FCL), a fully-fledged multi-
500
national real estate company with total asset of S$25bn with three
-
10.0 5.0 -
2015
strategic business units: Singapore, Australia, and Hospitality (40%
2016
2017F
2018F
2019F
stake). Source: Company data
Source: Company data, KGI Research
Figure 12: Stronger balance sheet
Figure 13: Lower interest expense
Interest bearing debt, Btbn(LHS); Interest bearing debt/Equity, times(RHS)
Rai
25.0
2.5
900
20.0
2.0
15.0
1.5
600
10.0
1.0
500
5.0
0.5
0.0
0.0
800 700
Interest bearing debt
2019F
2018F
2017F
2016
2015
2014
2013
2012
2011
2010
2009
2008
2007
400
300 200
100 0
2015
IBD/equity
2016
2017F
Source: Company data, KGI Research
Source: Company data, KGI Research
Figure 14: Plentiful of land bank in EEC area
Figure 15: Lower CAPEX
Rai
Btbn
2018F
2019F
2020F
4,000 3,500
9.6
3,000
7.8
2,500 2,000
7.5
5.8
1,500 1,000
3.3
500
1.7
1.5
1.1
1.2
2016
2017F
2018F
2019F
1.7
0
Rayong
Chonburi
Chachoengsao
Developed Land
Total
2010
Available Land
2011
2012
2013
2014
Source: Company data, KGI Research
Source: Company data, KGI Research
Figure 16: Company’s PER
Figure 17: Company’s PBV
PER, times
PBV, times
80.0
2015
3.0 +2.0 sd = 58.5x
60.0
+2.0 sd = 2.2x
+1.0 sd = 42.9x 40.0
+1.0 sd = 1.9x
2.0
Average = 1.5x
Average = 27.2x
20.0
1.0
-1.0 sd = 1.1x
-1.0 sd = 11.8x
0.0
-2.0 sd = 0.8x
-2.0 sd = -3.8x (20.0) 2013
0.0
2014
Source: KGI Research
January 15, 2018
2015
2016
2017F
2018F
2019F
2013
2014
2015
2016
2017F
2018F
2019F
Source: KGI Research
*The Company may be issuer of Derivative Warrants on these securities. http://research.kgi.com; Bloomberg: KGIT
Please see back page for disclaimer
4
Thailand
January 15, 2018
TICON Industrial Connection PCL
*The Company may be issuer of Derivative Warrants on these securities. http://research.kgi.com; Bloomberg: KGIT
Please see back page for disclaimer
5
Thailand
TICON Industrial Connection PCL
Quarterly Income Statement Income Stetement (Bt mn) Revenue Cost of Goods Sold Gross Profit Operating Expense Other incomes Operating Profit Depreciation of fixed asset Operating EBITDA Non-Operating Income Interest Income Other Non-op Income Non-Operating Expense Interest Expense Other Non-op Expense Equity Income/(Loss) Pre-tax profit Current Taxation Minorities Extraordinary items Net Profit Normalized Profit EPS(Bt) Normalized EPS(Bt) Margins Gross profit margin Operating EBIT margin Operating EBITDA margin Net profit margin Growth Revenue growth Operating EBIT growth Operating EBITDA growth Net profit growth Normalized profit growth
Mar-14A
Jun-14A
Sep-14A
Dec-14A
Mar-15A
Jun-15A
Sep-15A
Dec-15A
Mar-16A
721 (257) 465 (114) (1) 349 97 253 3 3 0 (157) (157) 0 73 268 (59) 0 (65) 144 144 0.16 0.16
289 (74) 214 (101) (2) 112 91 21 1 1 0 (165) (165) 0 70 17 (18) 0 0 (1) (1) (0.00) (0.00)
341 (100) 240 (118) (20) 102 105 (2) 5 3 2 (140) (140) 0 64 32 (15) 0 0 17 15 0.02 0.01
4,269 (3,086) 1,183 (181) (8) 994 141 853 (1) 1 (2) (62) (180) 118 60 755 (46) (0) (107) 602 722 0.55 0.66
261 (92) 170 (126) (9) 34 127 (93) 27 3 24 (181) (174) (7) 64 (42) (4) 0 46 0 (31) 0.00 (0.03)
337 (108) 229 (123) (3) 103 119 (16) 1 1 0 (187) (187) 0 60 (22) (8) (1) 0 (30) (30) (0.03) (0.03)
417 (136) 281 (119) (8) 153 121 32 0 0 0 (196) (196) 0 61 19 (6) 1 (4) 7 7 0.01 0.01
3,445 (2,424) 1,021 (104) (13) 904 155 749 105 2 102 (165) (206) 40 63 826 (72) 0 39 793 731 0.72 0.66
262 (76) 186 (113) 4 77 91 (13) 89 0 89 (213) (201) (12) 75 51 (54) 1 259 256 156 0.23 0.14
Jun-16A Sep-16A Dec-16A Mar-17A 281 (75) 205 (106) 8 107 91 16 4 4 0 (245) (204) (41) 64 13 (21) 1 0 (10) (51) (0.01) (0.05)
415 (164) 250 (145) 26 132 131 1 16 1 15 (201) (204) 2 58 (0) (13) 1 36 21 9 0.02 0.01
544 (244) 301 (159) 21 162 124 39 2 2 0 (212) (203) (9) 56 26 (18) 1 (0) 7 (1) 0.01 (0.00)
463 (157) 307 (124) 6 189 131 58 25 25 0 (161) (161) 0 57 109 (14) 1 0 95 95 0.05 0.05
Jun-17A Sep-17A 385 (141) 244 (140) 7 110 138 (28) 28 28 0 (151) (151) 0 58 45 (0) 1 0 44 44 0.02 0.02
449 (164) 286 (122) 8 171 140 31 16 16 0 (133) (133) 0 58 113 (7) 1 0 106 106 0.06 0.06
64.4 48.4 35.0 19.9
74.2 38.8 7.3 (0.2)
70.5 30.1 (0.6) 4.9
27.7 23.3 20.0 14.1
64.9 13.1 (35.7) 0.0
67.9 30.6 (4.7) (8.8)
67.3 36.8 7.7 1.6
29.6 26.2 21.7 23.0
71.1 29.5 (5.1) 97.7
73.1 38.3 5.8 (3.4)
60.4 31.9 0.3 5.2
55.3 29.8 7.1 1.4
66.2 40.7 12.4 20.5
63.3 28.6 (7.3) 11.5
63.6 38.1 6.9 23.6
(85.3) (80.1) (84.9) (85.1) (85.1)
(60.0) (67.9) (91.6) (100.4) (100.4)
18.0 (8.6) (110.2) (3,002.9) (2,675.9)
1,152.9 870.2 (39,412.2) 3,473.7 4,729.7
(93.9) (96.6) (110.9) (100.0) (104.3)
29.0 200.9 (83.0) (31,085.4) (4.2)
23.8 49.0 (303.3) (122.8) (122.8)
725.7 489.0 2,231.7 11,602.6 10,689.6
(92.4) (91.4) (101.8) (67.7) (78.7)
7.3 38.9 (223.0) (103.7) (132.5)
47.7 22.9 (91.2) (323.6) (116.9)
31.3 23.0 2,591.1 (65.3) (117.5)
(14.9) 16.1 48.9 1,181.7 (6,435.1)
(16.8) (41.5) (148.6) (53.4) (53.4)
16.5 55.4 (210.3) 139.4 139.4
Upside (%) 18.9 12.9 5.5
16 core EPS (Bt) 1.35 0.10 0.20
17 core EPS (Bt) 1.35 0.71 0.14
Source: KGI Research
Peer comparison – Key valuation stats Rating AMATA TICON WHA Sector
OP OP OP Overweight
Target Current Price (Bt) price (Bt) 31.5 26.5 19.3 17.1 4.60 4.36
18 core EPS (Bt) 1.97 0.38 0.22
17F PER (X) 19.6 24.0 32.1 25.2
18F PER (X) 13.5 44.7 19.7 26.0
17F PBV (X) 1.9 1.3 2.9 2.0
18F PBV (X) 1.7 1.3 2.6 1.9
17F Div 18F Div 17F ROAE 18F ROAE yield (%) yield (%) (%) (%) 2.0 3.0 5.1 7.0 3.3 1.9 3.2 1.9 1.2 2.0 3.9 3.0 2.2 2.3 4.1 4.0
Source: KGI Research
January 15, 2018
*The Company may be issuer of Derivative Warrants on these securities. http://research.kgi.com; Bloomberg: KGIT
Please see back page for disclaimer
6
Thailand
TICON Industrial Connection PCL
Balance Sheet As of 31 Dec (Bt mn) Total Assets Current Assets Cash & ST Investment Inventories Account Receivable Others Non-current Assets LT Investment Net fixed Assets Others Total Liabilities Current Liabilities Account Payable ST Borrowing Others Long-term Liabilities Long-term Debts Others Shareholders' Equity Common Stock Capital Surplus Retained Earnings Preferred Stock
Profit & Loss 2015 36,287 1,542 1,156 0 95 291 34,745 30,075 183 4,487 24,598 6,479 606 2,033 3,839 18,119 16,339 1,780 11,689 1,099 7,343 3,053 0
2016 36,093 912 306 0 138 468 35,180 31,247 181 3,753 24,675 8,291 493 3,086 4,711 16,384 14,591 1,793 11,418 1,099 7,343 2,775 0
2017F 40,581 8,425 7,841 0 188 395 32,156 28,241 183 3,732 15,672 4,663 391 0 4,271 11,010 9,220 1,790 24,909 1,834 19,838 3,037 0
2018F 36,298 3,469 2,934 0 234 302 32,829 28,985 184 3,660 11,284 2,555 214 0 2,341 8,729 7,000 1,729 25,014 1,834 19,838 3,142 0
2019F 35,861 2,297 1,647 0 283 367 33,564 29,752 186 3,626 10,694 1,608 262 0 1,347 9,086 7,300 1,786 25,167 1,834 19,838 3,295 0
Source: KGI Research
Source: KGI Research
January 15, 2018
2015 4,460 (2,760) 1,700 (757) 501 1,441 (523) 2,146 40 7 33 (729) (762) 33 248 861 (90) 1 126 770 843 0.70 0.77
2016 1,502 (559) 943 (704) 549 774 (436) 1,632 (53) 7 (59) (871) (812) (59) 252 384 (106) 3 104 275 112 0.25 0.10
2017F 5,649 (3,174) 2,476 (711) 211 1,890 (494) 2,729 85 85 0 (666) (666) 0 260 1,569 (262) 0 0 1,307 1,307 0.71 0.71
2018F 2,011 (652) 1,359 (718) 218 883 (418) 1,654 85 85 0 (426) (426) 0 268 809 (108) 0 0 701 701 0.38 0.38
2019F 2,444 (795) 1,648 (725) 226 1,161 (429) 1,950 85 85 0 (317) (317) 0 276 1,205 (186) 0 0 1,019 1,019 0.56 0.56
2015 1,985 770 523 692
2016 450 275 436 (261)
2017F 1,587 1,307 494 (216)
2018F 879 701 418 (241)
2019F 1,421 1,019 429 (28)
(5,281) (5,271) (22) 13 (3,296) 4,228 0 4,774 (546) 932
(998) (1,604) 550 56 (549) (301) 0 246 (547) (850)
2,691 2,510 182 (2) 4,277 3,258 735 (8,927) 11,449 7,535
(1,089) (1,163) 76 (2) (210) (4,698) 0 (4,102) (596) (4,908)
(1,121) (1,198) 78 (2) 300 (1,586) 0 (720) (866) (1,286)
Source: KGI Research
Key Ratios Year to 31 Dec Growth (%YoY) Sales OP EBITDA NP Normalized Profit EPS Normalized EPS Profitability (%) Gross Margin Operating Margin EBITDA Margin Net Margin ROAA ROAE Stability Gross Debt/Equity (%) Net Debt/Equity (%) Interest Coverage (x) Interest & ST Debt Coverage (x) Cash Flow Interest Coverage (x) Cash Flow/Interest & ST Debt (x) Current Ratio (x) Quick Ratio (x) Net Debt (Bt mn) Per Share Data (Bt) EPS Normalized EPS CFPS BVPS SPS EBITDA/Share DPS Activity Asset Turnover (x) Days Receivables Days Inventory Days Payable Cash Cycle
Year to Dec 31 (Btmn) Revenue Cost of Goods Sold Gross Profit Operating Expenses Other Incomes Operating Profit Depreciation of fixed assets Operating EBITDA Non-Operating Income Interest Income Other Non-op Income Non-Operating Expense Interest Expense Other Non-op Expense Equity Income/(Loss) Pretax Profit Current Taxation Minorities Extraordinaries items Net Profit Normalized Profit EPS(Bt) Normalized EPS(Bt)
Cash Flow 2015
2016
2017F
2018F
2019F
8.5 (9.9) 8.6 1.1 (22.9) 1.1 (22.9)
11.8 (46.3) (23.9) (64.3) (86.7) (64.3) (86.7)
26.8 144.1 67.2 375.2 1066.2 184.8 598.9
24.1 (53.3) (39.4) (46.4) (46.4) (46.4) (46.4)
21.2 31.4 17.9 45.3 45.3 45.3 45.3
38.1 32.3 48.1 17.3 2.1 6.6
62.8 51.6 108.7 18.3 0.8 2.4
43.8 33.5 48.3 23.1 3.2 5.2
67.6 43.9 82.3 34.9 1.9 2.8
67.5 47.5 79.8 41.7 2.8 4.0
2.1 1.8 2.1 0.6 2.6 0.7 0.2 0.2 20,844
2.2 1.9 1.5 0.3 0.6 0.1 0.1 0.1 21,940
0.6 0.2 3.4 3.4 2.4 2.4 1.8 1.8 5,481
0.5 0.3 2.9 2.9 2.1 2.1 1.4 1.4 6,286
0.4 0.3 4.8 4.8 4.5 4.5 1.4 1.4 6,853
0.7 0.8 1.8 10.6 4.1 2.0 0.5
0.3 0.1 0.4 10.4 1.4 1.5 0.1
0.7 0.7 0.9 13.6 3.1 1.5 0.6
0.4 0.4 0.5 13.6 1.1 0.9 0.3
0.6 0.6 0.8 13.7 1.3 1.1 0.5
0.1 8 NA 722 NA
0.0 34 NA 542 NA
0.1 12 NA 320 NA
0.1 42 NA 152 NA
0.1 42 NA 153 NA
Year to 31 Dec (Bt mn) Operating Cash Flow Net Profit Depreciation & Amortization Change in Working Capital Others Investment Cash Flow Net CAPEX Change in LT Investment Change in Other Assets Free Cash Flow Financing Cash Flow Change in Share Capital Net Change in Debt Change in Other LT Liab. Net Cash Flow Source: KGI Research
Rates of Return on Invested Capital Year 2015 2016 2017F 2018F 2019F Year 2015 2016 2017F 2018F 2019F Year 2015 2016 2017F 2018F 2019F
COGS Operating Exp. Operating Depreciation + + = Revenue Revenue Margin Revenue 61.9% 11.7% 28.4% -2.0% 37.2% 29.0% 83.9% -50.1% 56.2% 8.7% 17.8% 17.3% 32.4% 20.8% 50.8% -4.0% 32.5% 17.6% 42.4% 7.5% Working Capital Other Assets Capital Net PPE 1/ + + = Revenue Revenue Turnover Revenue 0.2 0.0 8.1 0.1 (0.2) 0.1 23.9 0.0 (0.0) 0.0 7.2 0.1 (0.1) 0.1 18.0 0.1 (0.0) 0.1 14.6 0.1 Operating Cash After-tax Return Capital x x = Margin Tax Rate on Inv. Capital Turnover -2.0% 10.4% 0.0% 0.1 -50.1% 27.7% -0.6% 0.0 17.3% 16.7% 0.4% 0.1 -4.0% 13.4% 0.0% 0.1 7.5% 15.4% 0.1% 0.1
1-
Source: KGI Research
*The Company may be issuer of Derivative Warrants on these securities. http://research.kgi.com; Bloomberg: KGIT
Please see back page for disclaimer
7
Thailand
TICON Industrial Connection PCL
TICON Industrial Connection PCL– Recommendation & target price history Date 16-Nov-17
22
20
Rating Outperform
Target 19.30
Price 17.20
18 16 14
12 10 Jan-17
Feb-17
Mar-17
Apr-17
May-17
Jun-17
Share price
Jul-17
Aug-17
Target price lowered
Sep-17
Oct-17
Nov-17
Dec-17
Jan-18
Target price raised
Source: KGI Research
KGI Locations
ChinaShanghai
Room 1907-1909, Tower A, No. 100 Zunyi Road, Shanghai, PRC 200051
Shenzhen
Room 24D1, 24/F, A Unit, Zhen Ye Building,2014 Bao’annan Road, Shenzhen, PRC 518008
TaiwanTaipei
700 Mingshui Road, Taipei, Taiwan Telephone886.2.2181.8888 ‧
Hong Kong
Facsimile886.2.8501.1691
41/F CentralPlaza, 18 Harbour Road, Wanchai, Hong Kong Telephone 852.2878.6888
ThailandBangkok
Facsimile 852.2878.6800
8th - 11th floors, AsiaCentreBuilding 173 South Sathorn Road, Bangkok10120, Thailand Telephone 66.2658.8888
KGI's Ratings
Facsimile 66.2658.8014
Rating
Definition
Outperform (OP)
The stock's excess return* over the next twelve months is ranked in the top 40% of KGI's coverage universe in the related market (e.g. Taiwan).
Neutral (N)
The stock's excess return* over the next twelve months is ranked in the range between the top 40% and the bottom 40% of KGI's coverage universe in the related market (e.g. Taiwan).1.3
Under perform (U)
The stock's excess return* over the next twelve months is ranked in the bottom 40% of KGI's coverage universe in the related market (e.g. Taiwan).
Not Rated (NR)
The stock is not rated by KGI Securities.
Restricted (R)
KGI policy and/or applicable law regulations preclude certain typesofcommunications, including an investment recommendation, during the course of KGI's engagement in an investment banking transaction and in certain other circumstances.
Excess return = 12M target price/current priceNote
Disclaimer
January 15, 2018
KGI Securities no event shall profits, arising to buy or sell
When an analyst publishes a new report on a covered stock, we rank the stock's excess return with those of other stocks in KGI's coverage universe in the related market. We will assign a rating based on its ranking. If an analyst does not publish a new report on a covered stock, its rating will not be changed automatically. (Thailand) Plc. (“The Company”) disclaims all warranties with regards to all information contained herein. In the Company be liable for any direct, indirect or any damages whatsoever resulting from loss of income or by utilization and reliance on the information herein. All information hereunder does not constitute a solicitation any securities but constitutes our sole judgment as of this date and are subject to change without notice.
*The Company may be issuer of Derivative Warrants on these securities. http://research.kgi.com; Bloomberg: KGIT
Please see back page for disclaimer
8