2d€
The use of spectroscopy in astronomy
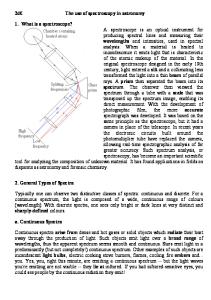
1. What is a spectroscope? A spectroscope is an optical instrument for producing spectral lines and measuring their wavelengths and intensities, used in spectral analysis. When a material is heated to incandescence it emits light that is characteristic of the atomic makeup of the material. In the original spectroscope designed in the early 19th century, light entered a slit and a collimating lens transformed the light into a thin beam of parallel rays. A prism then separated the beam into its spectrum. The observer then viewed the spectrum through a tube with a scale that was transposed up the spectrum image, enabling its direct measurement. With the development of photographic film, the more accurate spectrograph was developed. It was based on the same principle as the spectroscope, but it had a camera in place of the telescope. In recent years the electronic circuits built around the photomultiplier tube have replaced the camera, allowing real-time spectrographic analysis of far greater accuracy. Such spectrum analysis, or spectroscopy, has become an important scientific tool for analyzing the composition of unknown material. It has found applications in fields as disparate as astronomy and forensic chemistry. 2. General Types of Spectra Typically one can observe two distinctive classes of spectra: continuous and discrete. For a continuous spectrum, the light is composed of a wide, continuous range of colours (wavelength). With discrete spectra, one sees only bright or dark lines at very distinct and sharply-defined colours. a. Continuous Spectra Continuous spectra arise from dense and hot gases or solid objects which radiate their heat away through the production of light. Such objects emit light over a broad range of wavelengths, thus the apparent spectrum seems smooth and continuous. Stars emit light in a predominantly (but not completely!) continuous spectrum. Other examples of such objects are incandescent light bulbs, electric cooking stove burners, flames, cooling fire embers and... you. Yes, you, right this minute, are emitting a continuous spectrum -- but the light waves you're emitting are not visible -- they lie at infrared. If you had infrared-sensitive eyes, you could see people by the continuous radiation they emit!
Gamma rays, X-rays, ultraviolet light, microwaves and radio waves are other types of invisible light. All of these rays and waves are the same type of electromagnetic energy. They are different only because the wavelengths are different. b. Discrete Spectra Discrete spectra are the observable result of the physics of atoms. There are two types of discrete spectra, emission (bright line spectra) and absorption (dark line spectra). Ø Emission Line Spectra Emission Line Spectra are given off by fluorescent lamps, “neon” signs, and mercury-vapour or sodium-vapour lamps called gas-discharge lamps. Unlike a continuous spectrum source, which can have any energy it wants (all you have to do is change the temperature), the electron clouds surrounding the nuclei of atoms can have only very specific energies dictated by quantum mechanics. Each element on the periodic table has its own set of possible energy levels, and with few exceptions the levels are distinct and identifiable. Atoms will also tend to settle to the lowest energy level (in spectroscopist's lingo, this is called the ground state). This means that an excited atom in a higher energy level must `dump' some energy. The way an atom `dumps' that energy is by emitting a wave of light with that exact energy. In the diagram below, a hydrogen atom drops from the 2nd energy level to the 1st, giving off a wave of light with an energy equal to the difference of energy between levels 2 and 1. This energy corresponds to a specific colour or wavelength of light -- and thus we see a bright line at that exact wavelength! ...an emission spectrum is born, as shown below:
An excited Hydrogen atom relaxes from level 2 to level 1, yielding a photon. This results in a bright emission line. Ø Absorption Line Spectra On the other hand, what would happen if we tried to reverse this process? That is, what would happen if we fired this special photon back into a ground state atom? That's right, the atom could absorb that `specially-energetic' photon and would become excited, jumping from the ground state to a higher energy level. If a star with a `continuous' spectrum is shining upon an atom, the wavelengths corresponding to possible energy transitions within that atom will be
absorbed and therefore an observer will not see them. In this way, a dark-line absorption spectrum is born, which is the fingerprint of the chemical element, as shown below:
A hydrogen atom in the ground state is excited by a photon of exactly the `right' energy needed to send it to level 2, absorbing the photon in the process. This results in a dark absorption line. 3. The use of spectroscopy in astronomy a. The spectrogram of a star gives us information about the chemical composition of its photosphere The job of a modern astronomer is not what most people think it is. The popular notion of a professional astronomer is that he or she spends much of his or her time gazing through a telescope, at times taking pictures of objects for later analysis. In fact, few astronomers do anything like that. Very few of them ever look through telescopes at all. Even if they wanted to, they couldn’t. Most astronomy work today is done at computers, not telescopes, and large modern telescopes are not even equipped with eyepieces. The reason you cannot look through such telescopes is that they are not telescopes per se (like most people think) but really giant cameras. A photograph can capture objects much fainter than the human eye can see and is a much more accurate record than the human mind or even a drawing (used by astronomers to record their observations). For those reasons all major telescopes built since the early part of this century were designed as huge cameras, not visual telescopes. Most photographs captured by such large telescopes are not what most people imagine a picture to be. Instead of an image of a beautiful nebula or galaxy, most of the photos look like celestial bar codes: Thousands of thin, parallel vertical lines aligned in neat rows. It’s as if those huge telescopes were no more than giant bar code scanners. Those "bar codes" are spectrograms, and spectrograms are the basis of modern astronomy. Those thin black lines (known as Fraunhofer lines, for the German optician who first catalogued them) are visible in the spectrum of everything that
glows in the universe and are absorption lines. That gives astronomers a power that is almost magical. It allows them to do very detailed chemical analysis of distant objects without ever coming near them. That is how we can look at a star millions of light years away and know what is in it -- quite an amazing thing! Spectrograms can do even more. If the pattern of lines in the spectrum is shifted a bit from normal position, it tells us that the object is moving and how fast it moves. If the lines in the spectrum appear shifted toward the blue end of the spectrum, the object is coming toward us. If the lines are shifted toward the red, the object is moving away from us. In either case, the amount of shift (which can be very precisely measured) indicates the speed of the object. Some of the speeds detected by spectrographs are downright astonishing: Galaxies have been clocked at speeds of tens of thousands of miles per second, or hundreds of millions of miles per hour. The discovery of galaxies moving at such amazing speeds, and the fact that they were all moving away from us, is what led to the formulation of the Big Bang theory. The Big Bang theory is the foundational theory of modern astronomy and cosmology, and it is owed completely to the power of spectral analysis. b. Spectrogram of a star gives us information about the temperature of its photosphere
Stars approximate blackbody radiators and their visible colour depends upon the temperature of the radiator. "Blackbody radiation" or "cavity radiation" refers to an object or system which absorbs all radiation incident upon it and re-radiates energy which is characteristic of this radiating system only, not dependent upon the type of radiation which is incident upon it. When the temperature of a blackbody radiator increases, the overall radiated energy increases and the peak of the radiation curve moves to shorter wavelengths. When the maximum is evaluated, the product of the peak wavelength and the temperature is found to be a constant. Using this law and knowing the temperature of your body in Kelvin, you can easily find out that you are emitting infrared light.