Invited Paper
The use of remotely sensed data and innovative modeling to improve hurricane prediction Robert Atlasa, O. Realeb, B-W. Shenc, and S-J. Lind a
NOAA Atlantic Oceanographic and Meteorological Laboratory, Miami, FL Goddard Earth Science and Technology Center, University of Maryland, Baltimore MD c Science Applications International Corporation, NASA GSFC, Greenbelt, MD d NOAA Geophysical Fluid Dynamics Laboratory, Princeton, NJ b
ABSTRACT The assimilation of remotely sensed data from aircraft and satellites has contributed substantially to the current accuracy of operational hurricane forecasting. In the 1960’s, satellite imagery revolutionized hurricane detection and forecasting. Since that time, quantitative remotely sensed data (eg. atmospheric motion winds, passive infrared and microwave radiances or retrievals of temperature, moisture, surface wind and rain rate, active microwave measurements of surface wind and rain rate) and significant advances in modeling and data assimilation have increased the accuracy of hurricane track forecasts very significantly. The development of advanced next-generation models in combination new types of remotely sensed observations (eg. space-based lidar winds) should yield significant further improvements in the timing and location of landfall and in the predicted intensification of hurricanes.
1. INTRODUCTION Each year hurricanes and other tropical cyclones cause thousands of fatalities and tens of billions of dollars of economic losses throughout the world. Severe examples included the tropical cyclone that killed more than 300,000 people in Bangladesh in 1970, and in the United States: the Galveston Hurricane of 1900, which destroyed the city and killed between 6000 and 8000 people; Hurricane Andrew, which caused monetary losses of 26.5 billion dollars (normalized to 38 billion dollars by inflation, wealth and population changes) in 1992 (Pielke and Landsea 1998); and hurricane Katrina, which killed more than 2000 people and resulted in losses in excess of 50 billion dollars. Even storms of much lesser intensity can produce significant loss of life and property, presenting a daunting challenge for hurricane forecasters and the communities they serve. The reduction of losses related to hurricanes involves many complex aspects ranging from purely theoretical, observational, computational and numerical, to operational and decisional. A correct warning can lead to proper evacuation and damage mitigation, and produce immense benefits. However, over-warning can lead to substantial unnecessary costs, a reduction of confidence in warnings, and a lack of appropriate response. In this chain of information, the role played by scientific research is crucial. Within the United States, the U.S. Weather Research Program (USWRP) is addressing this problem by coordinating research amongst federal agencies and academic institutions in order to reduce the landfall, track and intensity forecast errors, increase the warning lead time, and extend the time period for which hurricane and precipitation forecasts are useful. The National Oceanic and Atmospheric Administration (NOAA), in combination with NASA and other agencies, is contributing to these efforts through observational and theoretical research to better understand the processes associated with the formation, intensification and movement of hurricanes, and model and data assimilation development, and by conducting Observing System Simulation Experiments (OSSE) related to the development of new space-based observing systems. In this paper, we will report on recent experiments related to the impact of several relatively new types of remotely sensed data on hurricane prediction , on OSSEs related to the potential impact of lidar winds, and on the development of a next generation global model with potential to improve hurricane prediction on a variety of time scales.
Algorithms and Technologies for Multispectral, Hyperspectral, and Ultraspectral Imagery XII, edited by Sylvia S. Shen, Paul E. Lewis, Proc. of SPIE Vol. 6233, 62330U, (2006) · 0277-786X/06/$15 · doi: 10.1117/12.673221 Proc. of SPIE Vol. 6233 62330U-1
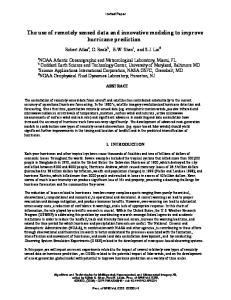
2. IMPACT OF TRMM/SSM/I, QUIKSCAT, AND AIRS Both NASA and NOAA have been exploring innovative ways to improve global analyses and forecasts using surface rainfall observations derived from space-borne microwave sensors such as TRMM Microwave Imager (TMI) and Special Sensor Microwave/Imager (SSM/I) and also by using surface wind observations derived from the SeaWinds scatterometer on board the Quikscat satellite and advanced sounding data from AIRS. TRMM data has proven to be especially useful in locating the precise center and in observing the three dimensional structure of tropical cyclones. This information, together with microwave observations from research aircraft, AIRS/AMSU, and Quikscat is contributing substantially toward an improved understanding of tropical cyclone formation and evolution. Results of the rainfall assimilation experiments show that variational assimilation of TMI and SSM/I rain rates using the moisture tendency of the forecast model as a control variable produces realistic tropical storm features that are usually not captured in global analyses. In studies of Hurricanes Bonnie and Floyd, incorporating rainfall data in the Goddard Earth Observing System (GEOS) global data assimilation system produces analyses that shows a distinct eye feature accompanied by a pronounced warm core in the mid-troposphere and stronger low-level winds. These features are characteristic of the cross-sections of hurricanes inferred from in-situ observations and represent significant improvements of the initial conditions for model forecasts. Figure 1 shows an example of the improved storm track prediction and quantitative precipitation forecast (QPF) for Hurricane Bonnie. The left panel shows that the 5-day storm track forecast initialized with the analysis, that included microwave rainfall data, is in much better agreement with the best track analysis obtained from the NOAA National Hurricane Center than is the control forecast that did not include the microwave rainfall data. The right panel shows the consistently higher Equitable Threat Scores (standard measure of precipitation forecast skill where 1.0 would be a perfect forecast and 0.0 represents no skill) for precipitation forecasts initialized by the analysis with rainfall data. These results clearly demonstrate the potential of using satellite rainfall information to improve the prediction of hurricanes and precipitation that accompanies them. Precipitation Forecast at Day 3 0.45
0.4
Hurricane Bonnie Storm Track Fonecast
0.35
0
03 0.25
0.2
0 U-
0
0.1 0.05 F
—90
—85
—80
—75
—70
LONGITUDE
—65
—60
—55
—50
Threshold (mm/day)
Figure 1. Improved storm track prediction and QPF Equitable Threat Scores for a 5-day forecast of Hurricane Bonnie initialized at 12:00 on 20 August 1998. Left panel: Red is the best track analysis from NOAA. Green is the control forecast from 1o x 1o GEOS analysis without rainfall data. Blue is the forecast from GEOS analysis with TMI and SSM/I surface rain rates. Right panel: QPF threat scores for the control experiment (blue) and the rainfall assimilation experiment (red). Results from experiments in which Quikscat surface wind data are assimilated also show a substantial increase in the ability to forecast storms over the oceans. Quikscat data often provides indications of the formation of tropical cyclones earlier than other observing systems. Marine forecasters currently use Quikscat data to improve the locations
Proc. of SPIE Vol. 6233 62330U-2
of meteorological features in weather analyses and to improve the predicted tracks of significant storms. The impact of QuikScat data on the numerical prediction of hurricanes was first examined in a research version of the NOAA National Centers for Environmental Prediction (NCEP) data assimilation system, as part of a joint NASA/NOAA project. Figure 2 shows SeaWinds surface wind data from Quikscat had an enormous beneficial influence on the amplitude and positioning of a mid-Atlantic hurricane (Cindy) in a 60 hour forecast.
Example of Hurricane Forecasting NCEP 60h forecast wlo Quikscat
NCEP 60h forecast with Quikscat
SaN
992
Verifying Analysis at 8/31/99 12Z
____
(
Fig. 2. Impact of QuikScat data in a test version of the NCEP operational data assimilation system. The verifying analysis is in the lower left panel. Note the greatly improved position and depth of the mid-Atlantic storm. The magnitude of the impact is shown in the lower right panel.
Figure 3 shows the magnitude and position errors of the mid-Atlantic storm shown at 60 h in Figure 2, Hurricane Cindy. This experiment shows that the assimilation of QuikScat data results in a substantial reduction of both magnitude and displacement errors with respect to the control run. The 60 h forecast with QuikScat data is more accurate than the 24 h forecast without QuikScat data. Following these initial experiments Quikscat data began to be assimilated operationally in real time at NCEP and has been contributing substantially t o the current accuracy of hurricane forecasting. The application of AIRS radiances or retrievals to hurricane prediction is at a much earlier stage of development. AIRS has been shown to produce very accurate measurements that can contribute substantially to improved numerical forecasts of atmospheric circulation and steering currents, but the coverage of AIRS data near the center of tropical cyclones is very limited. As an illustration of the potential of AIRS to improve tropical cyclone prediction, figure 4 shows forecasts for Tropical Cyclone Benni in the South Pacific, with and without AIRS temperature retrievals.
Proc. of SPIE Vol. 6233 62330U-3
In this case, AIRS contributes to a substantially improved 24-hour forecast of both the location and intensity of Benni. This result is extremely promising, but considerable further research and experimentation will be needed to optimize the application of AIRS to hurricane prediction and to determine the extent to which the assimilation of AIRS will improve forecasts of hurricanes in the North Atlantic. Prediction of Hurricane Cindy using QuikScat Data
25
20
0
15
QUIKSCAT
—
—— 2
24
3
48 F
L4b
Displacement Error
400
200
Foreccf Lergth
Fig. 3. Magnitude and displacement errors of Hurricane Cindy in the NCEP system over a 60 hour period. Impact of AIRS on 24hr Forecast of Sea Level Pressure Control 24hr Forecast
AIRS 24hr Forecast
NCEP AVN 24hr Forecast
Januaty 31, 2003 OOZ
Fig. 4 Twenty four hour forecasts and verifying analysis for Tropical Cyclone Benni: Control forecast (without AIRS) in upper left; forecast with AIRS in upper right; NCEP AVN forecast (without AIRS) in lower left; verifying analysis in lower right.
Proc. of SPIE Vol. 6233 62330U-4
3. THE POTENTIAL IMPACT OF LIDAR WINDS A series of Observing System Simulation Experiments (OSSE) are being conducted in order to determine the potential impact of space-based lidar wind profiles in current data assimilation/numerical weather prediction systems and to evaluate tradeoffs in lidar instrument design. In the experiments to be described here, the nature run (reference atmosphere) was generated using an early version of the Finite Volume General Circulation Model (FVGCM) at .5 degree resolution, and the assimilation and forecast system was the operational version of the GEOS 3 Data Assimilation System at 1 degree resolution. This nature run is substantially longer than earlier nature runs and covers a three and one half month period. In addition, the nature run contains very interesting and important meteorological features, including tropical cyclones and very realistic representation of atmospheric fronts and extratropical cyclone evolution. For later experiments, that will begin soon, a .25 degree version of the FVGCM will be used to generate the nature run. Following a very detailed assessment of the realism of the nature run and the differences between the nature run model and the assimilation/forecasting model, the entire OSSE system was validated through a comparison of parallel real data and simulated data impact experiments. Then parallel assimilation experiments and fourteen five-day forecasts were performed with this system to evaluate the impact of idealized space-based lidar wind profiles. As in earlier OSSE's, one of the major metrics for assessing the potential impact of lidar winds was the anomaly correlation for sea level pressure and 500 hPa height forecasts. In addition, a number of additional metrics, such as impact on the central pressure and displacement of cyclones or the landfall of hurricanes was also evaluated. The results of this evaluation agreed with earlier OSSE and showed a very substantial improvement in forecast accuracy resulting from the assimilation space-based lidar winds. In the Southern Hemisphere, average forecast skill was extended by 12–18 hours, while in the Northern Hemisphere, average forecast skill was extended by 3-6 hours. This was associated with a meaningful (10%) reduction in position error for all cyclones averaged over the globe and all time periods. For very intense cyclones (those with central pressure less than 945 hPa), the reduction of position error exceeded 200 km. A meaningful impact on the prediction of hurricane landfall was also observed. Figure 5 illustrates the improvement in hurricane landfall prediction as a result of assimilating lidar data. This result was obtained for the first hurricane in the nature run. The predicted landfall position error for the two tropical cyclones to hit the U.S. mainland in the nature run was improved by approximately 150 miles for both storms. These results demonstrate considerable potential for space-based lidar wind profile measurements to improve forecasts of hurricane track and landfall. PREDICTION OF HURRICANE 1 NePJeE
Sep 14, 1999 06Z — Sep IS, 1555 SSZ eeery6hrs
Fig. 5. Lidar impact on hurricane track prediction: X’s denote the nature track; Squares denote the forecast beginning 63 h before landfall using current data; Circles denote the improved forecast for same period using simulated lidar data.
Proc. of SPIE Vol. 6233 62330U-5
4. APPLICATION OF HIGH RESOLUTION GLOBAL MODELING Current global and regional models incorporating both in situ and remotely sensed observations have achieved a high degree of skill in forecasting the movement of hurricanes. Nevertheless, significant improvements in the prediction of hurricane landfall and intensification are still. To meet these needs, considerable research on new observing systems and better models and data assimilation techniques is being performed. These include the Hurricane Weather Research and Forecasting (HWRF) regional model development, as well as the development of a seamless global weather and climate model that can be used to improve short and extended range forecasts of hurricanes, as well as to determine the relationship between global climate change and long term variations in hurricane frequency and intensity. The objective of the latter activity is to develop a comprehensive global model that will explicitly resolve weather and climate relevant processes, in order to improve dramatically the use of space-based observations, and the application of these observations to the understanding and prediction of weather and climate. This will require (a) non-hydrostatic atmospheric dynamics on quasi-uniform grids defined by observed process scales, (b) explicit microphysics of clouds that represent observed cloud processes and their interactions with radiation, (c) ultra-high-resolution land surface model with process-scale dynamics, (d) an eddy-resolving ocean model, (f) coupled model evaluation and refinement based on high-resolution satellite observations, and (g) a common software environment to enable component model coupling, inclusion of observational constraints, and research community interaction. This next-generation model is evolving from the finite-volume General Circulation Model (fvGCM) for the atmosphere, which we had previously developed at the NASA Goddard Space Flight Center. Over the past two years, we have demonstrated substantial advances in the representation of hurricanes and other weather phenomena, as the resolution of the fvGCM has been increased. Figure 6-8 present examples of hurricane simulation and forecasting using the fvGCM, and reveal the potential for the next generation model that is under development at this time.
—4 —3
I'
05
20
Figure 6: A hurricane simulated by the fvGCM showing the hurricane eye, eye wall, and realistic spiral bands. The precipitation rate (mm/hr) is depicted with the color scheme on the right, and the wind (m/s) at the 850-mb level is shown with magnitude proportional to the arrow (20 m/s) at the bottom.
Proc. of SPIE Vol. 6233 62330U-6
OBSEPVED —4-—
FVDAS ANAL.Th —— FVCCM 5—DAY ORECA5T ——
tTrl
21 P4
4W
Figure 7: Validation of the finite-volume General Circulation Model (purple squares) and Data Assimilation System (blue crosses) with the observed track of Hurricane Floyd (red spiral spots). NASA frGCM Hr.icme Ivan Forecaat Track [Blacki and NHC Obccrved [Bine] and NHC Forecast IDa,hed] Maximam Santained Surface Wind Speed Ikrn,tu]
initialized 2004 SEP11 12Z
__ 34.
34.
64.
83. 96. 114. 13,
Figure 8: fvGCM 5-day forecast (at 0.25°�0.36° resolution, solid black curve) of the track of Hurricane Ivan in September 2004. Also shown are the observed track (solid blue curve) and the operational forecast track based on other models (dashed blue curve). Shading represents the fvGCMforecasted maximum sustained surface wind speed (knots), and shows the significant intensification of Hurricane Ivan from Category 1 to Category 4 prior to landfall.
Proc. of SPIE Vol. 6233 62330U-7
5. CONCLUDING REMARKS Research performed by NOAA at GFDL, AOML, and NCEP, in collaboration with NASA, and other government and university partners, has resulted in significant improvements to the prediction of hurricanes over the last several decades. These improvements have come about due to the application of remote sensing from both aircraft and satellites, the development of increasingly complex global and regional models, and research using these tools to improve understanding of hurricanes and the processes leading to their formation, intensification and movement. New space-based and aircraft remote sensing technologies and the development of the seamless weather and climate model based on finite volume dynamics, hold promise for further significant gains, that should enable substantial reductions in the uncertainties associated with hurricane landfall and intensity.
ACKNOWLEDGEMENT The authors wish to acknowledge Drs. Ghassem Asrar and Tsengdar Lee for their strong support for the initial development of the fvGCM and for their significant contributions to the application of satellite observations to hurricane and other weather prediction. We also wish to thank Jiundar Chern, William Putman, Mike Bosilovich, Kevin Yeh and John Radokovich for the contributions to the fvGCM, and Arthur Hou, Joel Susskind, Joe Ardizzone, Joe Terry, Eugenia Brin, Juan-Carlos Jusem, Dennis Bungato and Robert Rosenberg for their significant contributions to the application of satellite observations. Finally, I would like to acknowledge Dr. Frank Marks and the entire Hurricane Research Division of AOML for decades of dedicated research to advance the understanding of hurricanes.
Proc. of SPIE Vol. 6233 62330U-8