The Toboggan Sun Wayne P. S. Davidson and Siebren Y. van der Werf
Special variants of the Novaya Zemlya effect may arise from localized temperature inversions that follow the height profile of hills or mountains. Rather than following its natural path, the rising or setting Sun may, under such circumstances, appear to slide along a distant mountain slope. We found early observations of this effect in the literature by Willem Barents (1597) and by Captain Scott and H. G. Ponting (1911). We show recent photographic material of the effect and present ray-tracing calculations to explain its essentials. © 2005 Optical Society of America OCIS codes: 010.4030, 000.2850.
1. Historical Observations
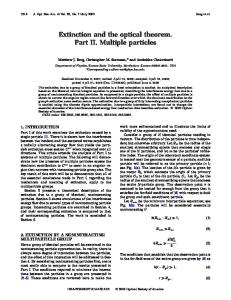
The Novaya Zemlya effect is caused by a temperature inversion. If the temperature gradient is strong enough, the radius of curvature of a near-horizontal light ray may locally become smaller than that of the Earth. An upwards traveling ray may be deflected into a down-going direction. This mirror effect is known as mirage or Luftspiegelung. An image of terrestrial objects, seen through such a mirage, is known as a Fata Morgana. When the temperature inversion stretches over a long enough distance, also celestial objects may be mirrored. This is the Novaya Zemlya effect. In earlier work, we have described the systematics of this effect1 and have given an explanation of its earliest recording, by Willem Barents in 1597.2 In the latter work, it has been conjectured that the effect may also occur over a distant mountain or hill. We used this hypothesis to explain the fact that Barents and his crew could follow Jupiter sliding over the central mountain range of Novaya Zemlya, although it was in reality even below the horizon.3,4 The situation is explained in Fig. 1. At the time of the true conjunction (arrow a), 00:14 UT, Jupiter’s true position is in line with the terminator (shadow edge) of the Moon, which for an observer would be the best indication of a conjunction in celestial longitude. But
W. P. S. Davidson is with Environment Canada, Box 127, Resolute Bay, Nunavut X0A 0V0, Canada. S. Y. van der Werf (
[email protected]) is with the Kernfysisch Versneller Instituut, Zernikelaan 25, 9747AA Groningen, The Netherlands. Received 3 December 2004; revised manuscript received 10 February 2005; accepted 15 February 2005. 0003-6935/05/275644-08$15.00/0 © 2005 Optical Society of America 5644
APPLIED OPTICS 兾 Vol. 44, No. 27 兾 20 September 2005
only around 02:00 UT (arrow b) does Jupiter’s apparent position show this line-up, which Barents’ crew must have been looking for. Barents used this observation as a “lunar distance” measurement avant la lettre: by comparing the time of the conjunction, as tabulated in the local time of Venice, with his own estimated local time, he deduced their longitude as 75° East of Venice. In reality, this longitude difference is only 46°, and this discrepancy has given rise to heated discussions and scientific activity during the eighteenth and nineteenth centuries, notably by Baills5 and before him by Lemonnier (quoted in Ref. 5). The riddle was, however, never really solved. In our earlier study2 and in the present work, we show that it is naturally explained by a nearly two-hour time delay, during which Jupiter had “tobogganed” along the hill slope before it appeared to be in conjunction with the moon. The toboggan effect may also have been observed by Captain Robert F. Scott. From the book of H. G. Ponting, The Great White South, on the 1910 –1913 polar expedition,6 we quote: “On August 17th (1911) the sun gilded the summit of Erebus and the highest peaks of the Western Mountains, and on the 20th was said to be above the horizon, but the mountain slopes obscured him from view. The 26th broke clear and calm, with a temperature of ⫺12 °F. It was a glorious day; and half an hour before noon Captain Scott invited me to accompany him to witness the first sunrise of the season. We walked out to the icebergs, climbed to the summit of one that had an easy slope, and breathlessly waited. Scott had timed things to a nicety. Within a few minutes a flame seemed to burst from the serrated lava ridge above Cape Barne; then the upper rim of the sun crept out, not rising but sidling along the slope. A few minutes more, and the blazing orb had cleared the land, and for the first time
Fig. 1. Conjunction of Jupiter and the Moon, 25 January 1597, as seen from Het Behouden Huijs in the northern direction. The calculated images are shown above the mountain ridge. Below the horizon, Jupiter’s true altitudes are given. The Moon, being higher, is little affected by refraction.
in more than four months we were bathed in his grateful rays. The world was once more golden.” Their camp was on Ross Island and they saw the Sun rise over the ridge of the Barne glacier, which is a remnant of a former lava stream from Mount Erebus, which ends in the sea to the North of the camp. Thus the Sun was seen to follow the down-slope of this ridge for some time, before it broke free of the inversion. It seems fair to attribute the first documented observation of the toboggan effect to Scott and Ponting. 2. Isotherms over a Mountain
Air masses that are forced upwards against a mountain slope cool down adiabatically. The effect derives from Bernoulli’s law. For dry air, the temperature drop is ⬃1 °C per 100 meters. The temperature is further decreased if the wind over the mountain is stronger than over the plain, though this effect is generally small. Considerably stronger cooling of the air just above the mountain may occur by heat conduction if the mountain is barren and the plain around it is snow covered and hence radiates less. Well above the mountain, the isotherms do not notice the effect of the ground profile: Wind equilibrates temperature and pressure along horizontal lines. The general picture that arises is schematically shown in Fig. 2. It illustrates that, above the mountain, the isotherms are compressed. This means that a mild temperature inversion over the plain (or sea) may give rise to a locally much stronger inversion over the hill.
Fig. 2. Schematic impression of isotherms over a mountain or hill, showing their compression over the top.
peninsula. Its end rises to a maximum of 129 m above sea level, and its width is ⬃3 m along the line of sight from the observer, who himself stands at 46 m above sea level. His distance to the top of Sheringham Point is ⬃15 m. By the end of March, the Sun sets just south of this cape or behind it. Sunsets were photographed using a Canon S20 Powershot camera, F2.9, in autofocus mode with fixed light intensity, and a Meade Maksutov–Cassegrain ETX90, D ⫽ 90 mm, F ⫽ 1250 mm, F13.8᎑mm telescope. The camera–telescope combination was adjusted horizontal with the aid of a bubble level. Horizontality was checked afterwards against a master background picture. Figure 4 shows the shape of the cape as seen from the local weather station of Resolute Bay. From the South, it rises smoothly from sea level to its top and then stays level before sloping down again. Sunset sequences on 28 –30 March 2004 and on 30 March 2003 have been brought together in Fig. 5. The
3. Observations at Resolute Bay, 28 –31 March 2004
We present in this section photographical material, taken at Resolute Bay (74° 43= N, 94° 57= W). The topographic situation is indicated in Fig. 3: To the WNW of Resolute lies Sheringham Point, the end of a
Fig. 3. Part of a topographic map, showing the place of the observer at the local weather station, just south of the airport, and Sheringham Point to the WNW. 20 September 2005 兾 Vol. 44, No. 27 兾 APPLIED OPTICS
5645
Fig. 4. Picture of Sheringham Point, taken on 8 October 2004 (photograph by Wayne Davidson).
images of the Sun are seen to follow the slope of the mountain in some cases. This is most evident in the
first image of 30 March 2003. The image with its flattened bottom is a standard example of the deformation caused by a rather strong inversion layer. It may be compared with shapes as presented in our earlier study on the systematics of sunsets and mirages.1 But here, the deformation effects follow the slope of the mountain. This is even true for the “Chinese lantern” fine structure across the Sun’s face. The same type of deformation is observed on 30 March 2004, first picture. Also in the pictures where only the upper rim is seen, the completely flattened shape is along the mountain slope. The middle pictures for 30 March 2004 show a very complex deformation, where the inversion appears to come in layers that, from right to left stepwise, bend along the slope of the hill. The last stripe of sunlight persists for a long time and is seen to slide along the mountain top. On 28 and 29 March 2004, the deformation of the Sun again indicates the presence of a low-lying inversion. The first picture of 28 March is explained as an inferior Novaya Zemlya mirage, as defined in Ref. 1. The flattened bottom of the first image is associated with the top of the inversion layer. As the Sun
Fig. 5. Sunsets over Sheringham Point on 28 –30 March 2004 and 30 March 2003 (photographs by Wayne Davidson). The exact shooting times are as follow (in UT): (28 March 2004) 01:26:32兾01:29:27兾01:29:52兾01:30:47兾01:31:24兾01:31:32. (29 March 2004) 01:23:14兾01:32: 13兾01:32:52. (30 March 2003) 01:31:40兾01:33:38. (30 March 2004) 01:31:40兾01:34:36兾01:34:45兾01:34:55兾01:35:52. For each picture, the true (geometrical) altitude of the Sun is indicated. 5646
APPLIED OPTICS 兾 Vol. 44, No. 27 兾 20 September 2005
Fig. 7. Ray-tracing example. The observer’s eye is at 48 m above sea level. Rays are followed over a hill with the approximate shape and height as corresponding to the top of Sheringham Point. Isotherms at the half- and quarter points of an assumed 5 °C temperature jump across the inversion are indicated as gray lines. The central isotherm is taken at 10 m above the top. Fig. 6. Temperature profiles at Resolute Bay, for the period 27–30 March 2004, measured by Environment Canada, Nunavut. Balloons are launched daily ⬃23:20 UT from the weather station (46 m above sea level). Data are transmitted every 10 s, corresponding to increments in height of ⬃50 m.
sinks further, its top flattens more and more but stays at the height that indicates the top of the inversion layer. In contrast to 30 March deformation characteristics, both 2003 and 2004, these are here completely horizontal and do not follow the mountain slope. This suggests that the region where the inversion is strong is farther away and lies well on the other side of the mountain. In the pictures for 28 March, also the twilight is visible. Associating the lower cutoff of the Sun in the first picture of that date with the top of the inversion, it seems that the twilight is only seen through the inversion layer. It would then appear that the inversion layer does follow the mountain slope, in contrast to the Sun’s direct image. In Section 5, we present simulations, where we also consider the twilight.
only ⬃130 m. For the Novaya Zemlya effect to occur, a temperature gradient in excess of 1 °C over 10 m is needed over an extended horizontal distance. When a considerable contribution to the refraction is made by the mountain, over a horizontal distance of only some 3 km, an even stronger local inversion is required. We argue above that the sunset pictures in Fig. 5 indicate the presence of a low-lying inversion. Only in the measured temperature profile of 30 March 2004 can it be seen, though only from the two lowest measured points. Yet, the sudden warming that occurred during the period 28 –30 March 2004 makes it likely that a low-lying inversion must have developed over land, as it had long been immersed in temperatures around ⫺40 °C. Soil probes at 5 cm below the gravel at the weather station show a lag of several days in temperature change as compared with a thermometer at 1.5᎑m height. This difference in temperature may easily amount to 5 °C, positive upon sudden cooling and negative for sudden warming. 5. Ray Tracing and Simulations
4. Temperature Profiles
Atmospheric conditions are measured daily at Resolute by balloons. The temperature profiles, recorded on 27–30 March 2004, are shown in Fig. 6. A significant warming of the entire atmospheric profile occurred over this period, and a smooth inversion of 8 °C extended over close to 1 km in height. This inversion is not steep enough by far to produce any of the deformations that are shown in Fig. 5. Sunsets calculated from these temperature profiles look quite normal. The balloon misses, however, a low-lying inversion, if present, because it is launched from a height of 46 m above sea level, and its next measuring point is
An example of ray tracing is presented in Fig. 7. The ground profile is explained above and can be read off from the topographic map in Fig. 3. The observer at Resolute Bay stands 46 m above sea level, and his eye height is taken as 48 m. The mountain has the height and width of Sheringham Point as measured along the line of sight over the mountain top, which is at 288°.0 true azimuthal direction. The global temperature profile is assumed to be that of 29 March 2004, in a suitably parametrized form. An additional low-lying inversion is assumed that follows the contours of the hill, as indicated by its isotherms. The full temperature jump across the inversion is taken as 5 °C, and the half-way point of this 20 September 2005 兾 Vol. 44, No. 27 兾 APPLIED OPTICS
5647
Fig. 8. Transformation curves for the cases: no additional inversion (dashed line): inversion centered at (a) ⬃140 m, (b) ⬃100 m, (c) ⬃60 m. In all cases the transformation curve is limited to the lower side by the hill side, which is taken 10 m below the central isotherm, hiso. This is the isotherm that marks the height of the maximal temperature gradient. See also Refs. 1 and 2.
jump is put at 140 m above sea level, which is 10 m above the top of Sheringham Point. Similar raytracing calculations have been made for inversions with heights of 100 and 60 m. These simulate the situations where the rays pass over the up-sloping southern edge of Cape Sheringham at different points. Computational techniques are the same as explained in earlier work.1,2,7 The results of these ray-tracing simulations are summarized in Fig. 8, which shows the transformation curve: the mapping of true altitude on apparent altitude. The dashed line applies to the case where the upper part of the temperature profile is just that of 29 March 2004. The effect of an additional lowlying inversion is a resonancelike dip at the apparent altitude that corresponds with the apparent inversion height above the ground profile. It is prohibitively complicated and computer-time consuming to make a full ray-tracing calculation for all cases that are presented in Fig. 5. Moreover, they could never be claimed to be realistic, because the low-lying part of the temperature profiles has not been measured. Hence we must proceed in a schematic way and parametrize the transformation curves. The adopted strategy is summarized as follows: (1) The global transformation curve is assumed to correspond to that of 29 March 2004. (2) A resonancelike dip is appended to this trans5648
APPLIED OPTICS 兾 Vol. 44, No. 27 兾 20 September 2005
Fig. 9. Three-dimensional impression of the transformation curves and their dependence on the lateral (azimuthal) viewing angle. The zero point of the azimuthal angle is chosen halfway up the slope of the hill, whose silhouette rises linearly from ⫺12⬘ to ⫹18⬘ apparent altitude over the azimuthal range 关⫺1°, ⫹1°兴. This silhouette is shown in the bottom plane. (top) The resonance dip is independent of the azimuthal angle, as on 28 and 29 March 2004. (bottom) The dip follows the hill slope and lies above it at all azimuthal angles.
formation curve, and it is parametrized by resonance(h) ⫽
D [1 ⫹ (h ⫺ h0)2兾2]
,
(1)
where h is the apparent altitude, h0 is the central position of the resonance, D is its depth, and is its width. The width may be taken different below and above h0 to make the resonance asymmetric, and we indicate them correspondingly by low and high. This
Fig. 10. Simulations of the sunsets and twilights on 28 and 30 March 2004. All boxes are 64 ⫻ 64⬘ in horizontal and vertical width, and the Sun’s position is centered at the middle of the horizontal scale. The hill is drawn as semitransparent to give an impression of the total image of Sun and twilight.
parametrization is realistic: It fits the resonance shapes of Fig. 5, and it agrees with the systematics that has been given in our earlier work,1 where we studied low-lying inversions over a flat landscape, i.e., in the absence of a hill or mountain. In the latter case, the resonance position, h0, is typically a few arcminutes negative and approaches 0 as the resonance deepens. Characteristic widths are high ⫽ 0⬘.5 ⫺ 1⬘.5; low is generally larger. The depth, D, depends on the steepness of the inversion and on its temperature jump and may be as large as ⫺60⬘. As the inversion gets stronger and steeper, the resonance dip will eventually broaden and look like a double resonance, one just above and one just below the true horizontal. We shall, however, base our analysis on single resonances only. (3) For each of the pictures, the accurate shooting time is known. The observer’s position is 74° 42= 31⬙ N, 94° 58= 23⬙ W. The true (geometrical) altitude of
the Sun and its azimuth (compass bearing) are calculated for each picture, using the Nautical Almanac tables.8 (4) The apparent height of the mountain is parametrized as linearly rising from ⫺12⬘ at 286°.0 azimuth direction to ⫹18⬘ at 288°.0 and level beyond. (5) The direct image of the Sun is obtained from the transformation curve, using its semidiameter of 16=, and is displayed in yellow. (6) Twilight is caused by multiple Rayleigh and Mie scattering with the constituent particles of the atmosphere. This gives rise to a light intensity that decreases as one looks farther away from the Sun. When the Sun has set, this scattered light’s upper segment, which is least affected by absorption, is seen as the twilight glow, or, in German, “klarer Schein” or “helles Segment.” When it is brighter than usual, the Inuit call it “ulluq qaumayuq.” The presence of small particles like dust, tiny water drops, or ice crystals 20 September 2005 兾 Vol. 44, No. 27 兾 APPLIED OPTICS
5649
may enhance the contrast between the region in the direct vicinity of the Sun and that farther away. We propose that, near the Sun, the combined effect of refraction and scattering may still be approached by ray tracing. As sources, we take orbs around the image of the direct Sun, which, with the number of scatterings, increase in diameter and decrease in luminosity. In the present simulation, we estimate the effect of an inversion layer on this twilight glow by including the images for a 24= and a 32= semidiameter orb around the Sun and display these in orange-red and purple, respectively. Absorption is not included in these calculations. For the simulations, we adopt the following parametrizations [see Eq. (1)]: (28 March 2004) D ⫽ ⫺30⬘, low ⫽ 2⬘.5, high ⫽ 1⬘.5, h0 ⫽ ⫺2⬘ ⫽ constant. (30 March 2004) D ⫽ ⫺15⬘, low ⫽ 4⬘.0, high ⫽ 1⬘.5, h0 ⫽ ⫺2⬘ at azimuth 286°.0, linearly rising to ⫹19⬘.0 at 288°.0 and constant beyond. These values are all realistic, but their choice is by no means unique. The important issue is that we make the temperature profile independent of the mountain height profile for 28 March, whereas for 30 March we adopt a linear rise that makes the resonance dip lie just above the mountain edge for all lateral viewing angles. Mutatis mutandis, the 28 March simulation applies equally to 29 March, where the deformation characteristics are also purely horizontal, whereas the 30 March simulation may be compared with the pictures taken on that date, both in 2003 and in 2004. A three-dimensional impression of the resulting transformation curves and their dependence on the lateral viewing angle is shown in Fig. 9. It also shows the hill silhouette, which is used to block from view the part of the calculated image that is behind it. Figure 10 shows our simulations: left for 28 March 2004, right for 30 March 2004. For the purpose of assessing the entire image of the Sun and the twilight, we have drawn the hill as semitransparent. In the first images of the 28 March simulation, the dark band across the Sun’s face indicates the position of the resonance dip. This is Wegener’s dark band. As the Sun sinks further, at the same time moving towards the hill and partially behind it, the part above the dip flattens more and more, while the part below it grows. When the two join, this gives rise to the anvil shape that is also seen on 29 March (see Fig. 5). Finally the direct image of the Sun is blocked by the hill, but the twilight can still be seen. Towards the left it levels off to the height of the dip, as it should, whereas directly above the Sun’s position it is higher. This is the effect alluded to in our discussion on Fig. 5, above. The twilight seems to follow the hill’s contours, but it would be wrong to identify its upper boundary with an isotherm everywhere. In the simulations for 30 March 2004 and also on the same date of 2003, the inversion has been made to 5650
APPLIED OPTICS 兾 Vol. 44, No. 27 兾 20 September 2005
follow the hill’s contours. Its effect is that the flattened bottom of the Sun follows approximately the hill’s slope. It does not do so exactly, because the hill rises from ⫺12⬘ to ⫹18⬘, while the isotherms are made to go from ⫺2⬘ to ⫹19⬘, thus exhibiting a lesser slope. The width parameter low has been chosen larger than for 28 March, so that the part below the resonance dip is suppressed to lower altitudes and is blocked out of sight by the hill in the first image. As the Sun sinks, this lower part gradually moves into sight, giving rise again to an anvil shape, but this time skewed. At the top of the hill the direct image remains just visible, and it moves to the right over quite a distance before disappearing. The twilight was not actually visible on this date (Fig. 5) but has nevertheless been included here to show that it also exhibits the same signs of deformation as the direct image.
6. Summary and Conclusion
Pictures taken at Resolute Bay of sunsets over Sheringham Point show that the deformation characteristics may follow the slope of a hill. This is made possible when a low-lying inversion layer smoothly follows the hill’s contours. The inversion may be stronger over the top, and compression of isotherms enhances its steepness. Favorable circumstances for observing the effect exist during a period of sudden warming of the atmosphere: the ground warms up slower, and an inversion layer is formed mostly by heat conduction. We have presented ray-tracing calculations and simulations that reproduce the essential features of these inversion characteristics. A consequence of this model is that the Sun may indeed follow the slope of a distant hill over a long stretch, rather than following its natural path. We have named this the “toboggan effect.” The first documented observation has probably been made by Captain R. F. Scott and H. G. Ponting in 1911. An earlier observation, where the observers did not recognize the toboggan effect as such, is the displaced moon–Jupiter conjunction on 25 January 1597, seen by Willem Barents and his crew on Novaya Zemlya. They used this observation to establish their longitude, which was off by nearly 30°. This has remained a mystery for four centuries, despite intensive scientific effort. In an earlier study,2 we used the concept of an inversion layer following the contours of the mountain to explain the nearly two-hour delay of this conjunction and found that Barents’ observations were true. In the present work, we amend to this investigation and show that the toboggan effect forms the solution of this ancient riddle. The authors wish to thank Shirley Sawtell of the Scott Polar Research Institute for her help in finding the text and reference of the Scott–Ponting observation.
References 1. S. Y. van der Werf, G. P. Können, and W. H. Lehn, “Novaya Zemlya effect and sunsets,” Appl. Opt. 42, 367–378 (2003). 2. S. Y. van der Werf, G. P. Können, W. H. Lehn, F. Steenhuisen, and W. P. S. Davidson, “Gerrit de Veer’s true and perfect description of the Novaya Zemlya effect, 24 –27 January 1597,” Appl. Opt. 42, 379 –389 (2003). 3. G. De Veer, Waerachtige Beschryvinge van drie seylagiën ter werelt noyt soo vreemdt ghehoort, C. Claesz, ed. (Amsterdam, The Netherlands, 1598). 4. G. De Veer, The True and Perfect Description of Three Voyages, so Strange and Woonderfull That the Like Hath Never Been
5.
6. 7. 8.
Heard of Before; translation of Ref. 1 by W. Philip, ed. (Pauier, London, 1609). M. Baills, “Sur les phénomènes astronomiques observés en 1597 par les Hollandais à la Nouvelle-Zemble,” presented by M. Jurien de la Gravière, Comptes rendus hebdomadaires des séances de l’Académie des Sciences, Vol. LXXX48I, No. 23 (6 December 1875) (submitted for the sections of Astronomy, Geography and Navigation). H. G. Ponting, The Great White South (Duckworth, London, 1921). S. Y. van der Werf, “Ray tracing and refraction in the modified US1976 atmosphere,” Appl. Opt. 42, 354 –366 (2003). The Nautical Almanac (Her Majesty’s Nautical Almanac Office, London, and the Nautical Almanac Office United States, Washington, D.C., 2003 and 2004).
20 September 2005 兾 Vol. 44, No. 27 兾 APPLIED OPTICS
5651