58
3
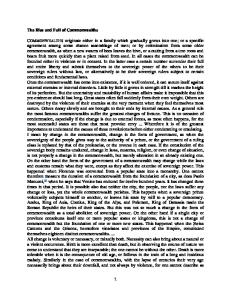
The rise and fall of world food prices
1
Martin Banse, Peter Nowicki and Hans van Meijl
3.1
World agricultural prices in a historical perspective World agricultural prices are very volatile, which is due to traditional characteristics of agricultural markets such as inelastic (short run) supply and demand curves (see Meijl et al., 2003).2 The volatility is also high because the world market is a relatively small residual market in a world distorted by agricultural policies.3 The combination of high technological change and inelastic demand have caused real world agricultural prices to decline in the long run (a hundredyear trend). Figure 3.1 demonstrates this long-term trend of declining real agricultural world prices and it seems that this trend has weakened since the mid80s. Figuur 3.1
Development of World Agricultural Prices, 1960-2008, USD/tonne, in constant USD (1990)
2000 1500 1000 500 0 1960
1965
1970 Maize
1975
1980
Wheat
1985 Rice
1990
1995 Palmoil
2000
2005
Soybeans
Source: World Bank data base (2009).
59
1 This document is financed by the Dutch Ministry of Agriculture, Nature and Food Quality. It is based on internationally published literature, own research and consultations with experts in the field of world agriculture market analysis. We consulted the following experts: Gerrit Meester (LNV), Patt Westhoff (FAPRI), Pierre Bascou (EC), Catherine Benjamin (INRA), Loek Boonekamp (OECD), Ron Trostle (ERS/USDA), Pavel Vavra (OECD), Willie Meyers (FAPRI) and Pierre Charlebois (Agriculture and Agri-Food Canada). 2 'World food prices are instable and will remain unstable in the future. Forecast errors are large in predictions of world prices. There are always unexpected events in important drivers such as yields which are dependent on weather, plagues and diseases'. See, Meijl, H. van et al. (2003: p 11). 3 Trade share (2006) in global production: rice (7%), cheese (7%), coarse grains (11%) and wheat (20%), FAO Statistics.
The price increase since 2005 was strong, but even with the increase that we have observed in the 2005-2008 period, real agricultural prices are still low compared to the peaks in prices of the mid-70s. Local prices are linked with these world prices. The transmission effect depends on the transparency of markets, market power and accessibility. Figure 3.2 depicts the recent rise and fall of the price index for cereals and food commodities along with an index for the average of all commodities and indexes for fuel, non fuel and copper. Although the food commodity index has risen considerably until mid-2008, the index for all commodities has risen much more. Cereal prices grew much faster than food prices and grew in line with the index for all commodities. The rise in copper and fuel prices was even much higher (four times higher than in 2000). In this perspective, the recent rise in food commodity prices is moderate. Furthermore, Figure 3.2 shows that since mid-2008 the prices dropped even quicker than they rose to a level that is above the level in 2000. Figuur 3.2
Price index of fuel, food and all commodities, 2000-2010, 1st Q 2000=100 a)
a) Indexes are in US dollars Source: IMF..
Figure 3.3 shows that spot prices for many (major) agricultural commodities have risen quickly from 2007 until mid-2008 (see Figure 3.1). Spot prices declined rapidly since early 2008 for wheat and since mid-2008 for soybean, corn and crude oil. Recently the price for crude oil and soybean went up a bit, while the prices for wheat and corn kept falling. 60
Figuur 3.3
Daily Price Notations for crude oil, wheat, corn and soybeans; spot prices, 2005-2009, at current USD
700 600 500 400 300 200 100 0 2005
2006
2007
Crude Oil, $/bbl
2008
Wheat, $/mt
2009
Maize, $/mt
Soybeans, $/mt
Source: World Bank data base (2009) from January 1, 2005 to September 10, 2009.
Figure 3.4 shows the development in world dairy prices. We see the peak in 2007-2008 for all dairy products and the very low recent prices. Since mid2009 there have been some first signals that the world dairy price is recovering a bit. A comparison of Figure 3.2 and Figure 3.4 shows that unlike for most other products, the peak in 2008 has not been exceptionally high for Cheddar cheese and butter since 2000. Figuur 3.4
Monthly price notations for milk, butter, non-fat dry milk and cheese; two-week average prices, 2001-2009, at current USD, Jan 2000 = 100
250 200 150 100 50 0 2000
2001
2002 Butter
2003
2004
Non Fat Dry Milk
2005
2006
2007
Cheddar Cheese
2008
2009
Fluid Milk
Source: USDA Agricultural Marketing Service (2009), downloaded from http://future.aae.wisc.edu/index.html, October 2, 2009.
61
Although real food prices are not extremely high in a historical perspective, and other commodity prices have risen more, an increase in the price of food a basic necessity - causes hardships for many lower income consumers around the world. This makes food-price inflation socially and politically sensitive. This is why much of the world's attention is still focused on the increase in food prices in 2008 (Figure 3.3).
Price volatility Table 3.1 and Figure 3.5 indicate that the volatility of agricultural as well as nonagricultural prices has increased over time. The standard deviation of selected agricultural commodities increased sharply in 2006, 2007 and 2008. There are indications that the volatility - measured in standard deviation - also declined with the slowdown of the absolute price level in 2009, see Table 3.1. Table 3.1
Annual deviation of commodity prices (annual standard deviation), 2000-2009 Wheat
Corn
2000
27.8
22.7
25.6
3.5
2001
14.2
9.2
27.5
3.4
2002
73.7
24.7
54.6
3.0
2003
30.7
12.2
72.6
2.5
2004
22.2
46.2
187.2
5.7
2005
29.7
14.5
58.4
6.2
2006
39.2
53.2
39.7
5.8
2007
151.7
34.6
134.7
11.9
2008
200.4
100.5
221.3
28.9
63.4
33.3
109.7
11.2
2009 a)
a) January 1 until September 10, 2009. Source: World Bank Data base (2009), daily price notations.
62
Soybeans Crude Oil (Brent)
Figuur 3.5
Volatility of commodity prices, 1995-2008
Input prices World prices developments for nitrogen and phosphate are shown in Figures 3.6 and 3.7, respectively. Like in the case of agricultural prices we see an enormous increase followed by an even sharper decline. Input prices peaked at the end of 2008 and therefore later than agricultural prices, which peaked early 2008 (wheat) or mid 2008 (corn, soybean). Therefore input prices follow output prices. The high agricultural prices in 2007-2008 induced higher production by an increase in area and increased intensification. Both effects lead to higher demand for inputs. As fertiliser industry production and distribution were unable to keep up with demand, prices increased sharply. When the input prices were so high agricultural producers substituted away from more expensive inputs to e.g. GMO crops and the use of less inputs. Input prices follow output prices with a time lag. The period of high food prices and still lower input prices induced high profits in agriculture. The period of lower food prices and still high input prices had a strong negative impact on farm profitability in that period.
63
Figuur 3.6
Price Development of Nitrogen (Urea), 2006-2009, USD per tonne
Remark: $pt = USD per tonne. Source: FertReports Archive (2009). www.fertiliserworks.com/fertreport/
Figuur 3.7
Price Development of Phosphate Fertiliser, 2006-2009
Remark: DAP is Diammonium phosphate, $pt = USD per tonne, CFR is standard of performance Source: FertReports Archive (2009). www.fertiliserworks.com/fertreport/
64
3.2
Long-run effects
3.2.1 Long-run drivers of demand Population and macro-economic growth are important drivers of demand for agricultural products. In past years, rapid population growth has accounted for the bulk of the increase in food demand for agricultural products, with a smaller effect from income changes and other factors (Nowicki et al., 2006). The world's population growth will fall to about 1% in the coming ten years, although total population will continue to mount for a few decades. Continued economic growth is expected over the coming period in almost all regions of the world and this driver of demand will become more important than population growth in the future (Figure 3.8). Figuur 3.8
World population and GDP growth (annual growth %)
8
Population
7
GDP
6 5 4 3 2 1 0 -1 1970- 1990
1990- 2005 EU15
2005- 2020
1970- 1990
EU10
C&S A mer
HDC
1990- 2005 A sia
2005- 2020
A f rica
Source: USDA (2009a) and (2009b). HDC = High Income Developed Countries, C&S Amer = Central and South America
Expected population developments in period 2005-2020 The world's population growth will fall from 1.4% in the 1990-2003 period to about 1% in the coming ten years. This is mainly due to birth or fertility rates, which are declining and are expected to continue to do so. Almost all annual population growth will occur in low and middle income countries, whose population growth rates are much higher than those in high income countries. Europe's share in world population has declined sharply and is projected to continue declining during the 21st century as population growth in Europe is very low (0.3% 65
yearly for EU-15: old EU member states) or slightly negative (-0.2% for EU-10: new EU member states). The uncertainty with regard to birth and death rates at world or regional level is not too large. However, migration flows between countries and regions are much more uncertain.
Global Income growth Economic growth is expected over the medium term period in almost all regions of the world (see Figure 3.8) but is expected to be considerably higher for most of the transitional and developing countries than for the EU-15, the United States and Japan, in particular for Brazil, China, India and the new EU member states. Incomes in Europe are expected to increase slightly over the coming years. The annual income growth in Europe is expected to be about 1.3% for EU-15 and 3.4% for EU-10. World and EU economic growth in the future stays uncertain and depends on the amount of investments in education and research, on technological opportunities, on the degree of (labour) participation in the political, societal and market arenas, and on the liberalisation of world commodity and factor markets. The expected robust growth of income per capita leads to more 'luxury' consumption in developed countries. This implies more convenience food, processed products (ready to eat) and food safety, environmental and health concerns. In developed countries the total amount of food consumed will only grow in a limited manner. However, in developing countries a higher income induces more consumption and a shift to more value-added products. Important is the switch from cereals to meat consumption, as an increased demand for meat induces a relatively higher demand for grain and protein feed. To produce 1 kg of chicken, pork and beef, respectively 2.5 kg, 4 kg and 7 kg of feed are required (Ephraim Leibtag, 2008).1 Urbanisation and the migration of people from rural to urban regions is also an important driver of demand which leads for example to a higher meat consumption.
Long-term drivers of supply With regard to crop production, yield and area developments are important drivers of supply. Figure 3.9 shows that production growth these past decades was almost totally determined by yield increase while the total area harvested 1
66
The numbers describe upper-bound estimates of conversion rates: 7 kg of corn to produce 1 kg of beef, 6.5 kg of corn to produce 1 kg of pork, and 2.6 kg of corn to produce 1 kg of chicken. Modern technology, however, requires much less feed especially in pork production; here average feed conversion rates are between 3.2-2.6 kg of feed per kg of meat.
was more or less constant. The growth in yields declined from 2% per year in the 1970-1990 period to 1.1% in the 1990-2008 period. USDA expects the growth to decline to 0.8% per year for the period 2009-2017 (USDA 2009c, 2009d). At the global scale, crop production area increased in the 1970-2007 period by 0.15% per year, and USDA expects the area to grow by 0.4% per year in the period 2007-2017. We have to remark that the yield growth in absolute figures (tonne per acre) is more or less constant over time. Figuur 3.9
Development and projection of world grain and oilseed production, 1970-2017
Index (1970=100)
260 240 220 200 180 160 140 120 100 80 1970
1975
1980
1985
1990
1995
2000
Production
Yield
Percap production
Area harvested
2005
2010
2015
Population
Source: USDA 2009c, 2009d.
The growth rates of yields for major cereals in developing countries are slowing. It should be mentioned again that the decline in annual growth rates is not necessarily related to a decline in absolute yield growth per annum. An important explanation for the decreasing yield growth rates might be the declining public agricultural research and development spending over time in both developing and developed countries (Pardey et al., 2006). Although private sector research has grown, private sector R&D is mostly cost reducing/short-run oriented instead of public R&D, which is often more yield enhancing/long-term oriented. 67
The direct link between R&D spending and yield growth had been intensively discussed amongst agricultural scientists and is not fully clear. The general outcome of this discussion is that an additional growth in yields requires not only basic R&D and capital stock, but also additional spending in investment in human capital stock (education), extension services, chain efficiency and improvements in market institutions (governance).
3.3
What explains the recent rise and fall in agricultural prices? The sharp increase in world prices could be explained by a combination of record low global inventory levels, weather induced supply side shocks, surging outside investor influence, record oil prices and structural changes in demand for grains and oilseeds due to biofuels (Banse et al., 2008). In this section we study the causes of the price increase as well as the causes of the sharp decline in world prices since mid-2008.
Effects on the supply side
68
A poor harvest in Australia, Ukraine and rest of Europe for wheat and barley was one of the causes of the increase in prices. According to FAO statistics, these three regions contributed on average 51% of total world barley production and 27% of total world wheat production for the period 2005-2006. Certainly one of the main reasons of the decrease in prices has been the bumper harvest in 2008/2009. Favourable weather conditions and a larger than expected supply response last year were two key causes of the increase in production. Higher prices induced higher production and this leads eventually to lower prices. Higher energy prices lead to higher food prices as costs (e.g. fertiliser, processing, and transport) increase. Higher transport costs induce higher price effects as distances increase. The sharp decrease in oil prices since mid 2008 (see, Figure 3.2) led to lower prices as production and transport costs declined; Tight credit due to the recession does not seem not to be an important factor in the farming sector as the period with high prices increased the equity-debt ratio for farmers. CAP policies such as a mandatory set-aside regulation or production quota restrained supply. Furthermore, there was a change from price to income support and compensatory payments became decoupled, set aside was introduced and export subsidies were diminished. Some of these measures limited supply within the EU; However, the general aim of the last CAP reforms was an enforcement of farmers' ability to react to market signals instead of following pol-
icy signals given by market price support. Measures aimed to restrict supply, e.g. production quota or set-aside requirements, are instruments designed for a world with declining prices, but which may act to reinforce prices in case of food shortages. Low prices in the last decades did not provide an incentive to invest in productivity enhancing technologies. The increase in prices was too short to turn this trend around. Table 3.2 shows a strong increase in the 2008/09 production of grain, especially for wheat and barley. While an increase in area sown for wheat and an increase in yields contributed to the bumper harvest in wheat, the barley and corn area declined (at the expense of wheat). For the next year world grain production is expected to decline mainly due to slightly lower yields compared to the 2008/09 level. Table 3.2
World crop production - production, area and yields: 2007/08-2009/10 Production (%)
Area (%)
Yields (%)
2008/09
2009/10
2008/09
2009/10
2008/09
2009/10
vs
vs
vs
vs
vs
vs
2007/08
2008/09
2007/08
2008/09
2007/08
Grain
5.0
-1.9
Wheat
11.7
Corn
-0.3
2008/09
0.3
0.1
4.7
-2.0
-3.4
3.1
0.3
8.6
-3.7
0.8
-2.2
0.6
1.9
0.2
15.7
-7.3
-3.8
1.3
19.5
-8.6
Rice
2.7
-2.6
1.1
-2.0
1.6
-0.6
Oilseeds
0.7
7.2
4.1
1.8
-3.5
5.3
Soybeans
-4.8
15.0
6.1
3.5
-10.8
11.4
Rapeseed
20.3
-2.8
8.5
3.3
11.7
-6.0
Sunseed
20.7
-2.1
9.5
0.9
11.2
-3.0
Barley
Source: Toepfer International Market Review, 21 August 2009. 2008/09 = Estimate, 2009/10 = Forecast
The low increase in global oilseed production is mainly due to poor harvests and export policies of soybeans in South America in 2008. In 2010 oilseed production, however, is projected to be more than 5% higher than in 2009.
Effects on the demand side The demand in Europe and Northern America is constant; in Asian countries the demand will increase in the long run due to income growth and diet changes. In
69
the short run demand is weakened due to the economic crisis. This weakness is expected to continue for the next few years and will put a downward pressure on agricultural prices. However, primary agriculture is quite resilient to lower income relative to other sectors due to the inelastic demand for agricultural products (see, also section 4 for some quantitative estimates). The impact of lower economic growth on luxury and processed products is higher. Additional demand for biofuels: - 5% of global oilseed production is processed to biodiesel or is used directly for transportation; - 4.5% of global cereal production is used for ethanol production; - Therefore, this extra demand triggered the markets during the price increase and might keep current prices above the 2005-2007 level; - However, biofuels are not new. Ethanol based on sugar cane exists in an economically profitable way in Brazil for a long time; - Increasing food and feedstock prices make biofuels less profitable and food more profitable. The current drastic decrease in oil prices and the relatively lower decrease in agricultural prices makes biofuels even less economic viable. The additional demand is therefore coming only from the biofuel policies, such as the EU Renewable Energy Directive.
Development of Stocks The trend of a declining stock to use ratio as described in Figure 3.10 has increased and stocks for wheat are currently running on empty. This implies that all the shocks mentioned above could not be mitigated by using stocks but lead immediately to price increases (see FAO, 2009:17). Furthermore, it enabled speculation; with stocks available there would have been less room for speculation.1 Currently stocks are recovering but still low. Whereas the causes of the 2008 price spike are documented - a production shortfall because of unfavourable growing conditions, coupled with priceinsensitive demand for biofuels - the role of investments in agricultural derivative markets is also noted by the OECD, along with the absence of a sufficient buffer in the form of grain reserves. The OECD (2008: 5) notes that in the current situation 'Stocks [of wheat] are not expected to be fully replenished over the coming ten years, implying that tight markets may be a permanent factor in the period to 2017' and this 'provides the background for more price volatility in the
1
70
A US Senate report, dated 24 June 2009, determined that index investments in the Chicago wheat futures market between 2005 and 2008, had caused unwarranted price changes in the order of a ten-fold increase in the average difference between the cash and futures price at contract expiration over the four-year period.
future.' Furthermore, a 'general point concerning price volatility relates to the 'thinness' of markets, or the small share of imports and exports relative to the size of global consumption or production.' Figuur 3.10
Development of stock to use ratio, 1960-2009
50% 45% 40% 35% 30% 25% 20% 15% 10% 5% 0% 1960
1965
1970
1975
1980
1985 Corn
1990
1995
2000
2005
Wheat
Source: USDA (2009c).
Policy Responses to Rising Food Prices The first response to the rapidly increasing world prices for food grains, feed grains, oilseeds, and vegetable oils, which were causing domestic food prices at the consumer level to rise in many countries, was to take protective policy measures designed to reduce the impact of rising world food commodity prices on their own consumers. In the fall of 2007, some exporting countries made policy changes designed to discourage exports so as to keep domestic production within the country. The objective has been to increase domestic food supplies and restrain increases in food prices. However, such measures typically force greater adjustments and higher prices onto global markets.
Effects of the Credit Crisis Whereas the credit crisis has little impact on farm operations directly - although the investments in equipment and supplies may be restrained and the covering of operating costs between planting and sales may become more onerous - it is trade credit constraints beyond the farm-gate that are affecting the agri-food sector. The OECD-FAO Agricultural Outlook 2009-2018 (OECD, 2009) highlights that financing of trade transactions not only between OECD and non-OECD countries has become more difficult, but even within the OECD, within the EU, and even within a country itself suffers from credit access difficulties. Trade credit has become a critical issue for firms that are focused on trade in bulk commodi-
71
ties and semi-processed products. Some firms that are financially sound have to reduce or even stop their activities. Note is made of African agri-food processing firms that no longer have access to imported supplies. With regard to repercussion on export, a Danish firm that has difficulties with trade in dairy and pork is given as an example of an increasingly current phenomenon, which is that the lack of trade finance availability in importing countries has an upstream impact through the reduction of markets for exporters. Some companies are experiencing that export credit insurance is no longer available, in particular for sales to particular trading partners depending on their country of operation. So demand down-stream from the farm-gate is decreasing because of the contraction of trade generally, and within the agro-sector in particular.
USD exchange rate developments World prices are denominated in dollars and the dollar depreciated against most currencies. The increase in prices in other currencies is therefore much less. This will benefit the consumer for those countries whose currency is not pegged to the dollar, such as the European Union, but has a variable impact for both consumers and producers in countries which are obliged to float their currencies. Also, price movements in commodity markets have not been equal around the world. Producers in tropical countries - where cocoa, coffee, tea and cotton are the main export products - have benefited less from price increases in the past than producers in temperate countries, where the main export products are grain and oilseeds and who benefit from the food/energy linkage that has such a strong influence on these commodity prices.
Speculation
72
The impact of speculation on the current spike in agricultural prices is difficult to quantify. A formal assessment is hampered by data and methodological problems, including the difficulty of identifying speculative and hedging-related trades. A number of studies seem to suggest that speculation has not systematically contributed to higher commodity prices or increased price volatility, however, in recent reports find an impact of index trading and futures prices: - For example, an IMF staff analysis (IMF, 2006) shows that speculative activity tends to respond to price movements (rather than the other way around), suggesting that the causality runs from prices to changes in speculative positions; - Bange (2008) has argued that speculation may have reduced price volatility by increasing market liquidity, which allowed market participants to adjust their portfolios, thereby encouraging entry by new participants;
-
The US Senate (2009), however, released a report on 24 June 2009 on Excessive Speculation in the Wheat Market, with the finding that index traders having purchased huge numbers of wheat contracts on the Chicago exchange - increased futures prices relative to cash prices, and thereby created unwarranted costs and risks for wheat farmers, grain processors and consumers; the conclusion is a clear case of speculative money overwhelming a market.
3.4
First quantitative results of the analysis of key driving factors Demand for food is basically inelastic, and therefore the agri-food sector is more resilient than other sectors in the present crisis. But there are risks on the demand-side in the form of contraction of trade, in general, and through some change in diet, as some commodities - namely dairy and meat - have a higher elasticity of demand than others. Decline in real income will of course have repercussions in the quantity of consumption of even basic foods in the lowerincome countries, and trade-related consumption will be dampened by the contraction of international trade. Agricultural commodities have outlets beyond human consumption, however, so the demand-side is a composite of food, feed, fiber and food requirements. In this larger perspective, it is important to look at demand as being influenced both by GDP per capita and by energy prices, as energy prices and agricultural prices are more tightly connected (energy prices determine the economic viability of biofuels, but are also transmitted to agricultural inputs on one end of the agricultural commodity production cycle, and to freight charges on the other end). Due to the economic crises the projections for GDP growth declined for the EU-15 from 2% per year to about 1.3% per year for the 2005-2020 period (USDA 2009b). For the EU-10 the expected growth declined from 3.8% to 3.4%. For highly industrialized countries the projected GDP growth declined from 3% to 2% per year. For Asia and Africa the projected GDP growth rates are not much lower. The OECD (2009) has performed a sensitivity analysis to take into account an even more severe inflection of GDP growth caused by the current economic recession in respect to the provisional baseline established by OECD: the alternative scenarios are (1) a rapid recovery period versus (2) a prolonged recovery, in the period 2009 to 2018 (Figure 3.11). The results show that prices of all commodities would drop below their baseline levels (Figure 3.12 and Figure 3.13). Crop products and biofuels show less elasticity of demand than dairy and
73
meat products. The simulated price decline due to lower GDP growth is therefore much lower than for livestock products. In the case of biofuels, the response is even less pronounced than for crop products, because of the policyset mandates. In terms of crop products, those which are more predominant as part of the diet of lower income countries witness the greatest impact of greater contraction of GDP than in the baseline. The exception in elasticity in higher income countries concerns sugar, which is more sensitive to income levels. Figuur 3.11
Stylised depiction of economic downturn and two alternative recovery assumptions relative to baseline (left panel), and aggregate annual income growth assumptions for OECD and non-OECD regions across scenarios (right panel)
74
Figuur 3.12
Percentage change in biofuel and crop prices with lower income growth in alternative GDP scenarios compared to baseline levels
0 -2 -4 -6 -8 -10 -12 -14 -16 -18
Ethanol Biodiesel Wheat
Maize
Rice
Oilseeds Oilmeals Vegetable Raw oil sugar
2009-10 full
White sugar
2018, slow
Source: OECD (2009) p. 36.
Figuur 3.13
Percentage change in meat and dairy prices with lower income growth in alternative GDP scenarios compared to baseline levels
0 -2 -4 -6 -8 -10 -12 -14 -16 -18
Beef
Pork
Poultry
Butter
2009-10, slow and faster
Cheese
SMP
WMP
2018, slow
Source: OECD (2009) p. 37.
A second sensitivity analysis was with regard to a lower oil price, a severe cut in the USD price per barrel. Here it turns out the crops are much more sensitive to the price of crude oil than livestock products. The price transmission that increases the cost of livestock production is much less than for crops. With regard to crops, price transmission affects fertiliser, chemicals and fuel prices, because of the high energy share in total production costs. For livestock, the co-production of dried distillers' grain (DDG) with biofuel production serves to
75
counter-balance increases in the crop-based feed prices through substitution; and the part of energy in total production costs is in general lower.
Effects of GDP growth rates around the world The current economic crisis also reveals how fragile different regions of the world are with regard to the impact of GDP changes on agricultural production. In a sensitivity analysis we have carried out, the USDA data of 2008 are used to construct a Reference scenario for the evolution of agricultural and food production in the period 2007-2020, accompanied by two alternative scenarios that are (1) a brief but severe economic contraction followed by rapid recovery and (2) a prolonged period of deep economic recession (GDP growth rates stay low for whole period). To perform these analyses we used the modeling framework, especially the LEITAP model, of the Scenar 2020 update project (Nowicki et al., 2009 - forthcoming). Figure 3.14 shows a somewhat synchronised response in a downward inflection of agricultural and food production growth rates in the case of rapid plunge and recovery of GDP, whereas there would be a certain leveling of these growth rates for most parts of the world in the case of a prolonged recession. What can be noted in the second case is that the magnitude of the decrease in production growth rates differs according to the level of income and the height of the GDP growth rate. The higher the growth rate in the reference scenario and the lower the income per capita, the higher the decline in agricultural and food production. A low level of income per capita implies that a larger share of income is spent on agricultural and food products, and reduction in income then has more negative effects on food consumption. As domestic production is still the main source of domestic consumption the decrease in production is relatively high in Central and South America, Asia and especially Africa. The general decrease in production growth rates for the Highly Income countries (including the EU) shows a simple step-wise reduction in production. Figure 3.15 shows the impact of the GDP scenarios for livestock production, which apparently is the predominant influence on the agricultural and food production situation as a whole in response to different assumptions about the recovery from the current economic crisis. Growth rates are much higher than with regard to crop production (Figure 3.16), but the negative shocks from GDP changes are more severe, and the growth rates level out in the non-high income countries if there should be a prolonged period of economic recovery. Demand 76
Figuur 3.14
Development of agri-food production under alternative GDP scenarios, 2007-2020, in percent
60 50 40 30 20 10 0 -10 EU27
HighInc Reference
C&SAmer
Crisis with recovery
Asia
Africa
Long-term decline in GDP growth
Source: LEITAP calculations. Rates of GDP growth in the Reference scenario derived from USDA (2008).
for meat is quite dependent on income, because of relatively high income elasticity of meat demand. Therefore, meat production in lower income countries and countries with high GDP growth rates is hit hardest by a severe recession. Within the group of less developed countries Central and South America are more resilient, Africa is hardest hit. The high-income countries (excluding the EU) do not fare too badly, but the EU livestock production contracts below current levels in the second scenario. Figuur 3.15
Development of livestock and meat production under alternative GDP scenarios, 2007-2020, in percent
60 50 40 30 20 10 0 -10 EU27
HighInc Reference
C&SAmer
Crisis with recovery
Asia
Africa
Long-term decline in GDP growth
Source: LEITAP calculations. Rates of GDP growth in the Reference scenario derived from USDA (2008).
77
Figuur 3.16
Development of agricultural crop production under alternative GDP scenarios, 2007-2020, in percent
60 50 40 30 20 10 0 -10 EU27
HighInc Reference
C&SAmer
Crisis with recovery
Asia
Africa
Long-term decline in GDP growth
Source: LEITAP calculations. Rates of GDP growth in the Reference scenario derived from USDA (2008).
The impact of lower yields on world prices The influence of productivity on agricultural prices offers another perspective. Figure 3.17 shows that all influences that decrease productivity are mirrored in the increase of prices. In the reference scenario real prices are expected to decline in 2030 conform (according to) the long-term trend (see Figure 3.1). Lower yields have a very high impact on agricultural prices and if yields fall short in the near future real prices can increase substantially. It is apparent that the impact would be greater if productivity decreases all over the world, as opposed to only the developing world. Figuur 3.17
World agricultural prices are sensitive to productivity assumptions
Percent cnahge in global agricultural price relative to base year
40
78
35 30 25 20 15 10 5 0 -5
2010 Reference
2015
2020
Lower developing productivity
2025
2030
Lower world productivity
3.5
The future Price developments in 2008 and 2009 showed that high prices are their own worst enemy. Increased profit margins enticed entrepreneurial investment, which resulted in increased production. Lower market prices inevitably follow. The 'invisible hand' of Adam Smith ensures that winners' gains and losers' losses will be temporary, as entrepreneurs correct market imbalances. Higher prices induced more production as planted areas increased and available arable land was used more intensively. Therefore, the high price situation was not structural and as a result prices went down again. However, first stocks have to be built up again. This effect takes some time. In Brazil and Russia there are ample opportunities for production growth as additional land can be taken into production, whereas in many other countries intensification is the only means to a production increase. According to USDA analyses, Russia, Ukraine and Argentina could be among the world's top grain exporters. Food prices, however, are likely to remain above their pre-2007 nominal levels (see Figure 3.18).1 Average crop prices are projected to be 10%-20% higher in real terms relative to 1997-2006, while vegetable oil prices are expected to be more than 30% higher (OECD, 2009). According to OECD meat prices are not expected to surpass the 1997-2006 level. Dairy prices are expected to Figuur 3.18
Food commodity prices trends 1971-2007, with projections to 2018, USD/tonne Wheat
Rice 2000
800
1800
700
1600
600
1400
500
1200
400
1000 800
300
600
200
400
100
200
0 1971 1976 1981 1986 1991 1996 2001 2006 2011 2016 nominal
0 1971 1976 1981 1986 1991 1996 2001 2006 2011 2016
real
nominal
real
Source: OECD 2008, Rising Food Prices: Causes and Consequences.
79 1
World Bank: Crisis upon Crisis (July 2009).
be slightly higher in real terms, due to higher energy and vegetable oil prices, with a 12% increase for butter as most notable. Both commodity and food prices are expected to rise once global growth picks up, because the demand pressures from rapidly industrialising emerging economies will continue to generate demand-side pressures. The evolution of cereal prices is positively influenced by policy-mandated biofuel demand; but a second reason is the increase in global requirements for animal feed. As the world population is expected to grow to 8.3 billion and the middle-class multiplies some seven-fold by 2030, a considerable surge in the demand for meat is also expected1. The volatility of commodity prices creates instability and uncertainty on global agricultural markets. It affects governments, producers, processors, traders, and local financial institutions. Moreover, commodity price instability undermines economic growth and skews the distribution of income. As a result nearly every government has tried to manage commodity price risks. Most early attempts to deal with commodity price volatility tried to stabilise prices with buffer funds, buffer stocks, international commodity agreements, or government intervention in commodity markets. Such schemes have failed to stabilize commodity prices. Buffer funds have either gone bankrupt or have proven ineffective. International commodity agreements have lapsed, as with those for coffee, cocoa, tin, and sugar. And government intervention has been costly, with unintended consequences. Today's discussion to limit price volatility on world agricultural markets with buffer stocks or even 'virtual' stocks should keep in mind that open and unconstrained trade is a much more effective and less costly instrument to reduce price volatility than creating buffer stocks (Abbott, 2009: 42). With regard to the future we have to take into account the impact of climate change and climate change policies. Climate change might increase agricultural production if the increase in temperature is less than 2% and might lead to lower production if the increase in temperature is higher (OECD, 2009). Climate change policies might reduce responsiveness of agricultural supply and lead to higher food prices. Policies aimed at reducing greenhouse gas emissions such as CO2 taxation and restriction on land use related to carbon storage might increase consumer prices.
80
1 Figures advanced by Professor John Beddington, UK Government Chief Scientific Advisor, at the Symposium An Agrarian Renaissance? held at the James Martin 21st Century School, Oxford on 2 July 2009 (http:www.21school.ox.ac.uk/).
The expected impact on world prices of the 10% EU-biofuel directive and the various global biofuel initiatives is depicted in Figure 3.19 below (Banse et al., 2008a). If all initiatives are implemented together and technological change stays on the historic trend, then the impact on world prices is substantial and the long term trend of declining world prices in the reference scenario might be dampened or reversed. The arrival and impact of second-generation biofuels is uncertain. According to Banse et al. (2008a), biofuels lead to higher agricultural income, land use and land prices, and a loss of biodiversity. Figuur 3.19
Change in real world prices, in percent, 2020 relative to 2001
20% 15% 10% 5% 0% -5% -10% -15% C ereals
Oilseeds Reference
Biofuel, EU
Sugar
Crude oil
Biofuel, global
Source: Banse, M., et al. (2008).
Development of oil prices is crucial for the development of biofuels. Some experts point that prices stay high due to increased demand in Asia and depleting supply resources. Others indicate that this is a temporary situation as capacity is lacking at the moment due to too few investments in the past. If oil prices stay high, food and energy markets will be more interlinked. The oil prices will then put both a floor and a ceiling1 for prices in the food markets (Schmidhuber, 2007). As energy markets are large and more elastic, the longterm trend of declining food prices might be changed (less negative to positive dependent on the development of the oil price). High feedstock prices make biofuels less profitable (ceiling effect), as does a low oil price (floor effect). At the current level of crude oil prices of USD70 per 1
Ceiling price effect: as feedstock costs are the most important cost element of all (large scale) forms of bioenergy use, feedstock prices (food and agricultural prices) cannot rise faster than energy prices in order for agriculture to remain competitive in energy markets. Floor price effect: if demand is particular pronounced as in the case of cane-based ethanol, bioenergy demand has created a quasi intervention system and an effective floor price for sugar in this case.
81
barrel, no biofuels are economically viable without policies. A low oil price implies that only biofuels will be produced under mandates or that they are heavily subsidised. Without an increase in oil prices the impact of biofuels is therefore limited to the impact of filling the mandates. The interrelation with the energy markets may slowdown or reverse Cochrane's treadmill or Owens development squeeze which imply declining real agricultural prices, less farmers, larger scale farming and possible depopulated areas. Volatility of world prices might be an important problem in the future that causes hunger in terms of very high prices for poor consumers and problems for poor farmers when prices are low. The ceiling and especially the floor may act as an intervention price in case of very volatile prices. A floor may also stimulate agriculture in the (poor) world. Hunger is not a problem directly related with biofuels but often of bad policies, and improperly functioning factor and commodity markets.1 In principle, there is enough food in the world but there is a distribution problem. Rising food commodity prices tend to negatively affect lower income consumers more than higher income consumers. First, lower income consumers spend a larger share of their income on food. Second, staple food commodities such as corn, wheat, rice, and soybeans account for a larger share of food expenditures in low-income families. Third, consumers in low-income, food-deficit countries are vulnerable because they must rely on imported supplies, usually purchased at higher world prices. Fourth, countries receiving food aid donations based on fixed budgets receive smaller quantities of food aid. A simplified comparison of the impact of higher food commodity prices on consumers in highincome countries and on consumers in low-income, food-deficit countries illustrates these differences (see Table 3.3). This illustrative comparison shows that for a consumer in a high-income country a 30% increase in food prices causes food expenditures to rise 3% (€1,200), while for a consumer in a low-income country food expenditures increase by 15 percentage points.
1
82
IAASTD (2008, p.5), 'Policy options for improving livelihoods include access to microcredit and other financial services; legal frameworks that ensure access and tenure to resources and land; recourse to fair conflict resolution; and progressive evolution and proactive engagement in Intellectual Property Rights (IPR) regimes and related instruments.'
Table 3.3
Impact of Higher Food Commodity Prices on Consumers' Food Budgets High income countries Low income, food deficit countries
Initial Situation Income Food Expenditure Food Costs as % of Income
€40,000
€1,000
€4,000
€500
10%
50%
€5,200
€650
13%
65%
30% increase in food prices New costs for total food expenditure Food Costs as % of Income Source: Own compilation.
3.6
Concluding remarks The analyses shows that the price increases have several roots and that a normally functioning market will in time provide a certain degree of corrective action (the invisible hand of Adam Smith). But policy/political decisions can prevent the market from doing so. In any case, the time lapse for the market to act does not remove the acuity of the price distortion that affects the poorest people and urgent intervention is necessary to alleviate the effects of short-term price peaks. In the long run tension on the agricultural markets remains as population and income growth continue and non food demand might increase if oil prices increase. Our analyses indicates that a long term recession or decline in GDP growth has severe impacts on agricultural markets. The influence of policy/political decisions mentioned above is certainly present when considering why food production in many countries is below the potential capacity. Not only has land been voluntarily removed from production in some cases, but the access to technology and markets is sometimes also limited by factors that are strictly in the realm of governance. But then there are also potential producers, who simply can not make it into the market, and they can be assisted through micro-credit or through the donation of tools, seeds
83
and the development of irrigation, storage capacity and transportation facilities to integrate into market structures. Our further observations are of several orders, and theses are with regard to policy implications, market failure, social equity, and required policy action.
Policy implications With regard to the EU, CAP reform was designed to enforce farmers' reaction to market signals. There should be no surprise, therefore, when farmers do, and therefore production falls close to the level of world demand. The problem, however, is the time lag between the demand in the market and a farmer's decision on what - and how much - to plant. There is always some degree of 'inadequate' response on the supply side. Around the world, farmers are now responding to price signals and are increasing their production of cereals. Building up and managing stocks is not the primary responsibility of farmers and in a free market this is left to traders; some government intervention might be considered, but a return to automatic intervention based solely on commodity prices should be absolutely avoided!
Will current price level persist? High prices can only be 'cured' by high prices. This may initially seem to be a provocative statement, but the simple fact is that - as stated above - farmers do react to price signals. So do all the other agents in the economy, including speculators! Prices are now down again but still above their 2000-2007 level. The food price 'crisis', be it too high or too low prices, will certainly be prolonged through protective measures by national governments. The issue of civil stability may encourage some governments to take such actions, to reassure their populations that 'something is being done'. Biofuels and other biomass demand to substitute for fossil energy, however, create a more direct link between food and fuel prices and if fuel prices increase further, the long-term trend of declining real food prices might be dampened or reversed. However, in the long run new technologies (use of green algae and cyanobacteria as a source for ethanol, bio-diesel and biogas for example, as well as for the production of hydrogen1) might be an alternative fuel source, and therefore could dis1
84
It is far more efficient to maximise the solar energy conversion efficiency by 'harvesting' it before it is accumulated in vegetal biomass. In the advent of cellulosic conversion, a massive use of biomass could also result in the same type of resource depletion in the future as now occurs for fossil fuels, if exploitation would be more rapid than the biological rate of replenishment. In fact, plants do not use their entire potential for photosynthesis; but in any case energy is lost at each step in the formation of complex biomolecules, limiting the potential role of genetic engineering. (M. Tikkanen et al., 2009).
place crop-based bio-ethanol and bio-diesel, and decoupling between agricultural and energy prices would occur. This possibility has to be clearly taken into account in commodity projections, in order to correctly inform the policy formulation for the agricultural sector, as biofuel production as a source of demand may eventually become more modest in scale (biomass in one form or another will undoubtedly remain an input into energy production: e.g. combined heat and power units).1
Who is mostly affected? The consumers of food in low-income countries with food and energy deficits are those who will suffer most in any sudden or rapid price increase for basic commodities, of which foremost is food. In principle, high prices provide additional income opportunities for farmers. Whether farmers in developing countries will benefit from high prices on world food markets remains questionable and depends on the degree of integration of regional markets in global food markets. But if there is no structural market failure involved per se, as stated above, then this means that the conditions of productivity and market access are the priorities that have not been addressed successfully for a long period of time before a price crisis occurs.
Required policy action Short-term action is to urgently increase spending on food aid in case of a food crises as in 2008. Long-term production capacity improvement (including publically financed agricultural research) is essential to avoid repeated price crises and to deal with the expected tension on the agricultural markets in the long run. However this is not just simply doing basic R&D and farm modernisation, but also additional spending in investment in human capital stock (education), extension services, chain efficiency and improvements in market institutions (governance). The 2008 food crisis was not a crisis in terms of shortage of food, but a crisis in terms of income shortage (in terms of purchasing power and of investment potential to increase productive capacity). Policy measures should enable especially the poor to be able to participate in the economy and therefore for the poor countries to generate income within a world market.
1
On the horizon of 2015, nevertheless, world ethanol demand is expected to be between 130 and 149 bln litres. (International Sugar Journal, Vol CXI, No 1323 (March 2009), p. 155)
85
The challenge for society In the long run an enormous challenge will be how to feed the world and fight climate change at the same time. On the one hand, agricultural demand is growing rapidly due to population and income growth and high oil prices might create an enormous non-food demand as biomass inputs might substitute for fossil fuel inputs. On the other hand, more and more restrictions on supply might be introduced to fight climate change. The impacts of especially climate change policies are not well known. To fulfil both aims will be an enormous challenge for society and both institutional and technological innovations are necessary.
3.7
Literature Abbott, P., Development dimensions of high food prices. Purdue University, 2009. IAASTD, Agriculture at the cross roads. Synthesis Report. International Assessment of Agricultural Knowledge, Science and Technology for Development, 2008. Bange, G.A., Presentation at the hearing ‘Agricultural Markets Roundtable'. Commodity Futures Trading Commission, Washington, D.C., April 22, 2008. Banse, M., P. Nowicki and H. van Meijl, 'Why are current food prices so high?' In: P. Zuurbier and J. van de Vooren (eds.) Sugarcane ethanol. Wageningen Academic Publishers, Wageningen, the Netherlands, pp. 227-247, 2008. Banse, M., H. van Meijl, A. Tabeau and G. Woltjer, 'Will EU biofuel policies affect global agricultural markets?'. In: European Review of Agricultural Economics 35 (2008) pp. 117-141. Ephraim Leibtag, 'Corn prices near record high, but what about food costs?' In: Amber Waves, February 2008. FAO, State of Agricultural Commodity Markets 2009. Rome, 2009. IMF, World Economic Outlook 2006. Washington, D.C., 2006.
86
Meijl, H. van et al., Prijzen op agrarische wereldmarkten; Een verkenning van projecties. Rapport 8.03.06., LEI Wageningen UR, 2003. Nowicki, P., H. van Meijl, A. Knierim, M. Banse, J. Helming, O. Margraf, B. Matzdorf. R. Mnatsakanian, M. Reutter, I. Terluin, K. Overmars, D. Verhoog, C. Weeger and H. Westhoek, Scenar 2020 - Scenario study on agriculture and the rural world. Contract No. 30 - CE - 0040087/00-08. European Commission, Directorate-General Agriculture and Rural Development, Brussels, 2006. Nowicki, P., V. Goba, A. Knierim, H. van Meijl, M. Banse, J. Helming, P Hunke, K. Jansson, T. Jansson, V. Mikos, C. Sattler, N. Schlaefke, I. Terluin and D. Verhoog, Scenar 2020-II – Update of Analysis of Prospects in the Scenar 2020 Study - Contract No. 30-CE-0200286/00-21. European Commission, Directorate-General Agriculture and Rural Development, Brussels. 2009Forthcoming. OECD, Rising Food Prices: Causes and Consequences. Paris, 2008. OECD, OECD-FAO Agricultural Outlook, 2009-2018. Paris and Rome, 2009. Pardey et al., Agricultural research: a growing global divide. IFPRI, 2006. FertReports Archive, (2009). Schmidhuber, J., Biofuels: an emerging threat to Europe’s food security? Impact
of an increased biomass use on agricultural markets, prices and food security: A longer-term perspective. 2007. Tikkanen, M., M. Soursa en E.M. Aro. 'The flow of solar energy to biofuel feedstock via photosynthesis'. In; International Sugar Journal (2009) 111, pp 156-163. Toepfer International, Toepfer International Market Review. 21 August 2009. US Senate, Excessive speculation in the wheat market. Permanent Subcommittee on Investigations. Committee on Homeland Security and Governmental Affairs, June 24, 2009.
87
USDA, (2008). ERS - International Macroeconomic Data Set. Revised Real GDP Projections. Washington, D.C. USDA, ERS - International Macroeconomic Data Set. Population Projections. Washington, D.C. Download: 30.09.2009, 2009a. USDA, ERS - International Macroeconomic Data Set. Revised Real GDP Projections. File received from Mathew Shane, September 02, 2009. 2009b. Washington, D.C. USDA, USDA/ERS: PSD data base, 2009c. Washington, D.C. USDA, USDA Agricultural Projections to 2018. February 2009. 2009d. Washington, D.C. World Bank, World Development Report 2008. Washington, D.C., 2008.
88