The relationship between business cycles and migration: a comparison between traditional immigration countries Vincent FROMENTIN Nancy 2 University / CEREFIGE
[email protected] Abstract This paper examines the relationship between business cycles, growth, unemployment and international migration in traditional European immigration countries (Germany, France, Sweden, Norway, UK) and traditional non-European immigration countries (Australia, Canada, United States). The empirical study adopts a panel VAR approach with two panels over the period 1975–2008. The long-run Granger causality and impulse response results show that the relationships between the variables are different between the regions considered. Keywords: international migration, business cycle, unemployment, panel VAR approach JEL Classification: C1, F2, F41, J6
I. Introduction With the recent economic crisis, the debate about the economic effects of immigration has attracted renewed interest in traditional immigration countries. Employers have begun to revise their recruitment plans and certain governments have already taken measures to adapt labour migration to the evolution of the market. Simultaneously, immigrants have begun to reconsider migration possibilities because of the sluggish economy. There seems to be a narrow correlation between economic cycles and migratory flows in developed countries (OECD, 2009). However, the global impact of economic cycles on net migratory flows is complex and varied, depending on several factors: the nature and the gravity of the crisis, the
measures taken, the economic, cultural and social conditions of the destination country, and so on. There are also regional variations, due to institutional and structural characteristics (for example, the lack of migration and flexibility in EU countries and unemployment levels). Some recent studies analyse the impact of recession on migration (Ahearne et al., 2009; Dustmann et al., 2009; Fix et al., 2009; Papademetriou et al., 2009; Findlay, 2010) and demonstrate that, globally, immigrants react more than the resident population to economic shocks like recession. This paper supplements the literature by analysing the possible relationship between immigration, business cycles and other macroeconomic variables both in the traditional European immigration countries (Germany, France, Sweden, Norway, UK) and traditional nonEuropean immigration countries (Australia, Canada, United States) (see Bauer et al., 2000, for more details). The objective of this article is to adopt a panel vector autoregressive (panel VAR) approach and to perform panel Granger causality tests and impulse responses functions to investigate this relationship and the reaction of migration to other macroeconomic variables. The rest of the paper is organised as follows: section II describes the methodology and data, Section III presents the empirical analysis and estimation results, and I propose some our concluding remarks in the final section.
II. Methodology and Data The general framework used for analysis is the following VAR model of order p:
where is an vector of endogenous variables for country i at the time t, is an vector of errors, is a matrix of country-specific fixed effects, and is an matrix polynomial. The lag operator order is determined by the usual lag length selection criteria and lag exclusion Wald tests. The endogenous variables are migration, represented by the net migration rate per 1 000 inhabitants (source: OECD International Migration Statistics); unemployment, measured as the total unemployment
rate as a percentage of labour force (source: OECD); per capita GDP, current prices measured in purchasing power parity (PPP) (source: OECD); and cycle, per capita GDP de-trended by the Hodrick Prescott (HP) filter with smoothing parameter = 100. Once this long-run trend is removed with the HP filter, the fluctuations observed point to cyclical up- and downturns that the region goes through during different periods of time. Our analysis is confined to the period 1975–2008 due to data availability. We use two panels: Panel 1 for the traditional European immigration countries and Panel 2 for the traditional non-European immigration countries. The vector is as follows (where ∆ is the first difference operator):
The panel VAR approach presents several advantages that increase the efficiency and power of the analysis. The use of panel data techniques is a solution for data limitation and asymptotic results are easier to derive from panel data. Moreover, in VAR all variables are treated as endogenous, allowing endogenous interaction between the variables in the system. It is not necessary to devise prior assumptions about which are response and which are explanatory variables. Each variable depends on the lagged values of the others and captures the complex dynamic properties of the data. Prior to the construction of the panel VAR model, it was necessary to determine the order of integration of the series. I conducted four panel unit root tests to identify stationary or non-stationary variables: Levin, Lin and Chu (2002) (LLC), Im, Pesaran and Shin (2003) (IPS), PP-Fisher and ADFFisher. The null hypothesis for all the tests is that the series contains a unit root. If the variables are integrated of order 1 I(1), the VAR model is estimated in first differences after determining the number of lags. However, it is necessary to examine the possible existence of one or more cointegrating relationships among the series considered before estimating a VAR model. After the panel tests, Granger causality tests and impulse response functions are used to analyse the dynamic effects of shocks on the endogenous variables. The standard panel Granger causality approach allowed me to test the existence and direction of causality between variables. However, the Granger causality framework does not take into
account the indirect effects of other variables and does not provide any information about the direction and strength of the relationship. Consequently, I used generalised impulse response functions (Pesaran and Shin, 1998) with Cholesky decomposition. The impulse response functions produce the time path of the response of dependent variables in the VAR to shocks from all the explanatory variables. Logically, if the system is stable any shock should decline to zero.
III.Empirical analysis Before analysing the relationship between migration, business cycle, growth and unemployment, it’s necessary to test the order of integration of the series on the basis of a series of panel unit root tests. The results (reported in Table 1) show that all the variables are stationary after differencing once. We can presume that the series migr, unem, gdp and cycle in Panel 1 and Panel 2 is integrated of order 1 I(1). Table 1. Panel unit root tests results
Panel 2
Panel 1
LLC
IPS
PP-Fisher
ADF-Fisher
Levels
1st dif.
Level
1st dif.
Level
1st dif.
Level
1st dif.
migr
-0.741
-1.66**
-1.279
-5.92***
13.834
53.13***
15.041
60.10***
unem
-0.457
-2.92***
-0.484
-4.42***
5.887
23.23***
10.195
37.12***
gdp
-0.725
-1.62**
2.120
-2.94***
1.402
23.18***
1.843
24.92***
cycle
2.502
-1.47*
0.393
-2.13**
9.53
17.13*
6.443
19.98**
migr
-0.166
-3.83***
-0.481
-3.82***
2.498
24.83***
7.538
23.42***
unem
-0.933
-1.62**
-0.960
-3.47***
5.458
16.67***
7.960
23.11***
gdp
0.241
-2.42***
2.412
-2.77***
0.905
15.42**
0.976
17.94***
cycle
-0.193
-2.01**
-1.277
-1.75**
2.978
11.77*
9.652
11.68*
Notes: *,** and *** : significant at the 10%, 5% and 1% level. The number of lags is based on the Schwarz Information Criterion, a Bartlett kernel is used for spectral estimation and the Newey–West data-based automatic bandwidth parameter method is used.
Each of the four series is integrated of order 1 I(1), so it is possible to check the existence of one or more cointegrating relationships among the series considered, using well-known tests by Pedroni (2004) and Kao (1999). Panel cointegration tests do not lead to the rejection of the null hypothesis of no cointegration.1 Consequently, it is possible to include this series in the panel VAR multifactor model in first-differenced form, to explore the dynamic relationship between variables. I determine the optimum lag length k, which is essential for panel VAR, and consider two tests: lag order selection criteria (likelihood ratio (or LR test), final prediction error (FPE), the Akaike information criterion (AIC), the Schwarz information criterion (SC) and the Hannan-Quinn (HQ) information criterion) and lag exclusion Wald tests (where the statistic follows an asymptotic Chi-square distribution with k degrees of freedom). Based on all these criteria, I use three lags for Model 1 (European traditional countries) and Model 2 (non-European traditional countries). I assess the significance of the direct lead-lag relationship between the series migr, unem, gdp and cycle using panel Granger causality tests. Table 2 present the results of long-run Granger causality tests. The results show evidence of reverse causality between migration and unemployment in Panels 1 and 2 and differences between traditional European immigration countries and others (Australia, Canada, United States). We can observe a uni-directional causality running from gdp and cycle to migr for Panel 2 and no Granger causality for Panel 1. This suggests that the influence of the economic cycle and the growth of labour mobility are more important in Panel 2 countries. Migration is influenced by the lagged values of unem, gdp and cycle and is not only driven by unemployment, but also by business cycle, unlike the European countries. Moreover, the results show that migration has no influence on economic cycles. The implication is that occupational overrepresentation in cyclical sectors of migrants does not influence the course of economic downturn or upturn.
1
The results are not shown but these may be obtained on request from the author.
Table 2. Granger causality test results F – Statistics
Panel 2
Panel 1
Causality
m
u
gdp
cycle
migr
-
9.129***
0.179
0.173
unem
2.618*
-
4.157***
3.804**
gdp
0.291
6.76***
-
3.583**
cycle
0.063
4.52***
15.441***
-
migr
-
3.035*
2.279
1.896
unem
3.501**
-
2.585*
1.204
gdp
3.995**
11.126***
-
3.572**
cycle
4.347**
8.811***
11.174***
-
Notes: *,** and *** : significant at the 10%, 5% and 1% level.
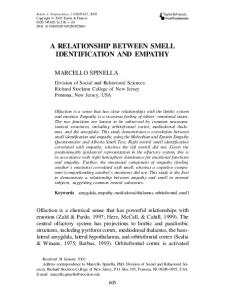
In addition to the panel Granger causality tests, I assess the short-run relationship between the endogenous variables using impulse response functions. Generalised impulse response functions, which are not dependent on the ordering of variables in the VAR, confirm the results of the panel Granger causality tests. Figure 1 shows that immigration inflow responds negatively to variations in the unemployment rate in the EU traditional immigration countries and that the effect is relatively persistent. Conversely, Panel 2 shows that migration decisions are less related to unemployment levels and this effect does not persist over time. One plausible explanation for this discrepancy is that the “absorption capacity” and “flexibility” of the labour market in Australia, Canada and the United States are more important than those of European countries. Immigration policy may also be a factor in explaining these differences in reaction and persistence. In Panel 2 countries, the selection of immigrants on the basis of their ability to meet labor market needs can explain why migrant flow is less related to job opportunities and the probability of employment:
immigrants integrate quickly into the labour market by occupying available jobs or jobs that are neglected by native workers. Figure 1 also shows that migration is affected by growth and business cycle, but that within the EU the short-run immigration response is negative and the influence of the economic cycle on labour mobility is weak. One interpretation of this is that European labour markets and immigration policies are less flexible and reactive than those of non-European countries. This is also highlighted by the response of migration to business cycle, which is less broad and less persistent. In the European immigration countries, despite changing labour market needs, the adjustment of migration policies is slower.
IV. Conclusion The empirical analysis of this article, based on a panel VAR modeling approach, offers a number of interesting insights. Panel Granger causality tests and impulse response functions suggest that the relationship between migration, unemployment, GDP and business cycle varies from one region to another. The employment level of labour markets and the degree of labour market integration seem to influence migration flows, particularly in the EU countries. The results also suggest that migration flows respond negatively to variation in the GDP of EU countries, as opposed to nonEuropean traditional countries. The flow of migrants within the EU seems to be less influenced by economic activity and business cycles, probably because of the inflexibility of EU migration policies and the rigidity of EU labour markets.
Figure 1. Impulses responses functions Panel 1
Panel 2
Response to Cholesky One S.D. Innovations ± 2 S.E.Response to Cholesky One S.D. Innovations ± 2 S.E. Response of DMIGR to DUNEM
Response of DMIGR to DUNEM
.4
.4
.2 .2
.0 .0
-.2 -.2
-.4 -.6
-.4
1
2
3
4
5
6
7
8
9
10
1
2
Response of DMIGR to DGDP
3
4
5
6
7
8
9
10
9
10
9
10
Response of DMIGR to DGDP
.4
.4
.2
.2
.0 .0
-.2 -.2
-.4 -.6
-.4
1
2
3
4
5
6
7
8
9
10
1
2
Response of DMIGR to DCYCLE
3
4
5
6
7
8
Response of DMIGR to DCYCLE
.4
.4
.2
.2
.0 .0
-.2 -.2
-.4 -.6
-.4
1
2
3
4
5
6
7
8
9
10
1
2
3
4
5
6
7
8
References Ahearne, A., Brucker, H., Darvas, Z., Van Weizsacker, J., 2009. Cyclical Dimensions of Labour Mobility after EU Enlargement. Bruegel Working Paper 2009/03. Bauer, T., Lofstrom, M., Zimmermann, K.F., 2000. Immigration Policy Assimilation of Immigrants and Native’s Sentiment Towards Immigrants: Evidence from 12 OECD Countries. IZA Discussion Paper No.187. Dustmann, C., Frattini, T., Halls, C., 2009. Assessing the Fiscal Costs and Benefits of A8 Migration to the UK’. Centre for Research and Analysis of Migration. Discussion Paper Series Paper Number 18/09. Findlay, A., Geddes, A., McCollum, D., 2010. International Migration and Recession. Scottish Geographical Journal 126 (4), 299-320 Fix, M., Papademetriou, D., Batalova, J., Terrajas, A., Yi-Ying Lin, S., Mittelstadt, M., 2009. Migration and the Global Recession. Migration Policy Institute, Sept09. Im, K.S., Pesaran, M.H., Shin, Y., 2003. Testing for unit roots in heterogeneous panels, Journal of Econometrics, 115, 53-74. Kao, C., 1999. Spurious regression and residual-based tests for cointegration in panel data. Journal of Econometrics, 90, 1-44. Levin, A., Lin, C.F., Chu, C.S.J., 2002. Unit root tests in panel data: asymptotic and finite sample properties. Journal of Econometrics, 108, 124. OECD (2009) International migration and the economic crisis: understanding the links and shaping policy responses. OECD Working Party on Migration. Papademetriou, D., Sumption, M., Somerville, W., 2009. Migration and the economic downturn: what to expect in the European Union’. Migration Policy Institute, March 2010. Pedroni, P., 2004. Panel cointegration: asymptotic and finite sample properties of pooled time series tests with an application to the PPP hypothesis, Econometric Theory 20 (3), 597-625. Pesaran, M.H., Shin, Y., 1998. Generalized impulse response analysis in linear multivariate models, Economics Letters 58 (1), 17–29.