The perception of frequency peaks and troughs in wide
frequencymodulations a) Laurent Demany Laboratoire dePsychoacoustique, Universit• Bordeaux 2, 146rueL•o Saignat, F-33076Bordeaux C•dex, FranceandLaboratoire d'Audiologie Expdrimentale, Unit6INSERM229,H6pitalPellegrin, PlaceArnOlie RabaLgon,F-33076BordeauxC•dex,France
KonnothI. McAnally Laboratoire dePsychoacoustique, Universitb Bordeaux 2, 146rueL•o Saignat, F-33076Bordeaux C•dex, France
(Received20 July1993;revised18 March1994;accepted 13 April 1994) This workwasconcerned with theperception of "instantaneous pitch"in continuously frequency modulated sounds. In experiment 1, a 70-dBsinusoidal carrier,closeto 1 kHz, wasmodulated by
the exponential of periodicfunctions corresponding to the sumof a few sinusolds [e.g., sin(at)+sin(3at)].Eachmodulation hada fundamental frequency (a/2rr)of 1.5 Hz andwas symmetric onthedimensions of timeandlogfrequency. Thirtylisteners identified discrete melodic motifswithinthesestimuli.The pitchesof the identifiednotesmainlycorresponded to the local
frequency maxima;generally, the localminimawerenot heardas auditory"events"(pitch singularities). A similarperceptual asymmetry was not observed for comparable sequences of discrete tones.In experiments 2-4, frequency difference limensweremeasured for themaximaand minimaof continuous frequency modulations, usinganadaptive forced-choice method. Sinusoidal carriersweremodulated by theexponential of onecycleof a 5-Hz cosinefunction,startingat phase z' or phase0 andgivingan overallfrequency swingof about0.5 oct.For maximaandminima around1 kHz,frequency shiftsof maximawerebetterdetected thanfrequency shiftsof minima,by anaverage factorof 2. Generally, thisasymmetry didnotdecrease asa function of subjects' training in thediscrimination task,andwasstillpresent whenfrequency minimaweregivena 6-dBintensity advantage over frequencymaxima.No explanation was foundfor the advantage of frequency maxima withrespect toperceptual salience (experiment 1)ordiscriminability (experiments 2-4). PACSnumbers:43.66.Fe,43.66.Hg,43.66.Mk,43.71.Es[LLF]
INTRODUCTION
arbitraryone(AttneaveandOlson,1971).Thus,in psychoacousticstudieson the perception of wide FM, it is appropri-
Speechsoundscontainmeaningfulfrequencymodulation (FM): The resonantfrequencies of the speechsignalare moving,aswell asthefundamental frequency of thevoiced
ate to consider the modulation waveforms in coordinates of
timeversuslogfrequency. We did soin theresearch reported here.
phoneroes (Pickett,1980;CooperandSorensen, 1981).For
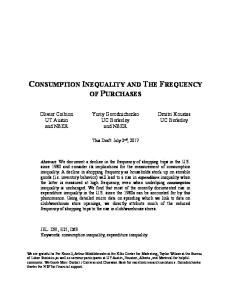
The startingpointof thisresearch wasan accidental observationthat we madeon a particularFM signal.The carthisreason,the humanauditorysystemmustbe ableto processwide FM in a sophisticated manner.However,although rier, a 1-kHz sinusoid,was modulatedby the exponentialof andperiodictime function,f(t)=A[sin(at) theauditorydetection of FM hasbeeninvestigated in numer- a continuous +sin(3at)], which possessed half-wavesymmetry If(t) ous studies(e.g., Showerand Biddulph,1931; Zwicker, =-f(t+r/2), wherer is the modulation period,2rr/a]. 1952; Gardnerand Wilson, 1979; ReganandTansley,1979; The modulationwaveformis depictedin the upperpart of Hartmannand Klein, 1980; Kay, 1982;Wakefieldand VieFig. 1, wheretheordinaterepresents instantaneous frequency meister,1984; Moore and Glasberg,1986; Ozimek and Sek, on a logarithmic scale. Within each modulation cycle, there 1987;DooleyandMoore,1988b;DemanyandSemal,1986, were three local maxima (labeled as ,Y, X, and Y) and three 1989;EdwardsandViemeister,1994), little psychoacoustic local minima (Y,Z,Z). ,Y and Z were vertically equidistant workhasbeendevotedto thesupraliminal perception of FM. from Y (the carrierfrequency).In the equationof the moduIn the humanauditorysystem,from the cochleaup to theprimaryauditory cortex,frequency seems to betonotopi- lationfunction,the valueof the coefficientA was setin order to obtainan overall frequencyswing (X-Z) of 0.5 oct. We cally codedon a quasilogarithmic scale,at leastabove500 Hz (Scharf,1970;Romaniet al., 1982;MooreandG!asberg, listened to this stimulus for various values of T, the modulationperiod.When T wasvery large,for instance5 s, the 1983). Moreover,the assumption in musicthat pitch is a couldbe perfectlytrackedandtherewasno oblogarithmic functionof frequencydoesnot seemto be an modulation vious perceptualasymmetrybetween its peaks and its troughs.However,whenT wasbetween,say,0.5 and1 s, too a}Portions of thisresearch werepresented at the 125thMeetingof theAcousticalSociety of America in Ottawa, Canada, May1993[J.Acoust. Soc. shortfor a completetrackingof the modulation,an unexAm. 93, 2346(A) (1993)].
706
J. Acoust. Soc.Am.96 (2),Pt. 1,August 1994
pected phenomenon occurred: Whatever thestarting phase of
0001-4966/94/96(2)/706/10/$6.00 ¸ 1994Acoustical Society ofAmerica 706
wnloaded 11 Apr 2011 to 193.50.102.40. Redistribution subject to ASA license or copyright; see http://asadl.org/journals/doc/ASALIB-home/info/terms.j
and periodicFM waveforms,with differentrhythmicand/or melodicstructures.In experiment1, therefore,a fixed sinusoidalcarrierwas modulatedby a set of periodicfunctions includingthe one describedabove,and subjectswere requestedto identify melodicmotifs within thesestimuli. In
Function 1: A.[•in(a.t) + sin(3a.t)] X
Z
Z
thesecondstudy(experiments 2-4), variablesinusoidal carriersweremodulated by simpler,aperiodic functions, andwe measured thresholds for the detectionof frequencyshiftsin isolatedpeaksand troughs.
Function 2:B.[sin(a.t)sin7(a.t)l x
x
z
z
z
I. EXPERIMENT
Function3: C.[sin(a.t)+0.5 sin(3a.t)] W
I
W
A. Method Z
Z
1. FM stimufi
The sinusoidalcarrier had a frequencyof 1046.5 Hz (whichcorresponds to C6 in thetemperedmusicalscale)and a soundpressure level(SPL)of 70 riB.The carrierfrequency wasmodulatedby theexponentialof four differentfunctions, depictedin Fig. I andanalyzedin TableI. For a givenfunction,f(t), thewaveformof the soundsignalcouldbe written
Function4: D.[cos(a.t)+ cos(3a.t)] W
Z
TIME
sin[o4t)]=sin (f 2wF• exp[f(t)]dt), (1)
FIG. I. The four continuousFM functionsusedin experimentI.
the modulationwaveform,our dominantperceptwas a melodic motif of threenotescorresponding to the sequenceof the localfrequencymaxima(X-X-Y); in contrastto the local maxima, the local minima could not be heard as auditory events,i.e., pitchsingularities. FollowingIbis accidental ob-
whereFcrepresents thecarrierfrequency. The four functions f(t) had the followingcommonfeatures. (1) Each consistedof the sum of a few harmonically relatedsinusolds with a fundamental frequency(a/2•r) of 1.5 Hz. Thus the modulationperiodwas 666.7 ms in eachcase. (2) The functionsweresymmetricin amplitude.Because
servation, it was decided to conduct a set of more formal
their Fouriercomponents were alwaysodd harmonics (har-
experimentson the perceptionof frequency peaks and troughsin wide FM. Two studiesare reportedin this paper.The goal of the
monics I and 3 for functions 1, 3, and 4; harmonics 1, 3, 5,
and 7 for function2), they possessed half-wavesymmetry
firstone(experiment1) wasto confirmthe existence of the just-described perceptual asymmetryin a ratherlargesample of subjects (N=30), andto determine if frequency peaksand troughsarealsoperceivedasymmetrically for othercomplex
If(t)=-f(t+ T/2), whereT is the modulation period,2•r/ a]. In otherwords,a reflectionof eachfunctionaboutthe time axisresultedin a translatedreplicaof the originalfunction;peaksandtroughswereidenticalin number,shape,and size.
TABLE I. Relative amplitudeand liming of the local exlrema of the four modulationfunctionsused in experimentI. lx•cal extremum
Max.l
Min.l
Max.2
Min.2
Max.3
Min.3
Max. I
Function1:A[sin(at)+sin(3a t)] Label
Relativeamplitude Delay (ms)
X
Y
X
I
0 101.4
[ 101.4
Z
- I 130.6
Y
Z
0 101.4
- 1 101.4
130.6
Function 2: B[sin(at)-sin7(a t)] Label
Relativeamplitude Delay (ms)
X
Y
X
I
0 80.9
I 80.9
Z
I 171.5
Y
Z
0 80.9
I 80.9
171.5
Function 3: C[sin(a0+0.5 sin(3at)] Label
Relativeamplitude Delay (ms)
W
I
X
0.465 92.2
W
Z
I 92.2
- 1 148.9
Y
Z
-0.465 92.2
- I 92.2
148.9
Function4: D[cos(a t)+cos(3a t)]
707
Label
W
Y
Relativeamplitude Delay (ms)
I
-0.272 122.1
d. Acoust.Soc.Am., Vol. 96, No. 2, •. 1, August1994
X
Z
0.272 89.2
- 1 122.1
X
0.272 122.1
Y
-0.272 89.2
122.1
L. Demanyand K. I. McAnally:Frequencypeaksand troughs
707
wnloaded 11 Apr 2011 to 193.50.102.40. Redistribution subject to ASA license or copyright; see http://asadl.org/journals/doc/ASALIB-home/info/terms.
(3) The functionsweresymmetricin time. Because the components were all in eithersineor cosinephase,reversal of thetimeaxisresultedin a replicaor a translated replicaof the originalwaveform.
to the melodic contour of the successive miniran of function
(4} Within eachcycle, a localextremumwas reachedfor six differentphases.Two of the threemaximawere identical,
se.
as well
as two of the three minima.
The main individual
features of the four functions
are
1 (Y-Z-Z-Y-Z-Z .... ). Vice versa,the miniranof function4 had the same contour as the maxima
of function
1. This
provideda goodcontrolfor the role of melodiccontourper In functions2, 3, and4, the amplitudecoefficient(B, C, or D) wasset in orderto obtainan overallfrequencyswing Of-Z for function2, W-Z for functions3 and 4) of 0.5 oct.
documentedin Table I, wherethe columnsrepresentthe suc-
For function 1, three values of the coefficientA were used;
cessivelocal extrema. For each function and each extremum,
the corresponding frequencyswings(X-Z) were equal to
the table indicates:(first row) the label given to the correspondingfrequency;(secondrow) the relativeinstantaneous amplitudeof thefunctionat thispoint:(thirdrow) thedelay of the extremumfrom the previousextremum. Functionl--with whichwe hadinitiallyobserveda perceptual asymmetry between FM peaks and troughs-possessed certainpropertiesthat madeit difficult to generalize the perceptualasymmetryto otherFM waveforms.One of theseproperties wasthequasi-isochrony of thesuccessive maxima (X-X-Y-X-X-Y-...) or minima (Y-Z-Z-Y-Z-Z...), which created a kind of "three-part time" {Max.2
0.25, 0.5, and I oct. Therefore, we used a total of six FM
signals,amongwhich threewere basedon function1. Each FM stimulusconsistedof a 5-s excerptof one of thesesix signals.The excerptswere gatedon and off with 200-mscosine-shaped amplituderampsand beganat a random phaseof the modulationwaveform.A new randomization of the modulation's initial phaseoccurredfor eachpresentation.
2. Procedure, part A (FM stimuli)
Subjectswere testedindividuallyin a sound-treated studio of the BordeauxConservatoire. The stimuliwere generms). It hasbeenarguedby Joneset al. (1981) and Handel atedin realtime,with a samplingrateof 25 kHz, by a digital et al. (1983) that auditorystimuli forming an isochronous signalprocessor (OrosAU22, equippedwilh 16-bit DACs), sequencecan be more readily integratedinto one and the usinga generalsoftwaresystemfor psychoacoustic research sameperceptualstreamthanstimuli which do not form such ("SON", L.C.I., Paris).After low-passfiltering at 8.0 kHz a sequence.Although this claim has been contested(see (Kemo VBF/8.04, 90 riB/oct),they werepresentedbinaurally Bregman,1990,pp. 443-450), it wasdesirableto controlthe via a TDH 39 headset.The periodsof the modulationwaverhythmfactor.We did so by usingfunction2. In function2, formsweredefinedin tables,eachcontaining2048 samples. the melodic contour of the successive maxima and minima The accuracyof the modulatedsignalswas determinedby was the same as in function 1. However, there was no isochmeasurements of instantaneous frequencyat very low modutony at all in the sequenceof the local maxima,or miniran lation rates.By meansof an artificialear (Bruel & Kjaer (Max.2-Max.l=161.8 ms; Max.3-Max.2=252.4 ms). By Type 4152) coupledto a soundlevel meter(Bruel & Kjaer contrast,onecoulddiscerna "four-parttime" resultingfrom Type 1616),it was alsodetermined that the frequencyrethe quasi-isochrony of the sequenceformedby the two glosponseof the two earphones was approximately fiat within bal maximaand the two global minima (X-X-Z-Z-X-X-Zthe octavecenteredon the carrierfrequency;the SPL was Z-...; Max.2-Max.l=Min.3-Min.2=161.8 ms; Min.2 about2 dB higherfor the lower frequencies, which,if any-Max.2=Max. l-Min.3=171.5 ms). Thus the rhythmic thing,wouldhavefavoredthe perceptionof the modulation propertiesof function2 were quite dift•:rentfrom thoseof troughs. function 1, and might have enhancedthe sallericeof freThe six FM signalswere describedto the subjectsas quencytroughs. "repetitive melodies."For each signal, the melodic motif Anotherpossiblysignificantpropertyof function1 was perceivedby each subjectwas identified in a categorical the absenceof frequencyoverlapbetweenlocal maximaand mannerby meansof a procedurecomprisingthe following minima:None of the local miniranwas higherin frequency four stages. than a local maximum. It was interestingto examine the (1) By pressingthe spacebar of a computerkeyboard, perceptualconsequences of a large frequencyoverlap besubjectspresentedthemselveswith one excerptof the signal. tweenmaximaand minima,and thiswas doneby usingfuncThey were requestedto sing,or to whistle,the melodicmotif tion 3. Its local extremaoccurredat four frequencylevels thattheyperceived.If a singleexcerptwas not enoughfor a (W,X,Y,Z), insteadof threefor functions1 and 2, and one confidentvocalreproduction, the spacebar couldbe pressed of its three miniran (X) was higher than one of its three again and one or more additional excerptswere heard. (2) Subjectshadto say how manynotesthe motif conmaxima(Y). Thus the two globalmaxima(W) were closer tained (in all), and if some notes of the motif had the same to the "high minimum"(X) thanto thethirdmaximum(Y). In so far as frequencyproximity is a major factor in the pitch. When it was reportedthat the total numberof notes formation of auditory streamsfrom discretesequencesof was six, we supposedthat the six notescorresponded to the tones (Bregman, 1990), it could be expectedthat the high six local extremaof the modulationperiod and we did not further fortheFM signal involved? minimumwould be groupedwith the two global maxima, proceed (3) When the total number of noteswas smaller than six and wouldbe perceptuallysalientfor this reason. Finally,we usedfunction4 becausethe melodiccontour (it wasneverlarger),eachperceivedpitchwasidentifiedin a of its successive maxima(W-X-X-W-X-X .... ) was similar forcedchoiceparadigm.By pressingthe keysF1 to F4 of -Max.l=202.8
708
ms; Max.3-Max.2-Max.l-Max.3=232.0
d. Acoust.Soc. Am., Vol. 96, No. 2, Pt. 1, August1994
L. Demanyand K. I. McAnally:Frequencypeaksand troughs
708
ownloaded 11 Apr 2011 to 193.50.102.40. Redistribution subject to ASA license or copyright; see http://asadl.org/journals/doc/ASALIB-home/info/terms.js
the keyboard,subjectscouldproduce,at will, four different 110-mspure tones.For the modulationwaveformsbasedon functions3 and4, the frequencies of thesefour puretones corresponded to the four frequencylevelsof the local extrema(FI =Z, F2 = Y, F3 =X, F4 = W). For the modulation waveforms basedon functions I and2, threekeys(FI -F3 or F2-F4) respectively produced Z, Y, andX; the fourthkey (F4 or F1) produced a "dummy"toneeitheraboveX (for F4) or belowZ (for F1); in eachcase,thefrequencyinterval betweenthedummytoneanditsneighbor(X or ZI wasequal to lhe modulationdepth,so that the four toneswere uniformly spacedin pitch.Subjectsidentifiedfirstlythe highest pitch in the motif, then the pitchjust below,and so on if morethantwo differentpitcheswere heard.Throughout this stage,subjectswere free to listenagainto the FM signalby pressingthe spacebar; the only constraint was thatthe pure tonesand the 5-s excerptsof the FM signal could not be heardsimultaneously. Occasionally, subjectscomplainedthat a given pitchperceivedin the motif couldnot be satisfactorily matchedwith oneof the fourtones;in sucha case,they
o
o
o u
z
o'
.-I
o o
TIME
were instructed to choose the closest tone.
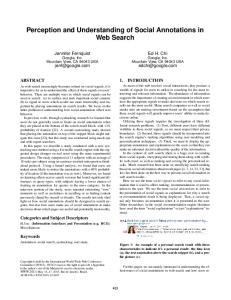
(4) Followingthe identification of all pitches,subjects FIG. 2. The fourdiscretemelodicfiguresusedin thefimilpartof cxperimcul I. Two melodicfigures{A and B), comprisingeachIhree hines.were were requestedto play the whole motif on the keys.The rived from lwo conlinuousFM functions:Function I {top! and function sequence of keyspushedwas the final response recordedby Ibonom ). the experimenter. The six FM signalswere usedin a randomorder,redesignal;in the caseof B, the threetonescorresponded to the refrainedfor eachsubject.The experimenter did not know three maxima. It was reasonedthat if, in the discretemelodic the orderingof the signalsand could not hear them during sequences, peaks of the melodiccontourwere markedly the session.
more salient than troughs,then subjectsshouldvote for B rather than A.
3. Procedure, part B (discrete melodic sequences) It was importantto know if the perceptionof the FM signalscouldbe predictedfrom the perception of "discrete" melodicsequences, composedof toneswith steadyfrequencies. Thus, in the secondpart of the experiment,subjects were presentedwith a discreteversionof two of the FM signalspreviouslyused:the signalbasedon functionI with a frequencyswingof 0.5 octandthesignalbasedon function 4. In each case, the continuousFM signal was transformed into a repetitivesequenceof six sine toneswith frequencies correspondingto the six successivelocal extrema of the modulationcycle. Each tone had a total durationof 50 ms andwasgatedon andoff with 5-mscosineshapedamplitude ramps. The componenttones of the two sequenceswere separated by silentintervalswhichvariedin orderto mimick exactly the rhythm indicatedin Table I for the FM signals. Like the FM signals,the discretesequences were presented in 5-s fragmentswith a randomstartingpoint. For eachof the two sequences (usedin a randomorder), the subjectcouldhearat will: (1) an excerptof thesequence by pressingthe spacebar of the keyboard;(2) a shortmelodic figure(A or B) by pressingFI; (3) anothershortine!odicfigure(B or A) by pressing F2. The taskwasto say whichof the two melodicfigures,A or B, was easierto hear withinthe sequence. A andB are are depictedin Fig. 2/'or function1 (top) and function4 (bottom).BothA and B were composedof three tonesfrom the repetitivesequence,symbolizedby circlesin Fig. 2. In the caseof A, the threetones corresponded to two maxima and one minimum of the FM 709
J. Acoust.Soc.Am., Vol. 96, No. 2, Pt. 1, August1994
4. Subjects The results described below were obtained froth 30 sub-
jects,agedfrom 13 to 39. Most of themwere advancedstudents in music.All played some musicalinstrument.For threeadditionallisteners,the testsessionwas interruptedbecausethey did not seemto perceiveconsistent melodicmotifs in the FM signals.Another listeneridentifieda motif includinga dummypitchand her datawere rejectedfor this reason.
B. Results
and discussion
1. FM stimuli
The responsesobtainedfor the FM stimuli basedon functionsI and2 are presented in Table II, with theirrespective percentages. Overall, ten different motifs were
identified. 2Weorganized themintothree classes onthebasis of the mean pitch of the identified notes.The motifs for
whichthe meanpitchwas Y (i.e., the carrier)weregrouped into a classof "symmetric"responses. For instance,"X-Z" was consideredas a symmetricresponsebecauseX and Z were symmetricaboutY. "X-Y-X-Z-Y-Z," the motif presumablyperceivedwhenthe reportednumberof noteswas six, was alsosymmetric.The secondclassincluded"asymmetric" responsesthat implied a perceptualdominanceof the
frequencypeaksover the frequencytroughsin so far as the meanpitch was aboveY. The third classwas composedof responsesfor which the oppositewas true. L. Dernanyand K. I. McAnally:Frequencypeaksand troughs
709
ownloaded 11 Apr 2011 to 193.50.102.40. Redistribution subject to ASA license or copyright; see http://asadl.org/journals/doc/ASALIB-home/info/terms.j
TABLE Ii. Responses obtainedin experimentI (partA) for the firsttwo modulalionfunctions.The responserulesare expressed as (rounded}percenlages. Funclion
i
I
I
2
Frequencyswing (oct.}
0.25
0.5
1.0
0.5
X-Z
17
10
7
10
3
7
10
3
27
27
13
23
X-Y-X-Z-Y-Z Total
3
10
10
"Asymmetric"mspon•s with a dominanceof peaks 13
3
10
3
X-X- Y
X-Y
20
4(!
53
37
X-X-Z
23
20
3
23
X-Y-Y
3
X-X-Y-Y
10
3
X-Y-X-Z
17
10
87
77
3
'lblal
66
for "Z-X-W-X"and
3
70
the sequenceof the local maxima. It is importantto remark that subjectsidentifiedmarkedlymore notesat the Y pitch
level (a local maximum)than at the X pitch level (a local minimum)althoughX was a higherpitchthanY. The dominant percept,"W-W-Y", did not respectthe well-known "principleof proximity"sinceW wascloserto X thanto Y. In the caseof function4 (TableIII, rightpart),97% of the responses--actually, all responses but one--implied a perceptualdominanceof the frequencypeaks;therewas no symmetricresponse.However, the most frequentresponse was not the exact sequenceof the local maxima, "X-W-X" (equivalent to "W-X-X"): Higherpercentages wereobtained
"Symmetric"responses X-X-Z-Z
(left part) that, again,subjectsgenerallygaveasymmetric responses implyinga perceptual dominance of the frequency peaks.The mostfrequentresponse, "W-W-¾," was exactly
"Y-X-W-X";
the first note of these
two motifspresumably originates fromthedeepestfrequency minimum.
"Asymmetric"responses with a dominance of troughs Z-Z-X
7
3
Table II indicates that for both function I and function 2,
symmetricresponses were rather unusual.Most of the responses fell intothe secondclassandthusimplieda perceptual dominanceof the frequencypeaks.In the caseof function 1, the total percentage of the responses in which the peaksdominatedincreasedfrom 66% for the smallestfre-
In summary,the results clearly show that the local maximaof the modulations weremorereadilyheardaspitch singularities,or "auditory events,"than the local minima. This occurredfor each of the FM functionsused,although theymarkedlydifferedin rhythmicand/ormelodicstructure. However, there was a rather large variability in subjects're-
sponsesand the reportedmotifs did not includeonly pitch maxima. Since some responseswere difficult to interpret (e.g., "X-X-Y-Y" for functions1 and 2), part of the variability may be due to errors,i.e., misrepresentations of the quencyswing(0.25 oct)to 87% for thelargestswing(1 oct). genuinepercepts; but it is likely thatfrequencytroughswere For the two largestswings,the mostfrequentresponse was sometimes truly perceivedas auditoryevents.The datacolby far "X-X-Y," that is exactlythe sequenceof the local lectedfor functionI suggestthai the perceptualasymmetry maxima.For the smallestswing,the mostfrequentresponse betweenthe frequencypeaksandtroughsof continuous FM became "X-X-Z", but "X-X- Y" and "X-Z" were not marksignalsincreases with the modulationdepth. edly rarer.The resultsobtainedfor function2 were very similar to thoseobtainedfor function I at the sameswing. This indicatesthat the perceivedmotifs were not critically 2. Discrete melodic sequences dependenton the rhythmicpropertiesof the modulations, The results obtained for the two discrete melodic sewhich were quite differentfor functions1 and 2. quences were extremelyclear-cut:All subjectsreportedthat, With respectto function3, it can be seenin Table !!I in eachsequence, the melodicfigureA waseasierto hearout than the melodicfigure B. Thus, althoughB was the mosl TABLE IlL Resultsof experiment I (parlA) for funclions 3 and4. frequentlyperceivedmotif in the continuousFM basedon function1, it was not a salientmelodicfigure in the correFunction 3 4 spondingdiscretesequence.Apparently,the perceptionof "Symmetric"responses melodiesin continuousFM cannotbe simply predictedfrom W-Z 7 the perceptionof discretemelodicsequences. X-Y 3 Sincethe componenttonesof A, but not B, were adjaX-X-Y-Y 7 W-X- W-Z- Y-Z 3 centin the discretesequences, thefactthatall subjects voted Total
20
for A rather than B can be taken as evidence that the discrete
"Asymmetric" responseswith a dominanceof peaks W-Y
10
X-W-X
23
W-W-Y
37
X-W-Y
3
W-W-Z
3
W-W-X
3
X-X-
Y
W-W-¾-Y Total
7 15
Z-X-
W-X
Y-X-W-X
73
X-X-Z
Total
710
3
27
97
Other responses X-Z
4O
Y-W-Y-Z
3
7
J. Acoust.Soc.Am., Vol. 96, No. 2, Pt. 1, August1994
sequences were not fast enoughfor a perceptualsegregation of their adjacentcomponenttones(at leastthoseformingA)
into separate perceptual streams(seeBregman,1990,chap. 2). Interestingly, BregmanandDannenbring (1973) showed that consecutive tonesare lessreadilysegregated into separate streamswhen they are connectedby continuousfrequencyrampsthan in the absenceof suchramps.In the light
of this finding,we can infer from the resultsobtainedwith thediscretesequences thatthecorresponding continuousFM signals did not induce stream segregationphenomena. Clearly,the perceptualasymmetrybetweenfrequencypeaks L. Demanyand K. I. McAnally:Frequencypeaksand troughs
710
ownloaded 11 Apr 2011 to 193.50.102.40. Redistribution subject to ASA license or copyright; see http://asadl.org/journals/doc/ASALIB-home/info/terms.js
terfactor,theapexfrequencies of thepeaksandtroughswere located in thesamespectral region(exceptfor experiment 4).
/ F+0.5 octave
A. Experiment 2
'TROUGH' ,/,'"
1. Method Each stimulus had a sinusoidal carrier and a total dura-
tion of 200 ms. The carrierfrequencywas modulatedby the /- 0.25 octave
F - 0.5 octave
exponentialof one cycle of a 5-Hz cosinefunction:f(t) =kcos(10•'t-rr) in the peak condition, and f(t) =k cos(10rrt) in the trough condition.The stimuli were gatedon andoff with 10-mscosine-shaped amplituderamps. Theyweregenerated in realtimewith thesameequipment as thatusedin experiment1. Their samplingratewas20 kHz. They were presented binaura!iy,via TDH 39 earphones, in a double-walledsoundproofbooth. On each trial, three successivestimuli, separatedby 500-ms silent intervals,were presented.The first one--the "reference"
TIME
FIG. 3. FM functionsusedin experimenl2. Conlinuouslines:reference slimuli;dashedlines:largerslimuli.
stimulus--was
identical to either the second or
the third, at random;subjectshad to identifythe positionof the other stimulus--the "target"---by pressingone of two keys. In the referencestimulus,the total frequencyswing
was0.5 oct andtheapexfrequency (reached after100 ms) was randomlylocatedwithin a 0.5-octrangecenteredon 1 and troughshas a differentorigin. This view is supported kHz. The targetstimulushadthe sameonsetandoffsetfreeven more directly by the resultsobtainedfor function3 quencyasthereference, buta higher(in thepeakcondition) (reportedin theprevioussection). or lower (in the troughcondition)apex frequency.Visual It is well known that in discretemelodic sequencesof informationconcerning response accuracywas immediately puretones,slowenoughto be perceivedascoherentstreams, the melodicmovementis sufficientto inducethe perception
FM signalsmightbe interpreted in termsof "subjectiveac-
provided. In the first part of the experiment--threetestsessions, run on different days--the stimuli were generatedwith a steadyamplitude,givinga nominalSPL of 70 dB. Eachses-
centuation."However, it seemsthat a discretetone on which
sion consisted of 20 blocks of trials, that is 10 threshold
subjectsperceivea melodicaccentcan be precededby a higheras well as a lower frequencytone;accordingto Thomassen(1982), thereis no significantasymmetryin thisre-
measurements for eachof the two conditions (presented in alternation).Thresholdswere measuredwith the "weighted up-down" adaptive procedure describedby Kaembach (1991). In eachblock of trials, the initial magnitudeof the apexshift (in cents)was setwell abovethe expecteddetec-
of "accents"
on certain tones. Our results for the continuous
gard. II. EXPERIMENTS
II-IV
Experiment1 showedthat,in soundspossessing a complex andperiodicFM, frequencymaximaweremorereadily heardas auditoryeventsthanfrequencyminima.This led us to hypothesizethat, in such signalsand also simplerFM stimuli, the auditory systemencodesfrequencymaxima moreaccuratelythanfrequencyminiran.In experiments 2-4, the detectabilityof shiftsin maxima and minima was investigatedusing the modulationfunctionsdepictedin Fig. 3. Eachof thesefunctions consisted of a singlecosinecycle(on a log-frequency scale)and possessed eithera singlemaximum(in the "peak" conditions) or a singleminimum(in the "trough"conditions). On eachtrial,all thepresented stimuli had the sameonsetand offsetfrequencybut one stimulus differedfrom the otherstimuliwith respectto modulation depth.Thus, the differencesto be detectedessentiallyrested
tionthreshold. Theshiftwasdivided by 1.5]/3aftereach correctresponseand multipliedby 1.5 after eachincorrect response, until the occurrence of 12 reversalpointsin the variationof theshift.The meanof the lastten reversalpoints (estimating the75% correctpointof thepsychometric function) was taken as the threshold. In a fourthtestsession, organizedin thesamemanneras the first three, the FM was combinedwith an amplitude modulation (AM) intendedto favor the perception of the frequencyminima. For each stimulus,the logarithmof the amplitudeenvelope(i.e., the momentary SPL) was a 5-Hz cosinusoidalfunctionin antiphasewith the FM. Thus the frequencyapexwas associated with an intensitymaximumin the troughconditionand with an intensityminimumin the peakcondition.The AM covereda rangeof 6 dB, centered on 70 dB SPL.
Five listeners, between the ages of 24 and 39, were
in the temporalcentersof the stimuli,corresponding to the frequency apex. Since we did not wish to combine the "maximumversusminimum"factorwith a frequencyregis-
tested.Two of them,the authors,hadpreviouslyparticipated as subjectsin relatedexperiments. This was not the casefor the otherthreesubjects,who did not practicemorethanone
711
L. Demanyand K. I. McAnally:Frequencypeaksandtroughs
J. Acoust.Soc.Am., Vol.96, No. 2, Pt. 1, August1994
711
ownloaded 11 Apr 2011 to 193.50.102.40. Redistribution subject to ASA license or copyright; see http://asadl.org/journals/doc/ASALIB-home/info/terms.js
TABLE IV. Resultsof experiments 3 and4. The meanthresholds and their standarderrors(s.c.) are expressedin cents. "Peak"
Experiment
ß peak condition 0 trough condition
Subject
Mean
condition
s.c.
"Trough" condition
Mean
s.c.
KM
44.6
3.4
92.4
8.0
LD
29.1
5.7
56.7
10.5
HP
60.9
5.7
l 19.5
5.4
KM
39.0
3. I
66.2
4.9
LD
25.0
1.6
52.3
4.3
HP
59. I
4.8
109.6
8.3
This experimentdifferedfrom experiment2 in two respects: {1) On eachtrial, the apexfrequencyof the targetstimulus was shiftedpositivelyor negatively,at random;thus,from trial to trial, we varied adaptivelythe absolutevalue (in cents) of the shift; (2) four stimuli, insteadof three, were presented on eachtrial; the secondandthe thirdstimuliwere separatedby 600 ms insteadof 500 ms; the targetstimulus could be, at random, the second or the fourth one.
Test
session
FIG. 4. Resultsof experiment2. The five subjects'dataare plottedin separate panels.Eachdatumpoint is the meanof len thresholdmeasurements. The total length of each vertical bar representstwo standarderrorsof the mean.Note that Ihe ordinateKale differs from subjectto subject.
hour beforethe onsetof the formal experiment.SubjectKU was not presentedwith stimulicontainingAM.
KM, LD, and HP, three listenerswho had previously participatedas subjectsin experiment2, were testedin a singlesessioninvolvingten thresholdmeasurements for each of the two conditions.The resultsare presentedin Table IV. Thresholdswere higherthan in experiment2, not surprisingly giventhatthe directionsof the shiftswerepredictable in experiment2 but not in thepresentcase.However,thresholdswere still markedlylowerin the peakconditionthanin the troughcondition,by a factorof about2 for eachsubject. C. Experiment 4
In the two conditionsof experiments2 and 3, the apex frequencies of the stimuliwere locatedin the samespectral 2. Results and discussion region(centeredon 1 kHz). Consequently, therewas an average distance of 0.5 oct between the corresponding carrier The resultsare displayedin Fig. 4. Overall, it is clear frequencies. Experiment 4 was a replication of experiment 3 that thresholds were lower in the peakconditionthanin the with a single modification: On each trial, in both the peak troughcondition.For the first threesessions(no AM), the and the troughcondition,the carrierfrequencyof the refercorresponding grandmeansare respectively23.2 and 52.9 ence stimulus(presented threetimes)wasrandomlyselected cents.In the caseof subjectKU, there was a pronounced in a 0.5-oct frequency range centeredon 1 kHz. Thus,on the interactionbetweensessionsand conditions:An advantage average, the apex frequencies were0.5 oct higherin thepeak for the peak conditionwas foundonly during the first sescondition than in the trough condition, but instantaneous fresion.For the otherfour subjects,however,betterthresholds quency varied within the same limits for the two conditions. for the peakconditionwere foundin eachsession.For subFor each condition, as in experiment3, ten threshold jects KM, LD, and FD, this effectwas not significantlyremeasurements were made for subjectsKM, LD, and HP. It ducedin the fourth session,during which the troughcondican be seen in Table 1V that the results were similar to those tion was favoredby the introductionof AM. For subjectHP, obtainedin experiment3. Again,thresholds were abouttwo theAM wasapparently effective,but notpowerfulenoughto times lower in the peak condition than in the troughcondireversethe previoustrend. Thus the data suggestthat fretion. Thus the discrimination asymmetry observed in experiquencypeaksand troughsare not perceivedwith the same ments 2 and 3 seems to be relatively independent of freaccuracyand that theirperceptualasymmetryis largelyunquency register (but more extensive data should be collected affectedby concomitantintensityfluctuations. in this regard). B. Experiment 3 III. GENERAL
DISCUSSION
In experiment 2, thefrequencyshiftsthatsubjects hadto detectwere alwayspositivein the peakconditionand negative in thetroughcondition.In experiment 3, by contrast, the directionsof the shiftswere not dependenton the condition.
In summary,the presentresultsindicatethat thereis an auditory asymmetrybetween the frequencypeaks and troughsof continuously frequency modulated tones.Expert-
712
L. Demanyand K. I. McAnally:Frequencypeaksandtroughs 712
d. Acoust.Soc.Am., Vol.96, No. 2, Pt. 1, August1994
ownloaded 11 Apr 2011 to 193.50.102.40. Redistribution subject to ASA license or copyright; see http://asadl.org/journals/doc/ASALIB-home/info/terms.js
ment 1 showedthat frequencypeaksare more readilyperceivedasauditoryeventsthanfrequencytroughs,at leastfor periodicFM functions in somerangeof ratesanddepths.In experiments2-4, it was shownthat frequencyshifts are easierto detecton a frequencypeak than on a frequency trough,againfor at leastsomerate/depth combinations butin anycasefor peaksandtroughs whicharephysically symmetric on a logarithmicfrequencyscale.It is very likely that thesetwo sets of resultsreflect the operationof common auditorymechanisms. However,we are presentlyunableto explainthem.The resultsof experiment1 were not predictable from what is knownaboutstreamsegregation phenomena in discretemelodicsequences (Heiseand Miller, 1951; van Noorden,1975:Bregman,1990), and we foundin this experimentthat discreteversionsof the continuousFM signalsdid not producean analogousauditoryeffect.With respectto experiments2-4, the observedpeak/troughasymmerry could not be ascribedto differencesin frequency register,nor to the presenceof artefactualintensityfluctuations.Note also that the resultsof experiments2-4 are in contrastto thosepredictedby consideration of the upward spread of forwardmasking(see,e.g.,Moore,1978):Thefact thata 70-ribpuretonehasa largerforwardmaskingeffecton higher-frequency tonesthanon lower frequencytonesa priori favoredthe troughconditions. To thebestof our knowledge,only two previousstudies were devoted to the discriminationof frequencyshifts in stimuli possessing somesimilaritywith thoseinvolvedin experiments 2-4. Theywereperformed by Horst(1989)and Mermelstein(1978). Horst(1989)measured thresholds for shiftsin FM peaks (but not troughs),using 140-ms stimuli with bell-shaped
tions of the secondformant; such was not the case in the/b/
713
L. Demanyand K. I. McAnally:Frequencypeaksand troughs 713
context.In this connection,it is interestingto point out that
thehumanvocaltractseemsto be unableto produce/CVC/ syllablesin which eachof the vowel'sfirst threeformants would be reachedfrom a higherfrequency.Dotman et al. (1975) synthesized "pseudosyllables" of thiskind.The spectral mirrorimagesof thesestimuliwereheardby thelisteners as/bVb/syllables,in whichthevowelcouldbe easilyidentified. For the pseudosyllables, however,Dotmanet al. reportthatthevowelwas "extremelydifficultto identify"(p. 125). Our resultssuggestthat the difficulty originated,at leastpartly,from an auditoryprocesswhichis notconcerned with the perceptionof speechper se. Another related study was performedby Porter et al. (1991). They measureddifferencelimensfor the onsetfrequencyof speechformanttransitions. Their stimuliconsisted of a short(30-120 ms) frequency glidefollowedby a fixed (l.8-kHz) frequency plateau.Whenthedurationof theglides was 60 ms or more,they foundthat shiftsin the onsetfrequencywerebetterdetectedfor fallingglidesthanfor rising
glides? Theauthors ascribed thisresult to thefactthatthe standardonsetfrequencywas in a higherregisterfor the falling glidesthanfor the risingglides.However,thisinterpretationis notveryconvincing sincethedifferencein question amountedto at mosthalf an octave(2.1 vs 1.5 kHz). Our resultssuggestinsteadthat the observedasymmetryarose becausesubjectshad to detectshiftsin a frequencypeak for
thefallingglidesanda frequency troughfor therisingglides. In the experiments reportedby Porteret al. (1991), shiftsin the onsetfrequencyof a glidewereassociated with changes in itsslope.Hence,it mightbe hypothesized thatthe realauditoryasymmetryunderlyingthe observed effectconmodulations 3 andcarriers of various types. Fora sinusoidalcernedthe processingof the slopesper se. Namely,the Weber fractionwould be smallerfor negativeslopesthan for carrieranda standardapexfrequencyof 2 kHz, he foundthat the thresholdincreasedwhen the standardfrequencyswing positiveslopes.However,thishypothesis is notsupported by the resultsof Dooley and Moore (1988a), who managedto varied from 0 to 40 cents,but remainedapproximatelyconmeasurediscriminationthresholdsfor the slopes of linear stant,at about20 cents,for largerfrequencyswings(up to 170 cents); this thresholdvalue of 20 cents is close to the frequencyglideswithoutprovidingfrequencyonsetor offset averagethreshold measured in the peakconditionof experi- cues.They foundsimilarWeberfractions(circa 0.06) for risingversusfalling glides. ment2, wherethestandard swingwas600 cents(seeFig. 4). The goalof Mermelstein(1978) wasto assess the influFew experiments havebeendoneon the discriminability ence of a consonantal context on the difference limens of of frequencyglideswith supraliminaislopes,but muchwork vowels' formantfrequencies.His syntheticspeechstimuli has been devoted to the mere detection of FM for linear includedtokenscorresponding to FoVb/and/gVg/, in which frequencyglides(SergeantandHarris, 1962;Pollack,1968; the secondformantof the vowel (V) was reachedeitherfrom Gardner and Wilson, 1979; Tyler eta!., 1983; Schouten, a lowerfrequency(in the/b/context)or from a higherfre1985, 1986; Dooley and Moore, 1988b) or relatedstimuli quency(in the/g/ context).Dependingon the vowel used, (Nfib•iekand Hirsh, 1969;Tsumuraet al., 1973;Arlinger the difference limen of the second formant was found to be et al., 1977a, 1977b; Carlyonand Stubbs,1989). In someof eithersimilar in the two contexts,or higher in the Fo/context. these studies (Tsumura etal., 1973; Dooley and Moore, The lattereffectis contraryto whatour resultswouldpredict. 1988b),lower thresholds were foundfor falling glidesthan Note, however,that in Mermelstein'sstimuli (as well as in for risingglides,which seemsconsistentwith the discriminaturalsyllables), therewasno physicalsymmetry between nation data discussedabove (Porteret al., 1991). However, the secondformanttransitions of/bVb/and/gVg/: The FM an oppositetrendwasobservedin otherstudies(Gardnerand swing(in Hertz or in cents)wasmuchlargerfor/bVb/than Wilson, 1979; Schouten,1985, 1986; Carlyon and Stubbs, for/gVg/, whateverthe vowel; this shouldhavefavoreddis1989), whileArlingeret al. (1977b) foundno asymmetryat crimination in the/g/context. all. it seemsimpossibleto make senseof lheseapparentdisIn Mermelstein'sexperiments,the/g/context may also crepancies,for the momentat least. havebeen favoredbecause,in/gVg/, the transitionsof the Althoughno firm conclusion canbe drawnwith respect first and third formants differed in direction from the transito the influenceof FM directionon FM detection,it is very d. Acousl.Soc.Am.,Vol.96, No. 2, Pt. 1, August1994
ownloaded 11 Apr 2011 to 193.50.102.40. Redistribution subject to ASA license or copyright; see http://asadl.org/journals/doc/ASALIB-home/info/terms.j
likely that thereis a directionalasymmetryin the representation of rapid and wide frequencyglides in the auditory periphery,dueto the phasedispersive properties of thebasilar membrane.Indeed,it hasbeen repeatedlyobservedthat risingandfallingglidesdo not havethe samemaskingeffect on a tonalprobepresented in theirspectralcenter(Zwicker, 1974; Smoorenburg and Contrix,1980; Kemp, 1982; Smith et al., 1986; Kohlrausch,1988); the maskingeffect of rising glides is larger,which can be accountedfor by a realistic modelof soundprocessing in the innerear (Smithet al., 1986). Presumably, cochlearmechanisms are alsolargelyor wholly responsible for the fact that,at very shortstimulus durationsand in a backgroundof widebandnoise,a tone gliding upwardshas a lower intensitydetectionthreshold (audiometric threshold)thana toneglidingdownwards (see,
e.g.,N•b•lek,1976;CollinsandCullen,1984).However, we do not seehow thejust-mentioned observations can be logically linkedto our basicfinding.The existenceof an asymroetry in loudnessbetweenrising and falling glides at the same(moderateor high)SPL wouldbe morerelevantbut, to our knowledge,thereis no publishedreportof suchan asym-
troughasymmetrythatwe observedfor continuous FM is not the same as that observedfor discretesequencesof tone
pulsesby Watsonet al. (1975).In orderto get asymmetric backwardinterferenceeffectswith discretesequences, it is crucial to use unpredictablesequences,randomizedfrom trial to trial. Watsonet al. (1976) showedthat when such is
not the case,backwardinterferenceis essentiallyabolished. This suggeststhat the backwardinterferenceeffectsobtained by Watson et al. {1975) should be interpretedin terms of attentionand takeplaceat a very centrallevel of the auditory
system.Like the sequences of Watsonet al. (1975), the FM stimuli that we usedin experiments2-4 were randomized from trial to trial (in frequencyregister,within0.5 oct). But we arenowreplicatingexperiment 2 withoutthisrandomization,andit is alreadyclear(for twosubjects) thatremovingit increasesthe differencebetweenthresholdsfor peaksand troughs,in completecontrastto the predictionsuggested by the data of Watson et al. Therefore, we doubt that the FM
asymmetryis to be interpretedin termsof altention. Clearly, the processingof FM by the human auditory systemis far from being understood. In themselves,the reroetry.Contrixand Smoorenburg (1976) measured boththe sults reportedhere call for additionalstudiesincludinga The existenceregionof the loudnessand the maskingeffect of risingfrequencyglides. variationof severalparameters. peak/trough asymmetryis still unknown.ExperimentI sugThey found no correlationacrosssubjectsin the two correwith modulationdepth, sponding tasksandconcludethatmaskingandtheperception gestedthat thisasymmetryincreases but the effect of modulation rate was not assessed. The latter of loudnesswere probablydeterminedby differentauditory effectmightbe nonmonotonic: In listeninginformallyto FM processes. function 1 at modulation rates exceeding2 Hz, we noticed It mightbe considered that Watsonet al. (1975) prothat this stimulus could be split into concurrentstreams vided a clue to the origin of the auditoryasymmetryobamong which one was made up of a repeatedtone correservedhere,althoughthey usedquitedifferentstimuli.Their sponding to the global frequency minimum (Z): this ministimuli were sequencesof ten 40-ms tone pulses,presented mum could then be heard very clearly, in contrast to what withoutsilentintervalsbetweenpulses.On a giventrial, two
suchsequences hadto be comparedin a same/different paradigm.In the firstsequence, frequency variedunpredictably frompulseto pulse,in a widerange(e.g.,250-900 Hz). The secondsequence waseitheridenticalin all respects, or differingin thefrequencyof a singleandunpredictable pulse.It was found that detectabilityof the frequencyshifts (expressedin relativeterms)waspositivelycorrelated to pulse frequency,which is not surprisinggiven the pulsedurations (Moore, 1973). However,an unexpected interactionbetween frequencyand temporalpositionwas also observed:For a pulse which was the highestcomponentof the two sequences,the detectability of a givenfrequencyshiftwas essentiallyindependent of the temporalpositionof thispulse; by contrast,for pulseswith lowerfrequencies, detectability wasverydependent on temporalpositionandwasbestat the endof thesequences. Thusit appeared thata pulseproduced "backward interference"effectson the auditoryrepresentation of previouspulses,and thatthisbackwardinterference wasasymmetric in frequency(stronger for higher-frequency interferers).This seemsto shedsome light on our own results:It may be hypothesized that in experiments 2-4, shifts in frequencymaximawerebetterdetectedthanshiftsin frequencyminimabecause the miniranwerefollowedby higher frequencies thatproduceddeleterious backwardinterference effects.
However,the preliminaryresultsof an experimentcurrently underwayin our laboratorysuggestthat the peak/ 714
J. Acoust.Soc. Am., Vol. 96, No. 2, Pt. 1, August1994
occurred for a rate of 1.5 Hz.
ACKNOWLEDGMENTS
This work was supported,in part, by grantsfrom the
ConsellR•gionald'Aquitaine. AuthorLD is affilialedwith the CentreNationalde la Recherche Scientifique(CNRS). Author KM's stay in Bordeauxwas made possibleby the CNRS "Cognisciences"Program. We thank Albert Bregman,Jean-MarcDeshouillers,and RichardParncuttfor helpful discussions. We are also gratefulto Marjorie Leek and Brian Moore for theirconstructivereviewsof the initial typescript. qf theinitiallyreported number of notes seemed tobeinconsistent withthe sungor whistledresponse (stageI of procedure}, this apparentinconsistencywas pointedout to the subject,who reconsidered his or her numerical judgmenl.
-'Theslarting points of theidentified motifswerenotconsidered asdistinctive featuresof theresponses. For instance, we did notdiscriminate "Z-X" from "X-Z." The startingpointsselectedin TablesII and Ill are the dominantstartingpointsin subjects'responses.
3Each FM function consisted of a piecewise juxtaposition of threeparabolas in linear lime and frequencycoordinates.Thus the functionsusedby Horst (1989) differedfrom thosewe usedin the peakconditionsof experiments 2-4, althoughtheir shapeswere roughlysimilar.
4Theauthors alsoreport thatincrements intheslope of theglideswerebetter detectedthandecrements. Our own resultsdo not clarify this curiousfinding.
L Demanyand K. I. McAnally:Frequencypeaks and troughs
714
ownloaded 11 Apr 2011 to 193.50.102.40. Redistribution subject to ASA license or copyright; see http://asadl.org/journals/doc/ASALIB-home/info/terms.js
Arlinger,S. D., Jerlvall,L. B., Ahr6n,T., andHolmgren,E. C. (1977a). "Discrimination of frequencyrampsin subjectswith ceehlearhearing loss,"Acla Ololaryngol.83. 310-316.
Moore,B.C. J., andGlasberg.B. R. {19831."Suggcsted finmulaefor calculating auditory-filterbandwidthsand excitationpatterns,"J. Acoust. See. Am. 74, 750-753.
Arlinger,S. D., Jerlvall,L. B.. Ahr6n,T., andHolmgren,E. C. (1977b). "Thresholds for linearfrequency rampsof a continuous puretone,"Acta
Moore, B.C. J., and Ginsberg,B. R. (19861."The relationshipbetween
Otolaryngol.83, 317-327. Attneave,F., andOlson,R. K. (19711."Pitch as a medium:A new approach to psychophysical •aling," Am. J. Psychol. 84, 147-166. Bregman,A. S. (19901.Auditor)'SceneAnalysis(MIT, Cambridge,MA). Bregman,A. S., and Dannenbring, G. L. (1973). "The effectof continuity on auditorystreamsegregation," Percepl.Psychophys. 13, 308-312. Carlyon,R. R, and Stubbs,R. J. {19891."Detectingsingle-cyclefrequency modulationimposedon sinusoidal,harmonic,and inharmoniccarriers,"J.
lateralandbilateralcochlcarimpairments," in AuditoryFrequentySelecttrio', editedby B.C. J. MooreandR. D. Patterson (Plenum,New York).
Acoust. See. Am. 85, 2563-2574.
Collins,M. J., andCullen,J. K. (1984). "Effeclsof background noiselevel on detectionof toneglides."J. Acoust.See.Am. 76, 1696-1698. Conins, E, and Smoorcnburg, G. F. (1976). "Loudnessof stimuli with a sweeping frequency," Proceedings of theNoiseControlConfen'nee (War•w. Poland),pp. 149-152. Cooper,W. E., and Sorerisen, J. M. (19811.FundamentalFrequeno'in SenreneeProduction1Springer-Verlag,New York). Demany,L., and Semal,C. (19861."On the delectionof amplitudemodulationandfrequencymodulationat low modulationfrequencies," Acustica 61, 243-255.
Domany,L., and Semal, C. (1989). "Detection thresholdsfor siuusoidal frequencymodulation," J. Acoust.Sec.Am. 85, 1295-1301. Dooley,G. 1., and Moore, B.C. J. (1988a). "Durationdiscrimination of steadyandglidingtones:A new methodfor estimatingsensitivityto rate of change,"J. Acoust.Soc.Am. 84, 1332-1337. Dooley,G. J., and Moore,B.C. J. (1988b). "Detectionof linearfrequency glidesas a functionof frequencyand duration,"J. Acoust.Soc.Am. 84, 2O45-2057.
Dorman,M. F., Culting,J. E., and Raphael,L. J. (19751."Perceptionof temporalorderin vowel sequences with and withoutformanttransitions," J. Exp. Psychol.(HumanPercep.Perform.)104, 121-129. Edwards,B. W., andViemeister,N. F. (1994). "Psychoacoustic equivalence of frequencymodulationand quasi-freqnency modulatioo,"J. Acoust. See. Am. 95, 1510-1513.
Gardner,R. B., aud Wilson, J.P. (19791."Evidencefor direction-specific channelsin theprocessing of frequencymodulation," J. Acousl.Soc.Am. 66, 704-709.
Handel, S., Weaver,M. S., and Lawson,G. 0983). "Effect of rhythmic groupingon streamsegregation," J. Exp. Psychol.:HumanPercept.Perform. 9. 637-651.
Hartmann,W. M., andKlein. M. A. (1980•. "Theoryof frequencymodulation detectionfor low modulationfrequencies,"J. Acoust.Soc.Am. 67, 935-94t•.
Heise,G. A., and Miller, G. A. (19511."An experimentalstudyof auditory patterns,"Am. J. Psychol.64, 68-77. Horst,J. W. (1989}."Detectionanddiscrimination of frequencymodulation of complexsignals,"J. Acousl.See.Am. 85, 2022-2030. Jones, M. R., Kidd, G., and Wetzel, R. (1981). "Evidence for rhythmic attention,"J. Exp. Psychol.:Human Percept.Perform.7, 1059 1073.
Kaernbach. C. (1991}. "Simpleadaptivelestingwith theweightedup-down method,"Percept.Psychophys. 49, 227-229. Kay, R. H. (1982}. "Hearingof modulationin sounds,"Physiol.Rev.62, 894 -975.
Kemp,S. ( 19821."Maskingperiodpatterns of frequency modulated tonesof differentfrequencydeviations,"Acustica50, 63-69. Kohlrausch,A. (19881. "Masking patternsof harmoniccomplex tone maskers and the role of the inner ear transfer function," in Basic Issues ia
Hearing. editedby H. Duifhuis,J. W. Horsl, and H. P. Wit {Academic, London).
Mermelslein,P. (19781. "Difference limens for formantfrequenciesof steady-stateand consonant-bound vowels," J. Acoust.Soc. Am. 63, 572-
Nfib•lek,I. (19761.'*Masking of toneglides,"in HearingandDavis,edited by I. J. Hirsh,D. EIdredgc,E. Hirsh,andS. R. Silverman(Washington U. R, St. Louis, Mll.
Nfib•lek,I., and Hirsh,I. J. {1969}."On the discrimination of frequency transitions," J. Acoust. Soc. Am. 45, 1510-1519.
Noorden,k P.A. S. van (19751."TemporalCoherencein lhc Perceptionof Tone Sequences."Deetotal dissertation. TechnischeHogcschoolEindhoven, The Nelherlands.
Ozimek, E., and Sek, A. {1987}. "Perceptionof amplitudeand frequency modulatedsignals(mixedmodulation}," J. Acoust.Soc.Am. 82, 159816113.
Piekelt,J. M. (19801. The Soundsof,SpeechCommunication{University Park, Baltimore}.
Pollack,i. {19681."Dclectionof rule of changeof auditoryfrequency,"J. Exp. Psychol.77, 535-541. Porter, R. J., Cullen, J. K., Cullins, M. J., and Jackson,D. F. {1991). "Dis-
criminationof formanttransitiononsetfrequency:Psychoacoustic cuesat short,moderate,and longdurations,"J. Acoust.See.Am. 90, 1298-1308. Regan,D., andTansley,B. W. (1979l. "Selectiveadaptation to frequencymodulatedtones:Evidencefin an informatiou-preeessing chaunel
Romani,G. L., Williamson,S. J., and Kaufman,L. (19821. "Tonotopic organization of Ihc humanaudilorycortex,"Science216, 1339-1340. Scharf, B. (1970). "Critical bands," in Foundationsof Moder, Auditory TitcoO' •14d.IL editedby J. V. Tobias(Academic,New Yorkk Schouten,M. E. H. {1985). "ldentificatinnand discriminationof sweep tones,"Percept.Psychophys. 37, 309-376. Schoutcn,M. E. H, (1986L "Three-wayidentificationof sweeptones," Percept.Psycbophys. 40, 359-361. Sergeant,R, L., andHarris,J. D. (1962). '*Sensitivilyto unidirectional frequencymodulation." J. Acoust.Soc.Am. 34, 1625-1628. Showcr,E.G., andBiddulph,R. (1931). "Differentialpitchsensilivityof the ear." J. Acoust. See. Am. 3, 275-287. Smith, B. K., Sicben, U. K., Kohlrausch, A., and Schroeder, M. R. (1986).
"Phaseeffects in maskingrelatedto dispersionin the inner ear," J. Acx)ust.Soc. Am. 80, 1631-1637.
Smoorenburg, G. F., andCurtins.E (1980}. "Maskingof shortprobesounds by toneburstswith a sweepingfrcquency."Hear.Res,3. 301-316. Thomassen,J. M. (1982). "Melodic acecut:Experimentsand a tenlalive model," J. Acoust. Sin:. Am. 71, 1596-10()5.
Tsumura,T., Sone,T., and Nimura, T. (1973L "Auditory detectionof fre-
quencytransition,"J. Acousl.Soc.Am. 53, 17-25. Tyler, R. S., Wood,E. J., and Fernandes,M. (1983}. "Frequencyresolution and discrimination of constantand dynamictonesin normaland hearingimpairedsubjects," J. Acousl.Soc.Am. 74, 1190 1199. Wakefield,G. H., and Viemeister,N. E (1984l. "Selectiveadaptationto linear frequency-modulated sweeps:Evidencefor directjun-specific FM channels?,"J. Acoust. Soc. Am. 75, 1588-1592.
Watson,C. S., Wroton, H. W., Kelly, W. J., and Bcnbassal,C. A. (1975l. "Factorsin the discrimination of tonalpatterns.I, Componentfrequency, temporalposition,and silent intervals,"J. Acousl.Soc. Am. 57, 11751185.
Watson,c. s., Kelly, W. J., and Wroton,H. W. (19761."Factorsin the discrimination of tonalpatterns.II. Selectiveattentionand learningunder various levels of stimulusuncertainty,"J. Acousl. See. Am. 60, 1176 !186.
Zwicker,E. (1952}. "Die Grenzender H6rbarkeitder Amplitudenmodula-
580.
Moore, B. C. J. (1973). "Frequencydifferencelimens for short-duralion tones," J. Acoust. Soc. Am, 54, 610-619.
Moore,B.C. J. (1978). "Psychophysical tuningcurvesmeasured in simultaneousand forwardmasking,"J. Acoust.Soc.Am. 63, 524-532.
715
frequency selectivity andfrequency discrimination forsubjects withuni-
J. Acoust.Soc.Am., VoL 96, No. 2, Pt. 1, August1994
tion und der Frequenzmodulation einesTones,"Acustica3, 125-133. Zwicker,E. (1974). "Loudnessandexcitationpatlernsof stronglyfrequency modulated tones,"in Sensation and Measurement, editedby H. R. Moskowitz et al. (Reidcl, Dordrecht, The Netherlands).
L. Demanyand K. I. McAnally:Frequencypeaksand troughs
715
ownloaded 11 Apr 2011 to 193.50.102.40. Redistribution subject to ASA license or copyright; see http://asadl.org/journals/doc/ASALIB-home/info/terms.j