The Macroeconomic Effects of Housing Wealth, Housing Finance, and Limited Risk Sharing in General Equilibrium
Jack Favilukis University of British Columbia
Sydney C. Ludvigson New York University and National Bureau of Economic Research
Stijn Van Nieuwerburgh New York University, National Bureau of Economic Research, and Centre for Economic Policy Research
This paper studies a quantitative general equilibrium model of housing. The model has two key elements not previously considered in existing quantitative macro studies of housing finance: aggregate business cycle risk and a realistic wealth distribution driven in the model by bequest heterogeneity in preferences. These features of the model play a crucial role in the following results. First, a relaxation of financing constraints leads to a large boom in house prices. Second, the boom in house prices is entirely the result of a decline in the housing risk premium. Third, low interest rates cannot explain high home values.
I. Introduction Residential real estate is a large and volatile component of household wealth. Moreover, volatility in housing wealth is characterized by large This material is based on work supported by the National Science Foundation under grant 1022915 to Ludvigson and Van Nieuwerburgh. We are grateful to Alberto Bisin, Electronically published December 21, 2016 [ Journal of Political Economy, 2017, vol. 125, no. 1] © 2017 by The University of Chicago. All rights reserved. 0022-3808/2017/12501-0001$10.00
140
housing wealth, housing finance, and limited risk sharing
141
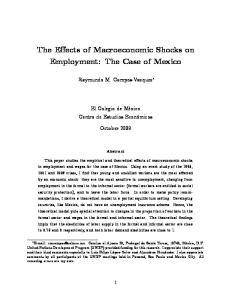
swings in house prices relative to housing fundamentals. For example, figure 1 shows that national house price-rent ratios climbed to unusual heights by the end of 2006 but have since exhibited sharp declines. What lies behind such volatility in housing markets? It is well understood that the period leading up to the peak of the housing boom was characterized by two systemic changes in housing finance. First, the period was characterized by a widespread relaxation of underwriting standards that reduced housing financing constraints in both US and international mortgage markets. Conversely, the housing bust that followed was associated with a subsequent reversal of these standards. Second, the entire period was characterized by a sharp increase in foreign purchases of US Treasury and agency debt and steady declines in US real interest rates. Yet despite broad agreement on these historical facts, there is little academic consensus on the degree to which such changes can explain large fluctuations in home prices in quantitative macroeconomic models. Indeed, there is quite a bit of disagreement on these points (see the literature review below). At the same time, the extant literature is largely silent on the extent to which economywide changes in housing finance might cause fluctuations in a number of pivotal endogenous variables that could serve as transmission channels for generating volatility in house prices. These include risk premia in housing and equity markets, measures of cross-sectional risk sharing, and life cycle patterns in wealth accumulation and savings. The objective of this paper is to study a quantitative macroeconomic model that is general enough to address these questions. To do so, we specify a two-sector general equilibrium model of housing and nonhousDaniele Coen-Pirani, Dean Corbae, Morris Davis, Bernard Dumas, Raquel Fernandez, Carlos Garriga, Bruno Gerard, Francisco Gomes, James Kahn, John Leahy, Chris Mayer, Jonathan McCarthy, François Ortalo-Magne, Stavros Panageas, Monika Piazzesi, Richard Peach, Gianluca Violante, and Amir Yaron and to seminar participants at Erasmus Rotterdam, the European Central Bank, International College for Economics and Finance, HEC Montreal, London School of Economics, London Business School, Manchester Business School, New York University, Stanford Economics, Stanford Finance, University of California, Los Angeles Finance, University of California, Berkeley Finance, Université de Lausanne, University of Michigan, University of Tilburg, University of Toronto, the University of Virginia McIntyre/Darden joint seminar, the American Economic Association annual meetings, January 2009 and January 2010, the Economic Research Initiatives conference at Duke 2010, the London School of Economics Conference on Housing, Financial Markets, and the Macroeconomy May 18–19, 2009, the Minnesota Workshop in Macroeconomic Theory July 2009, the NBER Economic Fluctuations and Growth conference, February 2010, the European Finance Association meetings Frankfurt 2010, the NBER Economics of Real Estate and Local Public Finance Summer Institute meeting July 2010, the Society for Economic Dynamics Montreal 2010, the Utah Winter Finance Conference February 2010, the NBER Asset Pricing Meeting April 2011, the 2011 Western Finance Association meeting, the Baruch New York City Real Estate meeting 2012, and the 2012 Philadephia Workshop on Macroeconomics for helpful comments. Any errors or omissions are the responsibility of the authors. Data are provided as supplementary material online.
142
journal of political economy
F IG . 1.—Price-rent ratios in the data. The figure compares three measures of the pricerent ratio: Flow of Funds from NIPA; Freddie Mac, from the Bureau of Labor Statistics’ (BLS) price index of shelter; and Core Logic. The data are quarterly from 1970:Q1 until 2012:Q4 (or whenever first available). All price-rent series are normalized to a value of 100 in 2000:Q4.
ing production, where heterogeneous homeowners face both idiosyncratic and aggregate risks but have limited opportunities to insure against these risks because of incomplete financial markets and collateralized borrowing constraints. A house in our model is a residential durable asset that provides utility to the household, is illiquid (i.e., expensive to trade), and can be used as collateral in debt obligations. The model economy is populated by a large number of overlapping generations of homeowners who receive utility from both housing and nonhousing consumption and who face a stochastic life cycle earnings profile. Interest rates in the model, like housing and equity returns, are determined endogenously from a market clearing condition. The model we study has two key elements not previously considered in existing quantitative macro studies of housing finance but that we find play a crucial role in the results. First, the model includes aggregate business cycle risk, in addition to idiosyncratic income risk. Second, the model includes a mechanism for generating a realistic wealth distribution. Specifically, the model matches the highly skewed US wealth distribution by presuming the presence of two types of households: a small minority who are born wealthy as a result of receiving a deliberate bequest (and who themselves leave bequests upon death) and a much larger majority who receive small or zero bequests and start working life with little wealth. We refer to this element of the model as bequest heterogeneity. The significance of both of these features of the model is discussed below.
housing wealth, housing finance, and limited risk sharing
143
Within the context of this model, we focus our theoretical investigation on the macroeconomic consequences of the two systemic changes in housing finance described above. First, we investigate the impact of an economywide change in housing collateral constraints, a phenomenon we refer to hereafter as a financial market liberalization. Second, we investigate the impact of a sustained influx of foreign capital into the domestic bond market. We use our framework as a laboratory for studying the impact of fluctuations in either direction of these features of housing finance. The model economy is populated entirely by homeowners. It delivers a measure of aggregate house prices relative to fundamental value equal to the endogenous national house price index divided by the aggregate (across homeowners) housing service flow value, where the latter is measured for an individual as the ratio of the marginal utility of housing services to that of the nonhousing consumption flow. We aggregate this marginal utility ratio across households and divide it into the model’s house price index, a quantity we refer to as the price/marginal utility ratio, or P/ MU ratio for short. The P/MU ratio implicitly defines an aggregate housing return, equal to the house price index (less depreciation) plus MU, expressed as a fraction of last period’s house price index. Since the model parameters satisfy a transversality condition that effectively rules out a bubble in this nontraded asset, a standard first-order approximation shows that the log P/MU ratio can fluctuate through only one of three channels: (i) positively with increases in expected future MU growth, (ii) negatively with increases in expected future interest rates, or (iii) negatively with increases in the expected future housing return in excess of the interest rate, an endogenous quantity we refer to as the national housing risk premium. If the housing risk premium is sizable enough, variation in it can create large movements in P/MU. We study how the systemic changes in housing finance described above affect the P/MU ratio through each of these three channels. We summarize four key findings from the model. An economywide relaxation of collateral requirements generates a large boom in house prices relative to housing fundamentals.—Existing studies of quantitative macro models with housing typically find that changes in financing constraints have surprisingly small effects on house prices. By contrast, when we consider an empirically plausible relaxation of credit constraints for the period 2000–2006, this change alone generates an increase in the P/MU ratio equal to more than 60 percent of the increase in observed price-rent ratios over this period from two different US data sources and 40 percent of that from a third data source. When we combine this with a plausible sequence of business cycle shocks, the model P/MU ratio increases by an amount equal to virtually all of the increase of two of the price-rent ratios over the course of a dynamic transition. The model also predicts a sharp decline in home prices starting in 2007, driven by the
144
journal of political economy
economic contraction and by a presumed reversal of the financial market liberalization (but not the foreign capital inflow). The model studied here has two key elements that are missing from quantitative macro models that predict small effects on house prices from changing financing constraints. The first is aggregate business cycle risk (in addition to idiosyncratic income risk). The second is bequest heterogeneity (or a plausible wealth distribution). We find that both are important for generating large changes in house prices from economywide movements in collateral requirements. Aggregate business cycle risk is important because it contributes to sizable risk premia in housing (and equity) markets. Business cycle shocks lead to endogenous changes in financing constraints through their equilibrium effects on collateral values. Since financing constraints directly alter a household’s ability to insure against risks, any given change in constraints will have greater influence on risk premia in a model in which business cycle risk is present rather than absent. By considering a special case of our model without business cycle risk, we can show that the presence of such risk amplifies the impact of changing financing constraints on the P/MU ratio. But the second element of the model responsible for this result is bequest heterogeneity. By calibrating the model to match the high degree of wealth inequality in the data, along with a plausible value for the mean real interest rate, we are naturally led to a specification in which a substantial fraction of housing demand is attributable to households that are constrained or close to constrained. Importantly, the number of constrained households is not specified exogenously, but is instead disciplined by the requirement that the model match the wealth distribution. Under these circumstances, an unanticipated economywide change in collateral requirements is itself an important source of aggregate risk that cannot be insured away. In a special case of the model without bequest heterogeneity, too few households are constrained and changing financing constraints have only a small impact on national home values. But this special case also generates a wealth distribution with far too little inequality. A relaxation of collateral constraints drives up the housing P/MU ratio because it drives down the housing risk premium.—Risk premia on both housing and equity in the model economy fluctuate with an aggregate productivity shock that drives the business cycle. But business cycle risk is not the only source of aggregate risk premia in the model. When a nontrivial fraction of households operate close to their collateral constraints, any economywide fluctuation that alters these constraints is itself an important source of aggregate risk. This can be seen in the model by observing that economies with lower collateral requirements but the same level of business cycle risk exhibit less volatile consumption, more risk sharing, less precautionary saving, and lower housing and equity risk premia. A relax-
housing wealth, housing finance, and limited risk sharing
145
ation of constraints improves households’ ability to insure against risks and generates an endogenous decline in the housing risk premium. At the same time, less binding financing constraints increase housing demand. We show that a financial market liberalization drives up the P/MU ratio precisely because it drives down the housing risk premium. In fact, in the general equilibrium of the model, a housing boom from a relaxation in financing constraints is generated only through a decline in the housing risk premium. Specifically, the boom cannot be explained by a decline in interest rates; nor can it be explained by an expectation of faster growth in housing fundamentals. The reason is that the increase in aggregate housing demand that results from a financial market liberalization leads to an endogenous increase in residential investment and an expected decline in MU growth. And although lower collateral requirements generate a housing boom, they also cause households to endogenously respond to the improved risk-sharing opportunities by reducing precautionary saving, which leads to an increase in the equilibrium real interest rate. Both of these adjustments have the effect of reducing P/MU rather than increasing it. It follows that the P/MU ratio can rise in response to a relaxation of financing constraints only if the decrease in the housing risk premium more than offsets the combined effects of faster expected MU growth and a higher real interest rate. Lower interest rates cannot explain a large boom in house prices.—The housing boom that occurred in the first part of the twenty-first century was characterized by both lower collateral requirements and lower real interest rates. Since a relaxation of financing constraints cannot by itself generate lower equilibrium interest rates (indeed it generates the opposite), the model implies that some other factor must have been at work to explain the decline in observed interest rates over this period. This underscores the importance of including foreign capital flows in our model. Once we allow for a quantitatively plausible influx of foreign capital into the domestic bond market, the model generates a large decline in the equilibrium real interest rate even in an economy with lower collateral requirements. But while a large foreign capital inflow can explain why interest rates declined, it cannot explain why house prices rose. The reason is that the influx of foreign capital that drives interest rates down in the first place crowds domestic savers out of the safe bond market, exposing them to greater systematic risk in equity and housing markets. In endogenous response, risk premia on housing (and equity) assets rise, substantially offsetting the effects of lower interest rates on home prices. A financial market liberalization plus a foreign capital inflow lead to a shift in the composition of wealth toward housing, increase financial wealth inequality, but reduce housing and consumption inequality.—A financial market liberalization plus an inflow of foreign capital into the domestic bond market
146
journal of political economy
lead households of all ages and incomes to shift the composition of their wealth toward housing, consistent with observed changes in householdlevel data from 2000 to 2007. These factors also have implications for inequality and risk sharing. We show that a financial market liberalization and foreign capital infusion reduce consumption and housing wealth inequality but increase financial wealth inequality. The model we explore is a rich quantitative paradigm that produces a large number of testable implications. We find that it does a good job of matching a range of stylized facts of financial markets, housing markets, and business cycle data. For example, the baseline model produces a sizable equity premium and empirically accurate Sharpe ratio along with a low and stable real interest rate. But the framework is limited in its ability to explain several important aspects of the data. In particular, the model understates empirical estimates of housing return volatility derived from data on individual house returns (Flavin and Yamashita 2002; Landvoigt, Piazzesi, and Schneider 2015). In the robustness section of the paper, we report the results of one attempt to address this limitation by adding idiosyncratic depreciation risk to the model but find that such a modification has only a small quantitative impact on the result. The model also generates half of the observed volatility in equity returns, too much predictability in dividend growth, and too little predictability in excess returns at long horizons but too much at short horizons. It will be of interest to explore theoretical modifications in future work that might bring these aspects of the theory more in line with the data, such as considering different forms of idiosyncratic housing risk and additional aggregate shocks. The rest of this paper is organized as follows. The next section discusses related literature. Section III describes recent changes in the key aspects of housing finance discussed above: collateral constraints and foreign capital in US debt markets. Section IV presents the theoretical model. Section V presents our main findings. Section VI presents conclusions. The Appendix contains a large amount of additional information, including evidence on changing housing finance conditions, a detailed explanation of the model’s calibration and model solution technique, the results of several checks on the numerical accuracy of the model solution, and the results of an additional case in which the financial market liberalization is accompanied by a decline in borrowing costs as well as a relaxation of financing constraints. II. Related Literature Our paper is related to a growing body of literature in finance that studies the asset pricing implications of incomplete markets models. The focus of much of this literature has been on the equity market implications
housing wealth, housing finance, and limited risk sharing
147
of pure exchange economies with exogenous endowments, with less work specifying a role for housing or the production side of the economy.1 But several important papers study questions related to housing and/ or consumer durables. We are aware of only one other paper (at the time of the first draft of this paper) that solves for equilibrium asset prices in a model in which the portfolio choice problem involves three assets (housing, stocks, and bonds). Piazzesi and Schneider (2012) do so, as here. Other papers typically either do not model production (instead studying a pure exchange economy) and/or the portfolio choice problem underlying asset allocation between a risky and a risk-free asset or are analyses of partial equilibrium environments. See, for example, the general equilibrium exchange economy analyses that embed bond, stock, and housing markets of Lustig and Van Nieuwerburgh (2006, 2010) and Ríos-Rull and Sánchez-Marcos (2008) and the partial equilibrium analyses of Peterson (2002), Ortalo-Magné and Rady (2006), and Corbae and Quintin (2010). Fernández-Villaverde and Krueger (2011) study how consumption over the life cycle is influenced by consumer durables but limit their focus to equilibria in which prices, wages, and interest rates are constant over time. We add to this literature by considering each of these general equilibrium features. We add to Piazzesi and Schneider (2012) by modeling the production side, in two sectors. Generally speaking, these papers are not focused on the role of housing finance in driving house price movements, as here. Two papers that study the relation between debt and the macroeconomy are Iacoviello and Pavan (2013) and Campbell and Hercowitz (2006). Iacoviello and Pavan (2013) study the role of housing and debt for the volatility of the aggregate economy in an incomplete markets model with aggregate risk. Because there is no risk-free asset in their model, their investigation is silent about the role of risk premia in the economy. Campbell and Hercowitz (2006) study the effects of changing collateral constraints in a general equilibrium model that combines collateralized household debt with heterogeneity of time preference. This model contains aggregate risk, but the only security traded is one-period collateralized debt; thus this setup is also silent on the role of risk premia in aggregate fluctuations. The importance of aggregate risk and fluctuating risk premia is a central focus of this paper. To the best of our knowledge, this paper is the first to investigate the role of time-varying risk premia as a primary channel for generating and propagating fluctuations in housing markets. 1 See, e.g., Aiyagari and Gertler (1991), Telmer (1993), Lucas (1994), Heaton and Lucas (1996), Basak and Cuoco (1998), Luttmer (1999) for a study of single-sector exchange economies, or Lustig and Van Nieuwerburgh (2005) for a two-sector exchange economy model. Storesletten, Telmer, and Yaron (2007), Gomes and Michaelides (2008), and Favilukis (2013) explicitly model the production side of the economy but focus on single-sector economies without housing.
148
journal of political economy
Our paper is linked to a literature that studies fluctuations in home prices relative to housing fundamentals. Some researchers have argued that increases in national house price-rent ratios reflect an expected increase in future housing fundamentals, such as rental growth. In partial equilibrium analyses in which discount rates are held constant, this is the only outcome possible (e.g., Sinai and Souleles 2005; Campbell and Cocco 2007). But partial equilibrium analyses overlook the general equilibrium response of both residential investment and discount rates to economic growth. In the general equilibrium of the model studied here, positive economic shocks stimulate greater housing demand and greater residential investment, which causes marginal utility growth to decline rather than increase, as the housing stock expands. Thus high house prices relative to housing fundamentals can reflect only expectations of future house price depreciation (lower housing returns). Outside of the incomplete markets environment, a strand of the macroeconomic literature studies housing behavior in a two-sector, general equilibrium business cycle framework either with production (e.g., Davis and Heathcote 2005; Kahn 2008) or without production (e.g., Piazzesi, Schneider, and Tuzel 2007). The focus in these papers is on environments with complete markets for idiosyncratic risks and a representative agent representation. Kahn (2008) finds that long-term growth trends in house prices and output can generate house prices that are substantially more volatile than output. But this model abstracts from heterogeneity and financial frictions, both of which lie at the heart of movements in risk premia in our framework. We argue here that fluctuations in housing risk premia are essential for understanding the large observed boom-bust patterns in aggregate house prices relative to housing fundamentals, which cannot be readily attributed empirically to either sharp swings in expected growth in housing fundamentals or expected real interest rates. The two papers closest to ours in subject matter are Kiyotaki, Michaelides, and Nikolov (2011) and Sommer, Sullivan, and Verbrugge (2013). Both of these papers study quantitative macroeconomic models with housing, idiosyncratic risk, and financing constraints. And like this study, both papers are focused on the subject of how changes in financing constraints and interest rates affect equilibrium home prices. Unlike this study, however, these models predict that a relaxation of financing constraints has only small effects on house prices, while movements in real interest rates have large effects. Both results contrast sharply with the implications of our model. A virtue of the models considered in Kiyotaki et al. (2011) and Sommer et al. (2013) relative to the one studied here is that they specify endogenous rental markets. But this discrepancy does not appear to be the source of our contrasting results. Our analysis instead indicates that there are three crucial discrepancies. First, both the Kiyotaki et al. and Som-
housing wealth, housing finance, and limited risk sharing
149
mer et al. models are partial equilibrium analyses in which the risk-free real interest rate is an exogenous parameter rather than an equilibrium variable. Second, the models have no quantitatively important sources of aggregate risk, so risk premia are negligible. Third, the models have no mechanism for matching the wealth distribution.2 The first and second of these differences are directly related to the question of whether lower interest rates can theoretically lead to large housing booms. If the interest rate is exogenous and risk premia are negligible, decreasing the interest rate parameter can lead to a large housing boom because doing so does not elicit an offsetting adjustment of the housing risk premium as explained above. In the general equilibrium model here, we cannot hold the housing risk premium fixed when interest rates change as a result of an exogenous impetus (such as an influx of foreign capital). Of course, the question of whether falling interest rates cause housing booms is ultimately an empirical one. Econometric evidence from the United States and other developed nations finds that declining real interest rates do not provide a plausible explanation for the housing boom that occurred at the dawn of the twenty-first century (Favilukis et al. 2013; Glaeser, Gottlieb, and Gyourko 2013). The model here, which generates the boom from a decline in risk premia rather than interest rates, provides a theoretical rationale for these findings. The second and third differences are of paramount importance for the question of whether economywide changes in financing constraints (such as the minimum amount of collateral required to take out a mortgage) have large or small effects on house prices. We find that both aggregate business cycle risk and a realistic wealth distribution are important here. When we shut off business cycle risk in our model, we find a smaller increase in the P/MU ratio in response to a decline in collateral requirements as compared to the benchmark case that includes such risk. When we shut off bequest heterogeneity so that the model has only a single type of agent (where nobody leaves bequests), we find that a reduction in collateral requirements leads to a relatively small increase in house prices and the P/MU ratio. An economywide decrease in collateral requirements can be an important source of aggregate risk only if constrained households account for a sufficiently large component of aggregate housing demand. In the specification without bequest heterogeneity, constrained households are simply too small a fraction for this to occur. This is the same reason Kiyotaki et al. (2011) and Sommer et al. (2013) 2 Although Kiyotaki et al. and Sommer et al. do not emphasize the implications of their models for the wealth distribution, it is well known that the Bewley-style economies they study (as well as almost all macro models) do not generate an empirically plausible degree of inequality unless some additional mechanism such as preference heterogeneity is adopted (Krusell and Smith 1999; Iacoviello 2005). The same is true in our model without bequest heterogeneity.
150
journal of political economy
give for their findings on this question. We note, however, that a version of our model without preference heterogeneity could have a large number of constrained households if the subjective time discount factor were calibrated so that everyone were sufficiently impatient. But with such impatient households, this model would imply a value for the endogenous mean real interest rate that is much too high to match the data. It is important to emphasize that our paper does not address the question of why credit market conditions changed so markedly in recent decades (we discuss this in the conclusion). It is widely understood that the financial market liberalization we study was preceded by a number of revolutionary changes in housing finance, notably by the rise in securitization. These changes initially decreased the risk of individual home mortgages and home equity loans, allowing for a more efficient allocation of risk and, some have argued, making it optimal for lending contracts to feature lower collateral requirements and housing transactions fees (e.g., Green and Wachter 2008; Strongin et al. 2009; Piskorski and Tchistyi 2011). As these researchers note, however, these initially risk-reducing changes in housing finance were accompanied by government deregulation of financial institutions that ultimately increased risk, by permitting such institutions to alter the composition of their assets toward more high-risk securities, by permitting higher leverage ratios, and by presiding over the spread of complex financial holding companies that replaced the long-standing separation between investment bank, commercial bank, and insurance company. Industry analysis suggests that the market’s subsequent revised expectation upward of the riskiness of the underlying mortgage assets since 2007 has led to a reversal in collateral requirements and transactions fees. It is precisely these changes in credit conditions that are the focus of this study. III. Changes in Housing Finance A detailed documentation of changes in the key aspects of housing finance we study, collateral constraints and foreign capital in US debt markets, is given in the Appendix. Here we summarize this evidence as follows. There was a widespread relaxation of underwriting standards in the US mortgage market during the period leading up to the credit crisis of 2007. By the end of 2006, households routinely bought homes with 100 percent financing using a piggyback second mortgage or home equity loan. In the aftermath of the credit crisis that began in 2007, the erosion in credit standards has been reversed.3 Industry analysts indicate 3 Some analysts have argued that, since the credit crisis, borrowing restrictions and credit constraints have become even more stringent than historical norms in the preboom period (e.g., Streitfeld 2009).
housing wealth, housing finance, and limited risk sharing
151
that maximum loan-to-value (LTV) ratios for combined (first and second) mortgages since 2006 have returned to previously normal levels of no greater than 75–80 percent of the appraised value of the home. There was also a significant decline in transactions costs for buying homes and for home equity extraction: pecuniary costs (such as mortgage and home equity closing costs) fell by up to 90 percent, but nonpecuniary costs also declined. In the aftermath of the credit crisis, these costs have increased. In the Appendix we report results in which we include a decline in borrowing costs in the financial market liberalization. These results are mentioned in the robustness section below. Favilukis et al. (2013) provide an extensive discussion of the evidence for these changes. The period was also characterized by a secular decline in real interest rates that coincided with a surge in foreign ownership of US Treasury and agency securities. The real annual interest rate on the 10-year Treasury bond fell from 3.87 percent at the start of 2000 to 2.04 percent by the end of 2006, while the 10-year Treasury Inflation Protected (TIPS) rate fell from 4.32 percent to 2.25 percent over this period. Real rates fell further to all-time lows during the housing bust. The real 10-year Treasury bond rate declined from 2.04 percent to 20.04 percent from the end of 2006 to the end of 2012, while the TIPS rate declined from 2.25 percent to 20.76 percent. At the same time, foreign ownership of US Treasuries (T-bonds and T-notes) increased from 13.5 percent of marketable Treasuries outstanding in 1984 to 61 percent of marketable Treasuries by 2008. By June 2012, foreign holdings represented 52.5 percent of marketable Treasuries, driven by a large increase in foreign purchases between 2008 and 2012 and an even larger increase in the supply of marketable Treasuries. But foreign holdings of long-term and short-term US Treasury and agency debt as a fraction of GDP continued to increase in the 2008– 12 period, from 31 percent to 40.6 percent of GDP by 2012. By pushing real interest rates lower, the rise in foreign capital has been directly linked to the surge in mortgage originations over this period (e.g., Strongin et al. 2009). Economic policy makers, such as Federal Reserve Chairman Ben Bernanke, have also emphasized the role of foreign capital in driving interest rates lower and in fueling house price inflation (see, e.g., Bernanke 2005, 2008). It is important to emphasize that, while foreign ownership of US Treasuries surged from 2000 to 2007, there was no corresponding increase in Treasury supply over this period. The fraction of marketable Treasuries relative to GDP was stable between 1999 and 2007 at around 30 percent. We consider one specification of the model in which we introduce foreign demand for domestic bonds into the market clearing condition, referred to hereafter as foreign capital. This foreign capital is modeled as owned by governmental holders who place all of their funds in domestic riskless bonds. We do this for two reasons. First, by the end of 2008, for-
152
journal of political economy
eign official institutions (FOI) held 70 percent of all foreign holdings of US Treasuries. Moreover, as explained in Kohn (2002), government entities have specific regulatory and reserve currency motives for holding US Treasuries and face both legal and political restrictions on the type of assets that can be held, forcing them into safe securities. As of June 2010, the bond market portfolio composition of FOI consists of US Treasuries (78 percent) and agency mortgage-backed securities (MBS) and US agency debt (19.5 percent). They hold only a tiny position in risky corporate debt of any kind (2.5 percent). Second, Krishnamurthy and Vissing-Jorgensen (2007) show that demand for US Treasury securities by governmental holders is completely inelastic, implying that when these holders receive funds to invest, they buy safe US securities such as Treasuries or agencies, regardless of their price relative to other US assets. Foreign governmental holders have very deep pockets and will pay whatever price necessary to push nongovernmental holders out of the safe US bond market when their demand is not met with an equal increase in supply. US agency MBS and US agency debt are pools of conforming mortgages, guaranteed by the government-sponsored enterprises (GSEs) and the corporate bonds the GSEs issue to finance their portfolio investment (mostly in agency MBS), respectively. The safe mortgages our model features—we abstract from default risk—resemble well the agency MBS in the real world, in practice treated as equivalent to Treasuries. The equivalence of Treasury and agency securities was made formal by the conservatorship of Fannie Mae and Freddie Mac in September 2008.
IV. The Model A.
Firms
The production side of the economy consists of two sectors. One sector produces the nonhousing consumption good, and the other sector produces the housing good. We refer to the first as the “consumption sector” and the second as the “housing sector.” Time is discrete and each period corresponds to a year. In each period, a representative firm in each sector chooses labor (which it rents) and investment in capital (which it owns) to maximize the value of the firm to its owners. 1.
Consumption Sector
Denote output in the consumption sector as � �12a a ZC,t NC,t , YC,t ; KC,t
(1)
housing wealth, housing finance, and limited risk sharing
153
where ZC,t is the stochastic productivity level at time t, KC is the capital stock in the consumption sector, a is the share of capital, and NC is the quantity of labor input in the consumption sector. Let IC denote investment in the consumption sector. The firm’s capital stock KC,t accumulates over time subject to proportional, quadratic adjustment costs, J½ðIC,t =KC,t Þ 2 d�2 KC,t , modeled as a deduction from the earnings of the firm. The dividends to shareholders are equal to � �2 I DC,t 5 YC,t 2 wt NC,t 2 IC,t 2 J C,t 2 d KC,t , KC,t where wt is the wage rate (equal across sectors in equilibrium). The firm maximizes the present discounted value VC,t of a stream of earnings: bk Lt1k DC,t1k , Lt k50 ∞
VC,t 5 max Et o NC,t ,IC ,t
(2)
where bk Lt1k =Lt is a stochastic discount factor, discussed below. The evolution equation for the firm’s capital stock is KC,t11 5 ð1 2 dÞKC,t 1 IC,t , where d is the depreciation rate of the capital stock. The firm does not issue new shares and finances its capital stock entirely through retained earnings. 2.
Housing Sector
The housing firm’s problem is analogous to the problem solved by the representative firm in the consumption sector, except that housing production utilizes an additional fixed factor of production, Lt , representing a combination of land and government permits for residential construction. This is important because Glaeser, Gyourko, and Saks (2005) argue that the increasing value of land for residential development is tied to government-issued construction permits rather than to the acreage itself. Denote output in the residential housing sector as � �12f � n 12n 12n �f KH ,t ZH ,t NH ,t , YH ,t 5 ZH ,t Lt
(3)
where YH,t represents construction of new housing (residential investment), 1 2 f is the share of land/permits in housing production, and 12n n is the share of capital in the construction component ðKHn ,t ZH12n ,t NH ,t Þ of housing production. Variables denoted with an H subscript are defined exactly as above for the consumption sector but now pertain to the housing sector; for example, ZH,t denotes the stochastic productivity level in the housing sector.
154
journal of political economy
Following Davis and Heathcote (2005), we assume that a constant quantity L of new land/permits suitable for residential development is available each period. Under this specification it is the flow of land/permits that is presumed to be a fixed, constant amount each period, not the stock of these. We assume that this constant supply L of land/permits is made available for residential construction by the government that rents the land/permits to home developers at the competitive rental rate equal to the marginal product of Lt . The proceeds from land rentals are used by the government to finance (wasteful) government spending Gt. When a house is sold, the government issues a transferable lease for the land/permits in perpetuity at no charge to the homeowner. The assumption is that the buyer of the home is the effective owner, even though (by eminent domain) the government retains the legal right to the land/permits. The dividends to shareholders in the housing sector are denoted � �2 I DH ,t 5 ptH YH ,t 2 ptL Lt 2 wt NH ,t 2 IH ,t 2 J H ,t 2 d KH ,t , KH ,t where ptH is the relative price of one unit of housing in units of the nonhousing consumption good and ptL is the price of land/permits. Note that ptH is the time t price of a unit of housing of fixed quality and quantity. The housing firm maximizes bk Lt1k ðDH ,t1k Þ: Lt k50 ∞
VH ,t 5 max Et o NH ,t ,IH ,t
(4)
Capital in the housing sector evolves: KH ,t11 5 ð1 2 dÞKH ,t 1 IH ,t : Note that YH,t represents residential construction; thus the law of motion for the aggregate residential housing stock Ht is Ht11 5 ð1 2 dH ÞHt 1 YH ,t , where dH denotes the depreciation rate of the housing stock. The shocks ZC,t and ZH,t are sources of aggregate risk in the economy. The presence of aggregate risk is crucial for generating risk premia in housing and equity markets. The shocks ZC,t and ZH,t are calibrated to follow a two-state Markov chain, as described in the Appendix. In addition, with ZC,t labor augmenting and ZH,t labor and land augmenting, as written in (1) and (3), we may allow for balanced (deterministic) growth in each productivity level in an economy in which land/permits L and labor supply N are nongrowing. Under this assumption, the price of land grows de-
housing wealth, housing finance, and limited risk sharing
155
terministically at the same rate as technology and the rest of the aggregate economy.4 B. Risky Asset Returns The firms’ values VH,t and VC,t are the cum dividend values, measured before the dividend is paid out. The cum dividend returns to shareholders in the housing sector and the consumption sector are defined, respectively, as 5
VH ,t11 , VH ,t 2 DH ,t
RY ,t11 5
VC,t11 : VC,t 2 DC,t
RY
H
C
,t11
We define Vj,te 5 Vj,t 2 Dj,t for j 5 H, C to be the ex-dividend value of the firm.5 C. Individuals The economy is populated by A overlapping generations of individuals, indexed by a 5 1, … , A, with a continuum of individuals born each period. There are two types of individuals: A small minority are bequesters (those who have a bequest motive in their value functions), while the others are nonbequesters (those who do not have a bequest motive). Each will be described below. Whether one is a bequester or not, individuals live through two stages of life, a working stage and a retirement stage. Adult age begins at age 21, so a equals this effective age minus 20. Agents live for a maximum of A 5 80 (100) years. Workers live from age 21 (a 5 1) to 65 (a 5 45) and then retire. Retired workers die with an agedependent probability calibrated from life expectancy data. The probability that an agent is alive at age a 1 1 conditional on being alive at age a is denoted pa11Fa. Upon death, any remaining net worth of an individual is transferred to a newborn who replaces her. Nonbequesters leave only accidental bequests, while bequesters leave deliberate bequests. (In practice, accidental bequests are unintentional and will therefore be quite small.) We assume that newborns who receive a deliberate bequest are themselves born with a bequest motive, while those who receive only acci4 This assumption is essentially the same as the one made in Davis and Heathcote (2005), where land in their model was presumed to grow at the same rate as the population. Our model has no population growth, so the analogous assumption is that land is not growing. 5 Using the ex-dividend value of the firm, the return reduces to the more familiar exe e 5 ðVj,t11 1 Dj,t11 Þ=Vj,te . dividend definition: Rj,t11
156
journal of political economy
dental bequests have no bequest motive. Thus bequesters form dynasties, and the fraction of each type in the economy remains constant over time.6 Both bequesters and nonbequester individuals have an intraperiod utility function given by i , Ha,ti Þ 5 U ðCa,t
12ð1=jÞ ea,t C , 1 2 ð1=jÞ
i x ea,t 5 ðCa,t Þ ðHa,ti Þ12x , C
where Ca,t is nonhousing consumption of an individual of age a at time t, Ha,t is the stock of housing, j21 is the coefficient of relative risk aversion, and x is the share of nonhousing consumption in utility. Implicit in this specification is the assumption that the service flow from houses is proportional to the stock Ha,t. The only distinction between bequesters and nonbequesters is that the former receive additional utility from their net worth holdings at the time of death. This additional utility appears in the value function. Nonbequesters maximize the value function i , Wa,ti , Ha,ti Þ 5 Va ðmt , Zt , Za,t
max
i i Ha11,t11 ,via11,t11 Ba11,t11
i fU ðCa,t , Ha,ti Þ
(5)
i i i , Wa11,t11 , Ha11,t11 Þ�g: 1 bpa11ja Et ½Va11 ðmt11 , Zt11 , Za,t11
Bequesters maximize an alternative value function taking the form i , Wa,ti , Ha,ti Þ 5 Va ðmt , Zt , Za,t
max
i i Ha11,t11 ,via11,t11 Ba11,t11
i fUðCa,t , Ha,ti Þ
i i i , Wa11,t11 , Ha11,t11 Þ�g 1 bpa11ja Et ½Va11 ðmt11 , Zt11 , Za,t11 " # i H i ðWa11,t11 1 pt11 Ha11,t11 Þ12ð1=jÞ : 1 bð1 2 pa11ja ÞEt y 1 2 ð1=jÞ
(6)
Recalling that pa11Fa is the probability of being alive next year given that an individual is alive this year, equation (6) says that bequesters receive additional utility as a function of their net worth in the year in which they die. The parameter y governs the strength of the bequest motive. Financial market trade is limited to a one-period riskless bond and to risky capital, where the latter is restricted to be a mutual fund of equity in 6 Newborns make an optimal portfolio choice for how bequested wealth is allocated in the first period of life.
housing wealth, housing finance, and limited risk sharing
157
the firms in the housing and consumption sectors.7 The mutual fund is a value-weighted portfolio with return RK ,t11 5
VHe ,t e RY VHe ,t 1 VC,t
H
,t11
1
e VC,t e RY ,t11 : VHe ,t 1 VC,t C
(7)
The gross bond return is denoted Rf ,t 5 1=qt21 , where qt21 is the bond price known at time t 2 1. Individuals are heterogeneous in their labor productivity. To denote this heterogeneity, we index individuals i. Before retirement households supply labor inelastically. The stochastic process for individual income for workers is i , Ya,ti 5 wt La,t i where La,t is the individual’s labor endowment (hours times an individualspecific productivity factor), and wt is the aggregate wage per unit of productivity. Labor productivity is specified by a deterministic age-specific profile, Ga, and an individual shock Zti : i 5 Ga Zti , La,t i Þ 1 eit , logðZti Þ 5 logðZt21
eit ∼ i:i:d:ð0, j2e Þ,
where Ga is a deterministic function of age capturing a hump-shaped profile in life cycle earnings and eia,t is a stochastic independent and identically distributed shock to individual earnings. Finally, labor earnings are taxed at rate t in order to finance social security retirement income. At age a, agents enter the period with wealth invested in bonds, Bai , and shares via of risky capital. The total number of shares outstanding of the risky asset is normalized to unity. We rule out short sales in the risky asset, via,t ≥ 0:
(8)
An individual who chooses to invest in the equity fund pays a fixed, perperiod participation cost, FK,t, following evidence in Vissing-Jorgensen (2002). We assume that the housing owned by each individual requires maintenance expenses ptH Ha,ti dH , where dH is the rate of depreciation of the aggregate housing stock. At time t, households may choose to change the quantity of housing consumed at time t 1 1 by selling their current house i . Because houses are ilfor ptH Ha,ti and buying a new house for ptH Ha,t11 liquid, it is expensive to change housing consumption. An individual who chooses to change housing consumption pays a transaction cost FHi ,t . 7 Notice that this is a mutual fund that owns equity in the consumption producing firm and in the residential development firm (housing). It is not a mutual fund that owns the residential housing stock.
158
journal of political economy
These costs contain a fixed component and a variable component proportional to the value of the house. These costs encompass any expense associated with changing housing consumption regardless of how it is financed; for example, they include moving costs (both pecuniary and nonpecuniary). An additional component of the transactions cost in illiquid housing is the cost directly associated with housing finance, specifically the borrowing costs incurred for loans backed by housing collateral. We use direct evidence to calibrate a transactions cost per dollar borrowed, given by i i i 5 ljBa11,t11 j whenever Ba11,t11 < 0, which represents a borrowing posiFB,t tion in the risk-free asset. The parameter l controls the magnitude of these borrowing costs as a fraction of the amount borrowed. Denote the sum of the per-period equity participation cost, housing transaction cost, and borrowing costs for individual i as Fti ; FK ,t 1 FHi ,t 1 FB,t : Define the individual’s gross financial wealth at time t as � e � i Wa,ti ; via,t VC,t 1 VHe ,t 1 DC,t 1 DH ,t 1 Ba,t : The budget constraint for an agent of age a who is not retired is � e � i i 1 ptH dH Ha,ti 1 Ba11,t11 qt 1 via11,t11 VC,t 1 VHe ,t Ca,t � � i i 1 ptH Ha,ti 2 Ha11,t11 2 Fti , ≤ Wa,ti 1 ð1 2 tÞwt La,t
(9)
where t is a social security tax rate and ( i 0 if Ha11,t11 5 Ha,ti i FH ,t 5 i w0 1 w1 ptH Ha,ti if Ha11,t11 ≠ Ha,ti , ( 0 if via11,t11 5 0 FK ,t 5 F if via11,t11 > 0, ( i >0 0 if Ba11,t11 i FB,t 5 � i � i l � �Ba11,t11 � if Ba11,t11 < 0: The term FB is a cost that implies borrowers pay a higher interest rate than lenders receive; FHi ,t is the housing transactions cost, which contains both a fixed and a variable component and depends on age only through Ha,ti . Equation (9) says that the amount spent on nonhousing consumption, on housing maintenance, and on bond and equity purchases must be less than or equal to the sum of the individual’s gross financial wealth and after-tax labor income, less the cost of purchasing any additional housing, less all asset market transactions costs.
housing wealth, housing finance, and limited risk sharing
159
An additional important constraint in the model is i i 2Ba11,t11 ≤ ð1 2 -ÞptH Ha,t11
8 a, t:
(10)
Equation (10) is the collateral constraint, where 0 ≤ - ≤ 1. It says that households may borrow no more than a fraction 1 2 - of the value of housing, implying that they must post collateral equal to a fraction of the value of the house. This constraint can be thought of as a down payment constraint for new home purchases, but it also applies to any borrowing against home equity, not just to first-lien mortgages. It should be emphasized that 1 2 - gives the maximum combined (first and additional mortgages) LTV ratio. This will differ from the average LTV ratio because not everyone borrows up to the credit limit. Notice that if the price ptH of the house rises and nothing else changes, the individual can finance a greater level of consumption of both housing and nonhousing goods and services. Borrowing takes place using one-period debt. Thus, an individual’s borrowing capacity fluctuates period by period with the value of the house. Let Zari denote the value of the stochastic component of individual lai , during the last year of working life. Each period, rebor productivity, Za,t i 5 Zari Xt , where Xt 5 tired workers receive a government pension PEa,t W R tðN =N Þ is the pension determined by a pay-as-you-go system, and N W and N R are the numbers of working-age and retired households.8 For agents who have reached retirement age, the budget constraint is ideni is retical to that for workers (9) except that wage income ð1 2 tÞwt La,t i placed by pension income PEa,t . Let Zt ; ðZC,t , ZH ,t Þ0 denote the aggregate shocks. The state of the economy is a pair, (Z, m), where m is a measure defined over S 5 ðA � Z � W � HÞ, where A 5 f1, 2, … , Ag is the set of ages, Z is the set of all possible idiosyncratic shocks, W is the set of all possible beginning-of-period financial wealth realizations, and H is the set of all possible beginning-ofperiod housing wealth realizations. That is, m is a distribution of agents across ages, idiosyncratic shocks, and financial and housing wealth. The presence of aggregate shocks implies that m evolves stochastically over time. We specify a law of motion, G, for m, mt11 5 Gðmt , Zt , Zt11 Þ:
8 The decomposition of the population into workers and retirees is determined from life expectancy tables as follows. Let X denote the total number of people born each period. (In practice this is calibrated to be a large number in order to approximate a continuum.) Then N W 5 45 ⋅ X is the total number of workers. Next, from life expectancy tables, if the probability of dying at age a > 45 is denoted pa, then N R 5 o80 a546 ð1 2 pa ÞX is the total number of retired persons.
160
journal of political economy
D. Stochastic Discount Factor The stochastic discount factor (SDF), bLt11 =Lt , appears in the dynamic value maximization problem (2) and (4) undertaken by each representative firm. As a consequence of our incomplete markets setting, a question arises about how to model bLt11 =Lt . The intertemporal marginal rate of substitution (MRS) of any shareholder in this setting is a valid SDF. Much of the existing literature has avoided this ambiguity by assuming that firms rent capital from households on a period-by-period basis, thereby solving a series of static optimization problems. Since the problem is static, the question of discounting is then moot. In this static case, however, one needs to impose some other form of exogenous shock, for example, stochastic depreciation in the rented capital stocks (e.g., Storesletten et al. 2007; Gomes and Michaelides 2008), in order to generate nontrivial volatility of the equity return. Here we instead keep depreciation deterministic and model dynamic firms that own capital and face adjustment costs when changing their capital stocks, requiring us to take a stand on the SDF. We do this for several reasons. First, in our own experimentation we found that the amount of stochastic depreciation required to achieve reasonable levels of stock market volatility produced excessive volatility in investment. Second, it is difficult to know what amount of stochastic depreciation, if any, is reasonable. Third, an economy populated entirely of static firms is unrealistic. In the real world, firms own their own capital stocks and must think dynamically about shareholder value. For these reasons, we assume that the representative firm in each sector solves the dynamic problem presented above and discount future profits using a weighted average of the individual shareholders’ intertemporal MRS implied by the first-order condition for optimal consumption choice, where the weights, via,t , correspond to the shareholder’s proportional ownership in the firm. Let bLt11 =Lt denote this weighted average. For nonbequesters, the MRS is simply the MRS in nonhousing consumption,
i b∂U =∂Ca11,t11 i ∂U =∂Ca,t
8 !ð12xÞ½12ð1=jÞ� 9 i > > Ha11,t11 > > > > > !21=j > > > i i = < C Ca11,t11 a11,t11 5 b !ð12xÞ½12ð1=jÞ� i > > Ca,t > > Ha,ti > > > > > > i ; : Ca,t 5
i b∂Va11 ð�Þ=∂Wa11,t11 , i ∂U =∂Ca,t
i , Wa,ti , Ha,ti Þ, and the last equality above folwhere Va11 ð�Þ ; Va ðmt , Zt , Za,t lows from the envelope theorem. For bequesters, there is additional ran-
housing wealth, housing finance, and limited risk sharing
161
domness in the MRS created by the probability of death. Thus we write the bequesters’ MRS as i b∂Va11 ð�Þ=∂Wa11,t11 5 i ∂U =∂Ca,t
8 i b∂U =∂Ca11,t11 > > > with prob 5 pa11ja > ∂U =∂C i > < a,t h � �21=j i i > bEt y NWa11,t11 > > > > with prob 5 1 2 pa11ja : : i ∂U =∂Ca,t Recalling that the total number of shares in the risky portfolio is normalized to unity, we therefore model the SDF as ð i b∂Va11 ð�Þ=∂Wa11,t11 bLt11 ; via11,t11 dm, (11) i Lt ∂U =∂Ca,t S i i Þ=ð∂U =∂Ca,t Þ takes the appropriate value for each where ðb∂Va11 =∂Wa11,t11 individual, as described above. Since we weight each individual’s MRS by its proportional ownership (and since short sales in the risky asset are prohibited), only those households that have taken a positive position in the risky asset (shareholders) will receive nonzero weight in the SDF. Although this specification leads to an equilibrium that depends on the control of the firm being fixed according to the proportional ownership structure described above, it is not necessarily quantitatively sensitive to this assumption on ownership control. For example, Carceles-Poveda and Coen-Pirani (2010) show that, given the firm’s objective of value maximization, the equilibrium allocations in their incomplete markets models are invariant to the choice of SDF within the set that includes the MRS of any household (or any weighted average of these) for which the Euler equation for the risky asset return is satisfied. They show in addition that the equilibrium allocations of such economies are the same as the allocations obtained in otherwise identical economies with “static” firms that rent capital from households on a period-by-period basis. They also prove this for a case with adjustment costs. Our calibration of adjustment costs implies that they are quantitatively small, amounting to less than 1 percent of investment per year.We have checked that our results are not affected by the following variants of the SDF above: (i) equally weighting the MRS of shareholders (gives proportionally more weight to small stakeholders), (ii) weighting the MRS of shareholders by the squares of their ownership stakes, ðvia11,t11 Þ2 (gives proportionally more weight to big stakeholders), and (iii) using the MRS of the largest shareholder. This completes the description of the model economy. We now turn to the definition of housing and equity returns.
162
journal of political economy
E. Housing and Equity Returns The first-order condition for optimal housing choice takes the form
UC
i a,t
" 1 5 H bEt UC pt
i a11,t11
UH UC
!# i a11,t11
1p
H t11
ð1 2 dH Þ
(12)
i a11,t11
1 mt ð1 2 -ÞptH , where mt is the Lagrange multiplier on the financing constraint (10) and i is written UC , and analogously for UC the partial derivative ∂U =∂Ca,t and UH . Each individual’s housing return is given by ½UH =UC 1 H pt11 ð1 2 dH Þ�=ptH , where UH =UC is a measure of fundamental value, the service flow value generated by the housing asset. In a competitive is equal to the relative price of housing serequilibrium, UH =UC vices. It is tempting to use (12) to conclude that the effects of financing constraints on house prices can be cleanly separated from the effects of risk sharing and risk premia. A common assumption is that financing constraints operate through the second term on the right-hand side, while risk premia operate through the first term. In the general equilibrium of the model, however, there is no such economic separation. Indeed, the two terms on the right-hand side of (12) will in general be correlated because independent movements in financing constraints not only affect the maximum LTV ratio but also alter a household’s ability to insure against risks, which changes the first term by altering the covariance of housing returns with the intertemporal MRS UC =UC . Conversely, business cycle shocks directly influence the first term but also affect the tightness of constraints via the endogenous response of collateral values to such shocks. Thus the housing risk premium is not an exogenous variable that changes independently of financing constraints. It is an equilibrium quantity that responds to both business cycle shocks and the tightness of financing constraints, as these two driving forces alter the landscape for risk sharing and insurance. This can be seen in the results below by observing that economies with lower collateral requirements but the same level of business cycle risk exhibit less volatile consumption, more risk sharing, less precautionary saving, and lower housing and equity risk premia. In the model, ptH is the price of a unit of housing stock, which holds fixed the composition of housing (quality, square footage, etc.) over time. It is the same for everyone, so it is the model’s national house price index, akin to a repeat-sale index in the data. We define a national housing return on the index as i a,t
i a11,t11
i a11,t11
i a11,t11
i a11,t11
i a11,t11
i a11,t11
i a11,t11
i a11,t11
i a,t
i a11,t11
housing wealth, housing finance, and limited risk sharing RH ,t11 ;
p
H t11
ð1 2 dH Þ 1 MU t11 , ptH ð
MU t11 ;
S
UH
i a11,t11
UC
163 (13)
(14)
dm:
i a11,t11
H =MU t11 is the national “house price/marginal The valuation ratio pt11 utility” ratio, denoted P/MU for short. Since the model parameters satisfy a transversality condition that would effectively rule out a bubble in this nontraded asset, a standard first-order approximation (Campbell and H =MU t11 Þ ratio can fluctuate only Shiller 1989) implies that the lnðpt11 through one of three channels: (i) positively with increases in expected future MU growth, (ii) negatively with increases in expected future interest rates, or (iii) negatively with increases in the expected future housing return in excess of the interest rate, an endogenous quantity we refer to as the national housing risk premium:
� H � ∞ ∞ pt11 k 1 Et orj D ln MU t111j 2 Et orj rf ,t111j ≈ ln MU t11 12r j50 j50 |fflfflfflfflfflfflfflfflfflfflfflfflfflfflfflffl{zfflfflfflfflfflfflfflfflfflfflfflfflfflfflfflffl} |fflfflfflfflfflfflfflfflffl{zfflfflfflfflfflfflfflfflffl} Exp housing fundamentals
Exp interest rates
∞
2 Et orj ðrH ,t111j 2 rf ,t111j Þ, j50
|fflfflfflfflfflfflfflfflfflfflfflfflfflfflfflfflfflfflfflfflffl{zfflfflfflfflfflfflfflfflfflfflfflfflfflfflfflfflfflfflfflfflffl} Housing risk premium
where Et is the expectation operator conditional on time t information, k is a linearization constant, and lowercase letters refer to log variables, that is, rH ; lnðRH Þ. This implication follows only from the definition of returns and the imposition of a transversality condition that rules out bubbles. In the model explored here, 100 percent of the variability in H 2 ln MU t11 on the left-hand side is explained (to very close apln pt11 proximation) by variability in the three terms in braces on the right-hand side; thus any movement in the P/MU ratio must be attributable to one of the above channels. Note that the log housing risk premium Et ðrH ,t111j 2 rf ,t111j Þ will be highly correlated with the housing risk premium for gross returns, Et ½RH 2 Rf �, and the implications for the unconditional risk premium in stochastic steady states will be very similar regardless of whether we look at EðrH ,t111j 2 rf ,t111j Þ or E½RH 2 Rf �. For the results reported below, we compare our model implications for H =MU t11 with three different empirical measures of aggregate house pt11 price valuation ratios. These are based on three different measures of na-
164
journal of political economy
tional house prices for single-family residences, one from the Flow of Funds that measures aggregate housing wealth (FoF), one based on the Freddie Mac Conventional Mortgage House Price index (Freddie Mac), and one based on the Core Logic house price index (CL). Each of these is then combined with an aggregate housing service flow expenditure estimate to compute a measure of national home prices relative to housing fundamentals. The Appendix details our construction of these variables from data. A complicating factor is that the measures of the housing service flow are aggregates of both rent for renters and imputed rent for owner-occupiers, whereas our model applies only to the latter. But census data show that two-thirds of housing is owner-occupied, so that most of what is in these measures is an imputed service flow for owneroccupiers. Moreover, the correlation between “rent of primary residence” for renters and owner’s equivalent rent is extremely high (94 percent between 2000 and 2012), so whether we compute these ratios for renters or for owners, we get the same facts in terms of run-up, volatility, and comovements. We refer to these measures of the aggregate housing service flow in the data simply as “rent,” denoted Rt , and use it to construct empirical observations on a national house “price-rent” ratio H =Rt11 . It should be kept in mind, however, that Rt in the data is not pt11 actually a measure of aggregate rent, but rather an estimate of the housing service flow for both renters and homeowners combined. We do not attempt to match our model to the levels of the price-rent ratios, which are unidentified from the data, instead focusing on the changes in these ratios over time.9 In addition to these statistics based on national house price and housing service flow aggregates, in our model we compute housing return statistics at the individual level. These individual statistics are denoted with an N subscript. This is done in the model by taking the time-series mean and standard deviation of the individual housing return, defined as " #, UH i H 1 pt11 ð1 2 dH Þ ptH : (15) RH ,t11 ; UC i a11,t11
i a11,t11
The mean and standard deviation of the individual housing return for individual i are 9 For Freddie Mac and CL, the price-rent ratio cannot be inferred at all, since both price in the numerator and rent in the denominator are given by indexes. For FoF, we observe the stock of housing wealth and the flow of housing services from National Income and Product Accounts (NIPA), both in dollar units. But it is notoriously difficult to impute rents for owner-occupiers from the rental data of nonhomeowners, a potentially serious problem since owners represent two-thirds of the population. Because owners are, on average, wealthier than nonhomeowners, the NIPA imputed rent measure for owner-occupiers is likely to be biased down, implying that the level of the price-rent ratio is likely to be biased up.
housing wealth, housing finance, and limited risk sharing RHi ;
1 TH
TH
oR
i H ,t11
,
165 (16)
t50
sffiffiffiffiffiffiffiffiffiffiffiffiffiffiffiffiffiffiffiffiffiffiffiffiffiffiffiffiffiffiffiffiffiffiffiffiffiffiffiffiffi 1 T ðRHi ,t11 2 RHi Þ2 , Std½RHi � ; TH o t50 H
(17)
where TH is the number of years the household is alive. We then report the cross-sectional average of the mean and standard deviation of the individual housing returns, EN ½RH � ;
1 N
oE½R
1 N
oStd½R
N
i H
�
i51
and StdN ½RH � 5
N
i H
�:
i51
Finally, we construct a variable closely related to the national housing risk premium defined above, which is the aggregate individual housing risk premium, equal to the average (across households) excess housing return EN ½RH 2 Rf � ;
N
oR
i H
2 E½Rf ,t11 �:
i51
Flavin and Yamashita (2002) report summary statistics from individual housing returns from the Survey of Consumer Finance (SCF) for the period 1968–92. More recently, Landvoigt et al. (2015) obtain high-quality housing transaction data at the individual level and measure capital gains in individual returns. We can compare the model implications for EN[RH] and StdN[RH] with their findings. We do so below in the results subsection. Returning to the model, the risky capital return RK,t in (7) is the return on a value-weighted portfolio of assets. This is not the same as the return on equity, which is a levered claim on the assets. To obtain an equity return, RE,t, the return on assets, RK,t, must be adjusted for leverage: RE,t ; Rf ,t 1 ð1 1 B=E ÞðRK ,t 2 Rf ,t Þ, where B/E is the fixed debt-equity ratio and RK,t is the portfolio return for risky capital given in (7).10 Note that this calculation explicitly assumes 10 The cost of capital RK is a portfolio weighted average of the return on debt Rf and the return on equity Re: RK 5 aRf 1 ð1 2 aÞRe , where a ; B=ðB 1 EÞ.
166
journal of political economy
that corporate debt in the model is exogenous and is held in fixed proportion to the value of the firm. (There is no financing decision.) For the results reported below, we set B/E 5 2/3 to match aggregate debtequity ratios computed in Benninga and Protopapadakis (1990). As above we define the statistic SR[RE] as E½RE,t11 2 Rf ,t11 �=Std½RE ,t11 2 Rf ,t11 �. F. Equilibrium An equilibrium is defined as a set of prices (bond prices, wages, risky asset returns) given by time-invariant functions qt 5 qðmt , Zt Þ, ptH 5 p H ðmt , Zt Þ, wt 5 wðmt , Zt Þ, and RK ,t 5 RK ðmt , Zt Þ, respectively; a set of cohort-specific i , value functions and decision rules for each individual i, fVa , Ha11,t11 A i i va11,t11 Ba11,t11 ga51 ; and a law of motion for m, mt11 5 Gðmt , Zt , Zt11 Þ such that each of the following holds: 1. Households optimize. Nonbequesters maximize (5) subject to (9) and (10) if the individual is of working age and subject to (10) and the analogous versions of (9) (using pension income in place of wage income) if the individual is retired. Bequesters maximize (6) subject to (9) and (10) if the individual is of working age and subject to (10) and the analogous versions of (9) (using pension income in place of wage income) if the individual is retired. 2. Firm’s maximize value: VC,t satisfies (2) and VH,t satisfies (4). 3. The price of land/permits ptL satisfies 2f n 12n f ptL 5 ð1 2 fÞptH ZH12nf ,t Lt ðKH ,t NH ,t Þ :
4. Land/permits supply equals land/permits demand: L 5 Lt . 5. Wages wt 5 wðmt , Zt Þ satisfy 12a a 2a KC,t NC,t , wt 5 ð1 2 aÞZC,t
(18)
12f nf KH ,t NHfð,t12nÞ21 : wt 5 ð1 2 nÞfptH ZH12nf ,t Lt
(19)
6. The housing market clears: ptH 5 p H ðmt , Zt Þ is such that ð i 2 Ha,ti ð1 2 dH Þ�dm: YH ,t 5 ½Ha,t11
(20)
7. The bond market clears: qt 5 q(mt, Zt) is such that ð i Ba,t dm 1 BtF 5 0,
(21)
S
S
where BtF ≥ 0 is an exogenous supply of foreign capital discussed below.
housing wealth, housing finance, and limited risk sharing
167
8. The risky asset market clears: ð 15
S
via,t dm:
9. The labor market clears:
(22)
ð
Nt ; NC,t 1 NH ,t 5
S
i La,t dm:
(23)
10. The social security tax rate is set so that total taxes equal total retirement benefits: ð i dm, (24) tNt wt 5 PEa,t S
11. Government revenue from land/permit rentals equals total government spending, Gt: ptL Lt 5 Gt : 12. The presumed law of motion for the state space mt11 5 Gðmt , Zt , Zt11 Þ is consistent with individual behavior. Equations (18), (19), and (23) determine the NC,t and therefore determine the allocation of labor across sectors: 12a a 2a KC,t NC,t ð1 2 aÞZC,t 12f nf 5 ð1 2 nÞfptH ZH12nf KH ,t ðNt 2 NC,t Þfð12nÞ21 : ,t Lt
(25)
Also, the aggregate resource constraint for the economy must take into account the housing and risky capital market transactions/participation costs and the wasteful government spending, which reduce consumption; the adjustment costs in productive capital, which reduce firm profits; and the change in net foreign capital in the bond market, which finances domestic consumption and investment. Thus, nonhousing output equals nonhousing consumption (inclusive of costs Ft) plus government spending plus aggregate investment (gross of adjustment costs) less the net change in the value of foreign capital: YC,t
� �2 IC,t 5 Ct 1 Ft 1 Gt 1 IC,t 1 J 2 d KC,t KC,t
� �2 IH ,t F 2 d KH ,t 2 ½Bt11 q ðmt , Zt Þ 2 BtF �, 1 IH ,t 1 J KH ,t
(26)
168
journal of political economy
where Ct and Ft are aggregate quantities defined as11 ð ð i Ct ; Ca,t dm, Ft ; Fti dm: S
S
(27)
We seek a bounded-rationality equilibrium. The state space agents face is infinite-dimensional. To solve the model, it is necessary to approximate the infinite-dimensional object m with a finite-dimensional object. The Appendix explains the solution procedure and how we specify a finitedimensional vector to represent the law of motion for m. We also present the results of various numerical checks, designed to quantify the degree of departure along specific dimensions from the fully rational equilibrium. G. Model Calibration The model’s parameters and their numerical calibration are reported in table 1. A detailed explanation of this calibration is given in the Appendix. The calibration corresponds to four alternative parameterizations. Model 1 is our benchmark calibration, with “normal” collateral requirements and housing transactions costs calibrated to roughly match the data prior to the housing boom of 2000–2006. Model 1 has - 5 0:25 and borrowing costs l set to match direct estimates of the percentage of the amount borrowed lending costs in the year 2000, equal to l 5 5.5 percent of the amount borrowed. A detailed justification of this value is given in the Appendix section on changes in housing finance. Model 2 is identical to model 1 except that it has undergone a financial market liberalization with lower collateral requirements. The Appendix also provides a detailed discussion of the evidence for changes in collateral requirements. On the basis of this evidence, the down payment declines from - 5 25 percent in model 1 to - 5 1 percent in model 2. Comparisons between model 1 and model 2 therefore isolate the effects of changing collateral constraints on the housing market. In both model 1 and model 2, trade in the risk-free asset is entirely conducted between domestic residents: BtF 5 0. The model 3 calibration is identical to that of model 2 except that we add an exogenous foreign demand for the risk-free bond: BtF > 0 equal to 18 percent of average total output, Y , an amount that is approximately equal to the rise in foreign ownership of US Treasuries and agency debt over the period 2000–2008.
11 Note that (26) simply results from aggregating the budget constraints across all households, imposing all market clearing conditions, and using the definitions of dividends as equal to firm revenue minus costs.
housing wealth, housing finance, and limited risk sharing
169
TABLE 1 Calibration Parameter
Baseline, Model 1
Description
Model 2
Model 3
1%
1%
0
18% Y
Production 1. J 2. d 3. dH 4. a 5. n 6. f
Capital adjustment cost Depreciation, KC, KH Depreciation, H Capital share, YC Capital share, YH Nonland share, YH
4 12% p.a. 2.5% p.a. .36 .30 .9 Preferences
21
7. j 8. x 9. b 10. z 11. y
Risk aversion Weight on C Time discount factor Fraction of bequesters Strength of bequest
12. Ga 13. pa11Fa 14. je
Age-earnings profile Survival probability Standard deviation individual earnings
15. 16. 17. 18. 19.
Participation cost, K Fixed transactions cost, H Variable transactions cost, H Collateral constraint Borrowing cost
8 .70 .824 .10 1015.67
Demographics and Income SCF Mortality tables .125
Transactions Costs F w0 w1 l
i
≈ 1% C i ≈ 3.2% C H ≈ 5.5% pt H i 25% 5.5%
Foreign Supply F
20. B
Foreign capital
0
Note.—This table reports the parameter values of our model. The baseline, model 1, is the model with normal collateral constraints and borrowing costs; model 2 is the model with looser collateral constraints and lower borrowing costs. In particular, the down payment goes from 25 percent to 1 percent. Finally, model 3 is the same as model 2 except with a positive demand for bonds from foreigners, equal to 18 percent of GDP. The model is simulated for N 5 40,000 agents.
Finally, we consider a model 4 calibration, studied below in a simulated transition, that uses the collateral requirements and transactions costs of model 1 (- 5 25 percent and l 5 5.5 percent) but keeps the foreign flows BtF > 0 as in model 3. The share of land/permits in the housing production function is set to 10 percent, to match evidence used in Davis and Heathcote (2005), requiring f 5 0.9. The technology shocks ZC and ZH are assumed to follow two-state independent Markov chains. Their calibration, as well as that of the idiosyncratic productivity shocks, is described in the Appendix.
170
journal of political economy
V. Results This section presents some of the model’s main implications. Much of our analysis consists of a comparison of stochastic steady states across models 1, 2, and 3, where we compare the average equilibrium allocations over a very long simulated sample path. We then study a dynamic transition path for house prices and the P/MU ratio, where the shocks in this transition are designed to mimic the state of the economy and housing market conditions over the period 2000–2012. We start by presenting a set of benchmark business cycle and life cycle statistics and then turn to the house price implications of changing housing finance. A.
Benchmark Results
1.
Business Cycle Variables
Table 2 presents benchmark results for Hodrick-Prescott (1997; HP) detrended aggregate quantities. Panel A of table 2 presents business cycle moments from US annual data over the period 1953–2012. Panels B–D of table 2 present simulated data to summarize the implications for these same moments for models 1, 2, and 3. We report statistics for total output, or GDP ; YC 1 p H YH 1 CH , for nonhousing consumption (inclusive of expenditures on financial services), equal to C 1 F, for housing consumption CH,t, defined as price per unit of housing services times quantity of housing or CH ,t ; Rt Ht , for total (housing and nonhousing) consumption CT 5 C 1 F 1 CH , for nonhousing investment (inclusive of adjustment costs) I, for residential investment ptH YH ,t , and for total investment IT 5 I 1 p H YH . The recorded statistics are similar across all models, so we mainly discuss them with reference to model 1. Table 2 shows that, in both the model and the data, consumption is less volatile than GDP. The standard deviation of total aggregate consumption divided by the standard deviation of GDP is 0.76 in model 1, comparable to the 0.63 value found in the data. The level of GDP volatility in the model is very close to that in the data. Total investment is more volatile than output, both in the model and in the data, but the model produces too little relative volatility: the ratio of the standard deviation of investment to that of output is 1.64 in model 1 but is 2.95 in the data. One simple way to increase investment volatility in the model is to reduce adjustment costs for changing capital. Unfortunately, this drives equity market volatility to an unrealistically low level. This trade-off is a common problem in production-based asset pricing models (e.g., see Jermann 1998; Boldrin, Christiano, and Fisher 2001). Alternatives that could potentially circumvent this trade-off are to increase volatility of investment by adding stochastic depreciation in capital as in Storesletten et al. (2007) and Gomes and Michaelides (2008) or by adding investment-specific technology shocks.
Autocorrelation (3)
1.00 .95 .96 .93 .60 .95 .96
2.87 2.14 2.47 1.99 13.67 4.05 4.88
Y CT CH C pHYH I IT
C. Model 2 .19 .25 .28 .22 .13 .14 .13
.51 .65 .71 .63 .60 .33 .40
1.00 .69 .23 .46 .06 .24 .30
1.00 .80 .14 .66 .06 .14 .20
Share of GDP (4)
3.07 2.75 3.12 2.59 15.06 5.24 6.44
2.92 2.27 2.74 2.05 13.51 3.91 4.78
Standard Deviation (1)
1.00 .94 .96 .93 .76 .95 .97
1.00 .96 .96 .94 .63 .95 .96 D. Model 3 .21 .28 .33 .25 .13 .12 .12
.21 .29 .33 .26 .14 .09 .11
Autocorrelation (3)
B. Model 1
Corr. with GDP (2)
1.00 .69 .23 .46 .06 .24 .30
1.00 .70 .26 .44 .05 .24 .29
Share of GDP (4)
Note.—Panel A denotes business cycle statistics in annual postwar US data (1953–2012). The data combine information from NIPA tables 1.1.5, 2.1, and 2.3.5. Output (Y 5 YC 1 p H YH 1 CH ) is GDP minus net exports minus government expenditures. Total consumption (CT) is total private-sector consumption (housing and nonhousing). Housing consumption (CH 5 R � H ) is consumption of housing services. Nonhousing consumption (C ) is total private-sector consumption minus housing services. Housing investment (pHYH) is residential investment. Nonhousing investment (I ) is the sum of private-sector nonresidential structures, equipment and software, and changes in inventory. Total investment is denoted IT (residential and nonhousing). For each series in the data, we first deflate by the disposable personal income deflator. We then construct the trend with an HP filter with parameter l 5 100. Finally, we construct detrended data as the log difference between the raw data and the HP trend, multiplied by 100. The standard deviation (col. 1), correlation with GDP (col. 2), and the first-order autocorrelation (col. 3) are all based on these detrended series. The autocorrelation is a 1-year correlation in data and model. The share of GDP (col. 4) is based on the raw data. Panel B denotes the same statistics for model 1 with normal transaction costs and costs of borrowing. Panel C reports on model 2, which has looser collateral constraints than model 1 and the same borrowing costs: the down payment goes from 25 percent to 1 percent. Panel D reports on model 3, which has the same borrowing costs and collateral constraints as model 2 but has foreign capital of 18 percent of GDP.
1.00 .92 .55 .92 .77 .82 .93
3.00 1.90 1.45 2.14 13.95 9.07 8.84
A. Data (1953–2012)
Corr. with GDP (2)
Y CT CH C pHYH I IT
Quantity
Standard Deviation (1)
TABLE 2 Real Business Cycle Moments
172
journal of political economy
On the other hand, the model does a good job of matching the relative volatility of residential investment to output: in the data the ratio of these volatilities is 4.65, while it is 4.63 in model 1. Finally, in both the model and the data, residential investment is less correlated with output than consumption and total investment. 2.
Correlations of House and Stock Prices with Real Activity
Table 3 presents correlations of house and stock prices with real activity. The housing price index is procyclical, both in the data and in the model. Table 3 shows that the correlation between HP-detrended GDP and HPdetrended house prices ranges from .42 to .52 in the data depending on the sample and data source; it is .93 in our various models. In the data, the correlation between GDP and the price-rent ratio ranges from .46 to .56, while in the model the correlation between output and the P/MU ratio
TABLE 3 Correlations House Prices and Real Activity Correlations Data/Model
(Y, pH) (1)
ðY , p H =RÞ (2)
(Y, pHYH) (3)
ðp H =R, P =DÞ (4)
A. Data Data 1 (1953–2012) Data 1 (1975–2012) Data 2 (1975–2012)
.42 .52 .48
.46 .56 .44
.77 .87 .87
.28 .23 .48
B. Models Model 1 Model 2 Model 3
.93 .93 .93
.50 .73 .75
.63 .60 .76
.12 .59 .71
Note.—The table reports the correlations between house prices p H, house price-rent ratios p H =R, and residential investment p HYH with GDP Y. It also reports the correlation of house price-rent ratios with the price-dividend ratio on stocks in col. 4. Panel A is for the data. The house price and price-rent ratio are measured three different ways. In the first row (data 1), the housing price is the aggregate value of residential real estate wealth in the fourth quarter of the year (Flow of Funds). The price-rent ratio divides this housing wealth by the consumption of housing services summed over the four quarters of the year (NIPA). In data 2, the housing price is the repeat-sale Core Logic National House Price Index (series SFD). The price-rent ratio divides this price by the rental price index for shelter (BLS). It assumes a price-rent ratio in 1975:Q4, equal to the one in data 1. The price and price-rent ratio values in a given year are the fourth-quarter values. The annual price indices, GDP, and residential investment are first deflated by the disposable personal income price deflator and then expressed as log deviations from their HP trend. Panel B is for the model. Model 1 has benchmark collateral constraints and costs of borrowing. Model 2 has looser collateral constraints and the same borrowing costs as in model 1: the down payment goes from 25 percent to 1 percent. Model 3 has the same borrowing costs and collateral constraints as model 2 but has foreign capital of 18 percent of GDP.
housing wealth, housing finance, and limited risk sharing
173
ranges from .50 to .75. And the correlation between the national pricerent ratio and price-dividend ratio ranges from .23 to .48 in the data, while the model implies that the correlation between P/MU and the price-dividend ratio ranges between .12 and .71. In model 1, the full-sample correlation between P/MU and GDP is very close to the empirical correlation between the price-rent ratio and GDP. But note that the model does not imply that equity and house prices are highly correlated. If anything, the model understates the correlation between the price-rent (P/MU in the model) ratio and the price-dividend ratio on stocks. Models 2 and 3 imply higher correlations for both, but the recent boom-bust in housing markets, stock markets, and output has increased those correlations in the data as well. The correlation between residential investment and GDP in the model is quite high (60–76 percent) and not far from the data (77–87 percent; col. 3 of table 3). This is true despite the fact that the correlation between the productivity shocks ZC,t and ZH,t is zero and arises because house prices are strongly procyclical. We could (slightly) increase the correlation between the two productivity shocks to exactly match the correlation between residential investment and GDP, but this would (slightly) worsen the model’s implications for the correlation between the price-dividend and price-rent (P/MU) ratios. In each of the three models, the one-period-lagged value of residential investment and GDP have a statistically significant and positive correlation of .11, .12, and .18, respectively. Davis and Heathcote (2005) have noted that real business cycle models with housing have difficulty delivering a positive correlation between one-period-lagged residential investment and GDP. The model here produces such a positive correlation, but the magnitude is lower than that found in historical data (where this correlation is .57). In both the data and the model, correlations with residential investment at greater lags are statistically zero. In separate results not reported in the table, we note that the model also produces a strong positive correlation between land price and total investment, equal to 55 percent in model 1, 53 percent in model 2, and 59 percent in model 3, consistent with evidence in Liu, Wang, and Zha (2013) that these variables are positively correlated. Many models with housing have difficulty matching the volatility of house prices relative to that of GDP volatility. For example, Davis and Heathcote (2005) report that the ratio of standard deviations of these HP-filtered quantities is 0.52 in their model, whereas it is well above one in the data. We computed the standard deviation of our HP-filtered aggregate house price relative to HP-filtered GDP. The ratio of these standard deviations is 1.77, 1.72, and 2.11 in models 1, 2, and 3, respectively. The corresponding numbers in the data from 1953–2012 are 2.32 using the FoF measure of housing wealth. For 1975–2012 the ratio of these stan-
174
journal of political economy
dard deviations is 2.65 using the FoF index and 2.06 using the Freddie Mac index. Thus the model generates a volatile house price index relative to the volatility of economic fundamentals, consistent with the data. 3.
Life Cycle Age-Income Profiles
Turning to individual-level implications, figure 2 presents the age and income distribution of wealth, both in the model and in the historical data as given by the SCF.12 The figure shows wealth, by age, divided by average wealth across all households, for three income groups (low, medium, and high earners). In both the model and the data, financial wealth is humpshaped over the life cycle and is slightly negative or close to zero early in life when households borrow to finance home purchases. As agents age, wealth accumulates. In the data, financial (nonhousing) wealth peaks between 60 and 70 years old (depending on the income level). In the model, the peak for all three income groups is 65 years. For most individuals who are not bequesters, financial wealth is drawn down after retirement until death. Households in the model continue to hold some net worth in the final years of life to insure against the possibility of living long into old age. A similar observation holds in the data. For low and medium earners, the model gets the average amount of wealth about right, but it somewhat underpredicts the wealth of high earners early in the life cycle. Panels b, d, and f in figure 2 plot the age distribution of housing wealth. Up to age 65, the model produces about the right level of housing wealth for each income group, as compared to the data. In the data, however, housing wealth peaks around age 60 for high earners and age 67 for low and medium earners. By contrast, in the model, housing wealth remains high until death. In the absence of an explicit rental market, owning a home is the only way to generate housing consumption, an argument in the utility function. For this reason, agents in the model continue to maintain a high level of housing wealth later in life even as they draw down financial wealth. We now turn to results that focus on how key variables in the model are influenced by a financial market liberalization and foreign capital influx.
12 We average the data over 10 waves of the SCF from 1983 to 2010. Since the model has no renters, we compute all wealth statistics in the data for the subsample of homeowners. Homeowners are defined as those with strictly positive housing wealth. Housing wealth is the sum of primary housing and other property. Total wealth, or net worth, is the sum of housing wealth and net financial wealth.
F IG . 2.—Wealth by age and income in the model and data. The figure plots total wealth (“Wealth”) by age in panels a, c, and e and housing wealth (“Housing”) by age in panels b, d, and f. Panels a and b are for the data, panels c and d for model 1, and panels e and f for model 2. We use 10 waves of the SCF (1983–2010, every 3 years) and average across them.
176
journal of political economy
B. Portfolio Shares What is the effect of a financial market liberalization and foreign capital influx on the optimal portfolio decisions of individuals? Table 4 exhibits the age and income distribution of housing wealth relative to total net worth, both over time in the SCF data and in models, 1, 2, and 3. The data figures are restricted to households that are homeowners. The benchmark model captures an empirical stylized fact emphasized by FernándezVillaverde and Krueger (2011), namely, that young households hold most of their wealth in consumer durables (primarily housing) and very little in financial assets. Houses are 75 percent of the value of net worth in the data in 2001 for young individuals (35 years and under); the analogous figure in model 1 is 63 percent. The model somewhat overstates the housing wealth share of the “old” (individuals 35 year or older) and therefore of all agents. Double sorting on age and net worth, the data imply that young poor individuals and young medium-wealth individuals hold a much larger
TABLE 4 Housing Wealth Relative to Total Wealth Year/Model
All Young Old Poor Medium Rich Y/P Y/M Y/R O/P O/M O/R (1) (2) (3) (4) (5) (6) (7) (8) (9) (10) (11) (12) A. Data (SCF)
2001 2004 2007 2010
.44 .53 .53 .51
.75 1.09 1.04 1.17
.42 .50 .50 .49
1.49 1.72 1.81 2.26
.74 .84 .91 .91
.34 .42 .41 .39
3.84 4.19 5.79 7.82
1.33 1.81 1.91 2.28
.52 .77 .69 .73
1.36 1.56 1.61 2.07
.70 .79 .85 .86
.33 .40 .40 .38
2.11 2.03 .36 1.54 1.08 2.70 2.57 .38 1.65 1.13 2.47 2.58 .39 1.65 1.14
.29 .29 .29
B. Model Model 1 Model 2 Model 3
.58 .59 .61
.63 .69 .71
.56 1.63 .57 1.78 .59 1.76
1.18 1.27 1.28
.31 .31 .31
Note.—Column 1 reports average housing wealth divided by average net worth. Column 2 reports average housing wealth of the young (head of household is aged 35 or less) divided by average net worth of the young. Column 3 reports average housing wealth of the old (those above 35 years old) divided by average net worth of the old. Column 4 (5) [6] reports average housing wealth of the low (medium) [high] net worth households divided by average net worth of the low (medium) [high] net worth households. Low (medium) [high] net worth households are those in the bottom 25 percent (middle 50 percent) [top 25 percent] of the net worth distribution, relative to the cross-sectional net worth distribution at each age. Columns 7–12 report average housing wealth divided by average net worth for individuals double-sorted on age and net worth. The first letter stands for young or old, and the second letter stands for poor, medium, or rich. The data in panel A are from the SCF for 2001–10. We consider only homeowners and exclude those with negative net worth. Panel B is for the model. Model 1 has benchmark collateral constraints and costs of borrowing. Model 2 has looser collateral constraints than model 1: the down payment goes from 25 percent to 1 percent. Model 3 has the same collateral constraints as model 2 but has foreign capital of 18 percent of GDP. In the model, housing wealth is PH � H and total wealth is W 1 PH � H.
housing wealth, housing finance, and limited risk sharing
177
fraction of their wealth as housing, something the model replicates well. For example, the young medium-wealth households in the data have housing wealth that is between 1.3 and 2.3 times net worth in data from 2001–10. In the model, young medium-wealth households have housing wealth that is between 2.0 and 2.6 across the various models. By contrast, young rich households have a much smaller ratio of housing wealth to net worth, both in the model and in the data. By comparing the stochastic steady states of model 1 and model 3, we see that the model also predicts that a financial market liberalization plus an inflow of foreign capital lead households of all ages and income groups to shift the composition of their wealth toward housing. A corresponding increase occurs in the data from 2001–10 for all these groups. This occurs in the model because the combination of lower interest rates and lower collateral constraints in model 3 makes possible greater housing investment by the young, whose incomes are growing and who rely on borrowing to expand their housing consumption. Table 4, panel B, shows that the housing wealth–total wealth ratio rises by 13 percent for the young between model 1 and model 3 and by 27 percent for the young middle-wealth individuals. The rich and old rich agents in the model see virtually no increase in their housing wealth share. In the data, the increase is much smaller for these rich agents but still larger than in the model. In the working paper version of this paper (Favilukis, Ludvigson, and Van Nieuwerburgh 2010), we report additional results from a model in which housing borrowing costs also fall along with collateral constraints in a financial market liberalization. Consistent with Stokey (2009), such a decline makes housing relatively less risky as compared to equity, which causes even unconstrained individuals (primarily older, higherincome individuals) to shift the composition of their wealth toward housing. C. Asset Pricing: Return Moments Table 5 presents asset pricing implications of the model for the calibrations represented by models 1, 2, and 3. The statistics reported are averages over 1,000 periods. Analogous empirical statistics computed from historical data for short-term real interest and equity returns are also presented. We also report the percentage change in three different measures of the empirical price-rent ratio between 2000 and 2006 and compare it to the percentage change in our P/MU ratio in model 2 and model 3 relative to the baseline model 1. We could also use these empirical price-rent ratios to construct different estimates of a national housing price index return, but the results are sensitive to data used and the time frame over which the data are measured, so statistics on these measures are omitted. We first discuss the implications of the benchmark model 1 and then
8.44 8.55 11.04
18.72 16.81 16.81 16.81
Std[R E] (2)
11.44 9.45 9.58
10.83 10.44 9.23 10.04
E[R H] (3)
1.70 2.04 1.60
1.38 1.87 1.87 1.87
E[R f] (4)
3.26 3.42 4.69
2.56 2.83 2.83 2.83
Std[R f] (5)
2.81 2.58 3.50
6.88 6.85 6.85 6.85
A. Data
E½RHex � (7)
9.74 7.42 7.97
B. Model
E½REex � (6)
.37 .33 .35
.38 .42 .42 .42
SR[R E] (8)
20.1% 20.5%
31.1% 31.1% 48.9% 32.4%
Dp H =R (9)
9.33 7.55 8.10
EN[R H] (10)
7.63 5.51 6.50
EN ½RHex � (11)
9.30 7.35 8.78
StdN[R H] (12)
Note.—The table reports the mean and standard deviation of the return of the equity index, a levered claim to physical capital (cols. 1 and 2), the mean return on the housing index (col. 3), the mean and standard deviation of the risk-free rate (cols. 4 and 5), the excess returns on equity and the housing index (cols. 6 and 7), and the ratio of the average excess return on the equity index divided by the standard deviation of the return (col. 8). Column 9 reports the change in the price-rent ratio, measured as the percentage change between 2000 and 2006 in the data and the percentage change relative to model 1 in the model. Columns 10 and 11 report the average (across households) of individual housing returns and excess returns, while col. 12 denotes the average (across households) of the standard deviation of the individual housing return. Panel A reports the data. The housing price-rent ratio is measured three different ways. In the first row (data 1), the housing return is the aggregate value of residential real estate wealth in the fourth quarter of the year (Flow of Funds) plus the consumption of housing services summed over the four quarters of the year (NIPA) divided by the value of residential real estate in the fourth quarter of the preceding year. In data 2 (data 3), the house price index is the repeat-sale Core Logic National (Freddie Mac) House Price Index and the BLS rental price index for shelter. It assumes a price-rent ratio in 1975 equal to the one in data 1 in 1975. The equity index return in the data is measured as the Center for Research on Security Prices (CRSP) value-weighted stock return. We subtract realized annual CPI inflation from realized annual stock returns between 1953 and 2012 to form real annual stock returns. The risk-free rate is measured as the yield on a 1-year government bond at the start of the year minus the realized inflation rate over the course of the year. The data are from the Fama-Bliss data set and are available from 1953 until 2012. Panel B is for the model. The leverage ratio (debt divided by equity) we use in the model is 2/3: RE 5 Rf 1 ð1 1 B=EÞðRK 2 Rf Þ, where RK is the return on physical capital.
Model 1 Model 2 Model 3
4.51 4.62 5.10
8.24 8.70 8.70 8.70
Data 1 Data 1 Data 2 Data 3
(1953–2012) (1976–2012) (1976–2012) (1976–2012)
E[R E] (1)
Data/Model
TABLE 5 Return Moments
housing wealth, housing finance, and limited risk sharing
179
move on to discuss how the statistics change with a financial market liberalization and inflow of foreign money. The benchmark model roughly matches the mean of the risk-free rate, which usually is a challenge in production-based asset pricing models. The model also produces a sizable equity return of 4.5 percent per annum and thus an equity risk premium of 2.8 percent. These values are lower than the 8.3 percent per annum and 6.9 percent per annum equity premium, but the model produces an annual Sharpe ratio (defined here as the mean excess return divided by its standard deviation) of 0.37 compared to 0.38 in the data. The model’s substantial Sharpe ratio arises because house prices and therefore collateral values are procyclical, making borrowing constraints countercyclical. This implies that insurance/risksharing opportunities are reduced when households need them most— in recessions—resulting in a substantial risk premium and Sharpe ratio. A limitation of the model is that equity returns are not volatile enough (by about half). This could be addressed by increasing adjustment costs in investment, but at the cost of lower investment volatility, which is already too low. Further modifications of the model such as adding stochastic capital depreciation or an additional aggregate investment-specific shock might help address this limitation. Turning to the implications for housing assets, the average house price index return in model 1 is 11.44 percent per annum and the unconditional housing risk premium in model 1 is 9.7 percent per annum. If we look instead at the individual housing return statistics, we see that in model 1 the average (across households) individual housing return EN[RH] is 9.33 percent and housing risk premium EN ½RHex � is 7.63 percent, while the average standard deviation of the individual housing return is StdN ½RH � 5 9:30. The latter is lower still in models 2 and 3, equal to 7.35 and 8.78, respectively. These values could be compared to estimates in the data using individual housing returns. Flavin and Yamashita (2002) report an estimate of EN[RH] equal to 6.59 and an estimate of StdN[RH] equal to 14.29. More recently, Landvoigt et al. (2015) obtain high-quality data from the housing markets of San Diego and report a range of values for StdN[RH] from 8 to 13.8 percent. Thus the model overstates the average mean returns and understates the volatility of individual housing returns. These studies find an important role for idiosyncratic housing risk, which is absent from our model. The robustness section reports one attempt to address this with a specification that adds idiosyncratic depreciation risk. Financial market liberalization and the housing boom.—We now analyze how these statistics in the model are affected by a financial market liberalization. Table 5 shows that both the equity premium and the equity Sharpe ratio fall in an economy that has undergone a financial market liberalization (moving from model 1 to model 2). The lower collateral require-
180
journal of political economy
ments of model 2 reduce measures of risk in equity markets. These forces lower the housing risk premium even more. The risk premium on the house price index return falls from 9.74 in model 1 to 7.41 in model 2, while the average individual housing risk premium falls from 7.63 to 5.51. Table 5 also reports the percentage difference in the P/MU ratio between models 2 and 3 relative to model 1 (panel B). In the model, the average national P/MU ratio ptH =MU t is 20.1 percent higher in model 2 (relaxed constraints) than it is in the benchmark model 1 (tighter constraints). This difference isolates the effect of a financial market liberalization, since it compares stochastic steady states only; thus all effects from cyclical dynamics are averaged out. (Below we study a dynamic transition that includes cyclical shocks.) By comparison, observed price-rent ratios on housing indexes in the data rose by 31 percent, 32 percent, or 49 percent from 2000 to 2006, depending on the measure. At the same time, table 5 also shows that a financial market liberalization leads to an increase in the equilibrium real interest rate. The endogenous riskfree interest rate is 2.04 percent per annum in model 2, whereas it is 1.70 percent in model 1. This occurs because the relaxation of borrowing constraints reduces precautionary savings, as households endogenously respond to the improved risk-sharing/insurance opportunities. And note that, because we are comparing stochastic steady states, there is no difference in expected MU growth between models 1, 2, and 3 in this table. (They each equal the steady-state growth of technology.) This demonstrates that the housing boom caused by a financial market liberalization is entirely attributable in the model to the decline in the housing risk premium, which is large enough to more than offset the rise in equilibrium interest rates and drive the P/MU ratio up. The role of foreign capital in the housing boom.—Model 3 adds to model 2 an inflow of foreign capital calibrated to match the increase in foreign ownership of US Treasuries and US agency debt over the period 2000–2006. Table 5 shows that such an increase has a large downward impact on the equilibrium interest rate, which falls from 2.04 percent in model 2 to 1.60 percent in model 3. Column 12 of table 5 shows that the average price-rent ratio is 20.5 percent higher in the stochastic steady state of model 3 than it is in the benchmark model 1. This increase is half a percentage point higher than the increase from model 1 to model 2, which omits the large capital inflow. Thus, the rise in the price-rent ratio over the benchmark model 1 comes not from the foreign capital–driven lower interest rates, but rather from the financial market liberalization. The reason foreign flows have such a small influence on the P/MU ratio has to do with the endogenous response of the housing (and equity) risk premium to an increase in foreign demand for the safe asset. Foreign purchases reduce the effective supply of the safe asset to domestic households and make investing in both equity and housing assets more risky. Domestic sav-
housing wealth, housing finance, and limited risk sharing
181
ers are crowded out of the bond market by foreign governmental holders that are willing to hold the safe asset at any price, forcing domestic residents as a whole to take a leveraged position in risky assets. For this reason, both housing and equity risk premia rise from model 2 to model 3. The housing risk premium rises from 7.41 percent to 7.98 percent and the equity risk premium rises from 2.58 percent to 3.50 percent. Thus the risk premium in model 3 reflects two offsetting forces. On the one hand, a financial market liberalization improves insurance opportunities for many constrained households, and this lowers risk premia. One the other hand, foreign purchases of the safe asset force domestic savers to be more exposed to systematic risk in equity and housing markets, and this increases risk premia. For housing, the first effect is dominant, and the housing risk premium is still lower in model 3 than in the baseline model 1. Still, the rise from model 2 to model 3 means that the endogenous response of risk premia to foreign purchases of US government bonds substantially limits the extent to which foreign capital inflows into the bond market can influence home prices. These findings underscore the importance of general equilibrium effects on risk premia for understanding the scope for low interest rates to cause a housing boom. In partial equilibrium models of the housing market (e.g., Titman 1982) or in small open-economy models without aggregate risk (e.g., Kiyotaki et al. 2011; Sommer et al. 2013), the risk premium is tiny or is held exogenously fixed. As a consequence, a decline in the interest rate equal in magnitude to that generated by the large influx of foreign money considered here would be sufficient—by itself—to explain most of the rise in price-rent ratios observed from 2000 to 2006. In general equilibrium this is not possible because a foreign capital inflow has an endogenous effect on the housing risk premium, substantially offsetting the effect of lower interest rates on home prices. D. Transition Dynamics: Housing Boom to Bust The steady-state comparisons of the previous section show long-run changes only and do not account for business cycle fluctuations. In this section we study a dynamic transition path for house prices, land prices, and the P/MU ratio in response to a series of shocks designed to mimic both the state of the economy and housing market conditions over the period 2000–2012, as follows. At time 0 (taken to be the year 2000), the economy begins in the stochastic steady state of model 1. In 2001, the economy undergoes an unanticipated shift to model 3 (financial market liberalization and foreign holdings of US bonds equal to 18 percent of GDP), at which time the policy functions and beliefs of model 3 are applied. Along the transition path, foreign holdings of bonds are increased linearly from 0 percent to 18 percent of GDP from 2000 to 2006 and held
182
journal of political economy
constant at 18 percent from 2006 to 2012. The adjustment to the new stochastic steady state of model 3 is then traced out over the 7-year period from 2001 to 2006, as the state variables evolve. Starting in 2007 and continuing through 2012, the economy is presumed to undergo a surprise reversal of the financial market liberalization but not the foreign capital inflow, at which time it unexpectedly shifts to a new state in which all the parameters of model 1 again apply except those governing the foreign capital inflow, which remains equal to 18 percent of GDP annually, as in model 3. This hybrid of models 1 and 3 is referred to as model 4. In addition, we feed in a specific sequence of aggregate shocks designed to mimic the business cycle over this period. The aggregate technology shock processes ZC and ZH follow Markov chains, with two possible values for each shock, “low” and “high” (see the Appendix). Denote these possibilities with the subscripts l and h: ZC 5 fZCl , ZCh g,
ZH 5 fZHl , ZHh g:
As the general economy began to decline in 2000, construction relative to GDP in US data continued to expand and did so in every quarter until the end of 2005. Thus, the recession of 2001 was a nonhousing recession. Starting in 2006, construction relative to GDP fell and has done so in every quarter through 2009. Thus, in contrast to the 2001 recession, housing led the recession of 2007–9. To capture these cyclical dynamics, we feed in the following sequence of shocks for the period 2000–2009: fZCl , ZHh gt52000 , fZCl , ZHh gt52001 , fZCh , ZHh gt52002 , fZCh , ZHh gt52003 , fZCh , ZHh gt52004 , fZCh , ZHh gt52005 , fZCh , ZHl gt52006 , fZCl , ZHl gt52007 , fZCl , ZHl gt52008 , fZCl , ZHl gt52009 . Although the transition is designed to focus on the boom from 2000 to 2006 and recession-associated bust from 2007 to 2009, we extend the graph out to 2012 by assuming that the economy remains in the low state in both sectors in 2010 and transitions back to the high state in both sectors in 2011 and 2012. This appears reasonable given that the end of the recession was in 2009 but the economy, and especially the housing market, continued to be weak throughout 2010. Since 2011, the broader economy and the housing markets have started to recover.13 Panel a of figure 3 shows the transition dynamics of the P/MU ratio. In the transition, the P/MU ratio rises by 27.5 percent over the period 2000–2006, boosted by economic growth and lower financing constraints. 13 We abstract from one aspect of the economic environment that changed after 2009, namely, that there was an increase in the supply of Treasury debt as a fraction of marketable Treasuries outstanding that occurred as part of the American Recovery and Reinvestment Act of 2009. But while this leads outstanding debt/GDP to rise from 2009 to 2012, so did foreign holdings. In fact, the latter rise by even more over this period (the fraction of foreign holdings/GDP rises from 30 percent to 40 percent). The transition simply assumes a constant flow of foreign funds as a fraction of GDP after 2009, but we are slightly understating the effect of these flows for those last 3 years. As explained above, these flows have little impact on the transition dynamics of home prices.
F IG . 3.—Transition dynamics in the model: price-rent ratio, house price, and land price. Panel a plots the the P/MU ratio p H =MU for a transition generated from the baseline model. Panel b plots the house price p H, plotted against the left axis (solid line), and the price of land pL, plotted against the right axis (dashed line) from the same transition exercise. Panel c plots the baseline P/MU ratio dynamics (solid thick line) alongside the P/MU dynamics under several counterfactual scenarios. Panel d plots the baseline price-rent ratio dynamics (solid thick line) as well as the P/MU dynamics in two different models that undergo the same structural changes as the baseline model (FML, flows, FML reversal).
184
journal of political economy
There is a small initial dip in the first period, so the trough-to-peak increase along the transition path is larger from 2001 to 2006, equal to 32.1 percent. Interest rates, while lower, contribute little to the increase, as explained above. Comparing the 32 percent rise in the P/MU ratio over this transition with the 20.5 percent rise between the stochastic steady states of model 1 and model 3, we see how the presence of business cycle risk amplifies the response of the P/MU ratio to shocks. We discuss this further below when we redo the analysis shutting off all business cycle risk. In the economic contraction over the period 2007–10, the model generates a decline of 17.8 percent in the P/MU ratio, driven by the negative business cycle shocks and by a presumed reversal of the financial market liberalization. Panel b of figure 3 shows that house prices themselves (left scale) rise 20.0 percent from 2000 to 2006 and 21.4 percent from 2001 to 2006. The increase in ptH =MU t from 2000 to 2006 is larger than the increase in ptH because, in the model, MU t growth decreases modestly over this period as the expected housing stock expands with the endogenous increase in residential investment. In the economic contraction over the period 2007–10, the model generates a decline of 14.9 percent in home prices ptH . The price of land/permits ptL , plotted against the right axis, rises and falls over the transition with the price of housing. The expansion not only drives a construction and housing boom but also raises the price of this fixed factor of housing production by 10.4 percent from 2000 to 2005. Land/permits prices subsequently fall from 2006 to 2010 by 34.7 percent, as the economy contracts and collateral constraints revert to previously higher levels. Panels c and d of figure 3 consider several alternative transitions that correspond to special cases of the model and transition shocks in which particular features are shut down. The results for the special cases are based on a full resolving of the model in which some particular feature of our full model is shut down. First consider panel c. The line marked “No FML reversal, no flows” is a hypothetical transition in which there is a financial market liberalization (FML) starting in 2001 but no foreign flows into the safe bond market at any time and no reversal of the FML in 2007 (credit constraints remain lax after 2007 as in model 3). This can be compared with our baseline transition, the line marked “FML reversal, flows” (identical to the full model transition reported in panel a). We can see that this case generates almost all of the run-up in the price-rent ratio generated by the baseline transition but captures very little of the bust. This reinforces the point that, despite its depressing influence on interest rates, the vast influx of foreign funds into safe assets has little effect on home values in the general equilibrium of the model. It also shows that a reversal of the FML is crucial for generating a housing bust: negative productivity shocks alone
housing wealth, housing finance, and limited risk sharing
185
are not enough. The line marked “No FML reversal, flows” shows a transition without an FML reversal but adds the constant capital flows that are part of the benchmark transition. This line by definition is identical to the baseline transition until 2007 and then looks much like the counterfactual without an FML reversal and without foreign flows after 2007. As just noted, this is to be expected because the flows have little effect on the P/MU ratio. The line marked “Business cycle only” is a transition produced by assuming that the only sources of fluctuation in the economy are the changes in the productivity shocks described above (all idiosyncratic shocks are set to zero and there are no changes in financing constraints or foreign flows). Under this scenario there is no FML, no reversal of the FML, and no foreign flows (the economy stays in model 1). It is clear that this line generates a much smaller boom in the P/MU ratio and a much smaller bust. This reinforces the conclusion that business cycle variation alone—even in a model with incomplete markets and idiosyncratic risk—is not enough to generate sizable fluctuations in the P/MU ratio. However, such shocks interact in important ways with idiosyncratic risk and changes in financing constraints, which is evident from panel d of figure 3. In panel d we compare our baseline transition to one that would occur in a model without aggregate productivity shocks, labeled “No business cycle.” Specifically, we resolve all of our models (1, 2, 3, and 4) but without aggregate business cycle risk (i.e., ZC 5 ZH 5 1) and then simulate a transition. This economy still undergoes an FML in 2001, receives foreign inflows from 2001 to 2012, and experiences a reversal of the FML in 2007. This experiment is identical to that in our benchmark model except that the aggregate productivity shocks are turned off. The dotted line shows that this model experiences a boom and a bust that are similar to but much smaller than in the baseline model. Even without business cycle shocks, the unanticipated change in financing constraints is itself an aggregate economic shock that affects risk premia and the P/MU ratio. But the maximum trough-to-peak increase in the P/MU ratio in this case is 22.2 percent compared to 32 percent in the baseline model with business cycle risk. Moreover, over much of the transition, the increase in the P/ MU ratio is substantially lower in the model without business cycle shocks than in the full model. This shows that the presence of business cycle risk amplifies the impact of changing financing constraints on the housing market. The last line in panel d of figure 3 is labeled “No business cycle, no bequests.” It is identical to the economy with no productivity shocks except that there is only one type of household rather than having bequesters and nonbequesters. These households have no bequest motive, and their rate of time preference is recalibrated to match the average interest rate level to that in the baseline model. This model features only a small
186
journal of political economy
8.5 percent increase in the P/MU ratio and virtually no bust, despite experiencing the same FML, foreign flows, and subsequent FML reversal. This shows that bequest heterogeneity is crucial in the model for obtaining a large housing boom from a reduction in financing constraints. But this economy without bequest heterogeneity has only half the level of wealth inequality of the baseline model or the model with no business cycle risk but two types of agents (wealth Gini of .38 vs. .76). In the absence of enough poor agents who are constrained or close to their borrowing constraint, an FML will have only small effects. These findings are consistent with those of Kiyotaki et al. (2011) and Sommer et al. (2013) , who find small effects from a relaxation of credit constraints in a model without aggregate productivity shocks and without enough wealth inequality. Note that, in the model here, a relaxation generates an endogenous increase in residential investment that results in a decline in expected MU growth. Moreover, without an influx of foreign capital, relaxed financing constraints would lead to an endogenous increase in interest rates as precautionary saving declines. Without movements in risk premia, both of these equilibrium effects would cause a decline in the P/MU ratio. At the same time, the influx in foreign capital drives down interest rates but has very little effect on home prices. These results show that generating a house price boom from a decline in collateral requirements is in many ways more challenging in general equilibrium models than it is in partial equilibrium models in which interest rates and housing supply are held fixed. They also underscore the central role of risk premia for explaining house price volatility. E. Cyclical Dynamics of Housing and Equity In this section we ask to what extent cyclical changes in the P/MU ratio in the model reflect changing expectations of future MU growth, changing expectations of future home price appreciation (housing returns), or both. As mentioned, in the model, 100 percent of the variability in the log P/MU ratio is attributable to variation in the expected present discounted value of future MU growth rates. This variability itself can be divided into two parts: that attributable to variation in expected future MU growth and that attributable to variation in expected future housing returns (discount rates). We look within model 1 at the relation between purely cyclical changes (driven only by business cycle shocks) in P/MU ratios and subsequent movements in housing return and MU growth. The left panels of table 6 show regression results (coefficient, t-statistic, and R 2) from both the model and the data for predicting long-horizon future housing returns and long-horizon future MU growth (model) or “rent” growth (data) using today’s P/MU ratio (model) or today’s pricerent ratio (data).
housing wealth, housing finance, and limited risk sharing
187
TABLE 6 Predictability A. Raw Returns and Dividends/Rents k
kr
t-Statistic R 2
kd
t-Statistic R 2
kr
t-Statistic R 2
Housing: Model 1 1 2 3 5
2.67 2.48 2.37 2.25
220.1 223.8 225.5 229.7
22.6 34.5 43.6 54.9
2.26 2.21 2.16 2.10
Equity: Model 1
215.9 219.1 219.1 218.1
12.7 21.8 26.6 28.5
2.10 2.06 2.05 2.03
214.6 215.5 216.6 216.8
Housing: Data 1 2 3 5
2.04 2.11 2.16 2.20
2.6 23.0 25.6 25.9
1.1 .00 11.0 2.00 27.2 .00 55.2 2.01
t-Statistic R 2
kd
12.9 16.9 20.2 21.7
.56 .35 .26 .15
27.5 29.2 31.7 32.5
36.3 44.7 47.6 47.7
2.5 2.1 .3 1.3
.2 .0 .1 2.3
Equity: Data .3 2.2 .0 2.4
.1 .0 .0 .7
2.10 2.09 2.08 2.07
22.4 22.4 23.5 25.4
5.2 2.02 8.8 2.00 12.4 .01 16.6 .02
B. Excess Returns Housing: Model 1 k
kr,e
1 2 3 5
2.44 2.14 2.10 2.08
t-Statistic R 2 210.7 26.4 25.7 26.1
9.6 4.2 4.1 5.9
Housing: Data kr,e 2.02 2.10 2.17 2.21
t-Statistic R 2 2.2 21.4 24.4 210.1
.2 6.5 19.9 44.1
Equity: Model 1 kr,e 2.14 2.05 2.03 2.02
t-Statistic R 2 218.2 212.6 29.1 25.8
21.9 11.3 6.8 3.8
Equity: Data kr,e 2.10 2.09 2.07 2.06
t-Statistic R 2 22.3 22.1 22.8 23.8
5.2 8.4 11.6 14.2
Note.—Panel A reports the coefficients, t-statistics, and R 2 of real return and real dividend i 5 growth predictability regressions. The return regression specification is ð1=kÞokj51 rt1j r i i a 1 k pdt 1 εt1k , where k is the horizon in years, r is the log housing return (left panel) or log stock return (right panel), and pdti is the log price-rent ratio (left panel) or pricedividend ratio on equity (right panel). The dividend growth predictability specification i 5 a 1 kd pdti 1 εt1k , where Dd i is the log rental growth rate (left is similar: ð1=kÞokj51 Ddt1j panel) or log dividend growth rate on equity (right panel). Panel B reports the coefficients, t-statistics, and R 2 of excess return predictability regressions. The return regression specifii,e 5 a 1 kr ,e pdti 1 εt1k , where k is the horizon in years, ri,e is the log real cation is ð1=kÞokj51 rt1j housing return in excess of a real short-term bond yield (left panel) or the log real stock return in excess of a real short-term bond yield (right panel), and pdti is the log price-rent ratio (left panel) or price-dividend ratio on equity (right panel). In the model, we use the return on physical capital for the real return on equity and the return on the 1-year bond as the real bond yield. The model objects are obtained from a 1,750-year simulation, where the first 250 periods are discarded as burn-in. The model is the benchmark model 1. The housing return is the aggregate housing return defined in the text. In the data, we use the CRSP value-weighted stock return, annual data for 1953–2012. The housing return in the data is based on the annual Flow of Funds data for 1953–2012 (data 1). We subtract CPI inflation to obtain the real returns and real dividend or rental growth rates. The real bond yield is the 1-year Fama-Bliss yield in excess of CPI inflation.
As table 6 shows, when home prices are high relative to fundamental value, this forecasts a decline in future home prices, not quicker growth in housing fundamentals. This is true in both the model and the data (see also Campbell et al. 2009; Cochrane 2011). In the model, this occurs in part because high P/MU ratios in an expansion forecast lower future ex-
188
journal of political economy
cess returns to housing assets, driven by a lower housing risk premium. The housing risk premium falls as the economy grows because the endogenous increase in house prices raises collateral values and relaxes borrowing restrictions, affording households more insurance against remaining income risk. The data results are even stronger in this regard at long horizons, suggesting that an even larger fraction of the variability in pricerent ratios is attributable to changing risk premia. Thus the model underpredicts the degree of variation in housing risk premia at long horizons (and overpredicts at short horizons). One note on this is that the results reported in table 6 for the model include only business cycle shocks. We expect from the findings reported above that shocks to financing constraints themselves have large effects on housing risk premia. Since the historical data include these shocks but the model does not, a better comparison with the data would introduce financing shocks into the modelbased sample, in addition to business cycle shocks. Table 6 also shows that a high P/MU ratio forecasts lower future MU growth in the model, though not as strongly as they forecast lower future returns to housing. It is often suggested that increases in price-rent ratios reflect an expected increase in rental growth. For example, in a partial equilibrium setting in which discount rates are constant, higher house prices relative to fundamentals can be generated only by higher implicit rental growth rates in the future (Sinai and Souleles 2005; Campbell and Cocco 2007). The partial equilibrium setting, however, ignores the endogenous response of both discount rates and residential investment to economic growth. In general equilibrium, positive economic shocks can simultaneously drive discount rates down and residential investment up, leading high P/MU ratios to reflect an expected decline in rental growth. As the housing supply expands, the cost of future housing services (rent) is forecast to be lower. It follows that high price-rent ratios in expansions must entirely reflect expectations of future home price depreciation (lower future returns). Although future MU growth is expected to be lower, the P/MU ratio still rises in response to positive economic shocks because the expected decline in future housing returns more than offsets the expected fall in future rental growth.14 For completeness, table 6 also reports predictability results for equity returns. In model-generated data, both the raw equity return and the excess return are forecastable by the price-dividend ratio over long horizons, consistent with evidence from US stock market returns (e.g., see the empirical literature reviews on this evidence in Cochrane [2005, chap. 20], Lettau and Van Nieuwerburgh [2008], and Lettau and Ludvigson [2010]). High price-dividend ratios forecast low future equity re14 Predictable variation in housing returns must therefore account for more than 100 percent of the variability in price-rent ratios.
housing wealth, housing finance, and limited risk sharing
189
turns and low excess returns (low equity risk premia) over horizons ranging from 1 to 30 years. But compared to the data, the model produces too much forecastability of dividend growth, too little predictability in excess returns at long horizons, but too much at short horizons. Dividend growth is highly predictable in the model because, in contrast to an endowment/exchange economy in which dividends can be set exogenously, here both profits and the value of the firm respond endogenously to aggregate shocks. For this same reason, the model also produces too much predictability in raw returns driven by too much predictability in interest rates. Positive economic shocks increase consumption but not as much as income; thus saving and the capital stock rise, pushing down expected rates of return to saving and interest rates. F. Risk Sharing and Inequality We now evaluate the model’s implications for direct risk-sharing measures and inequality. Table 7 presents four types of measures of inequality
TABLE 7 Inequality A. Data Year
Gini Wealth
Gini Housing
Gini Financial Wealth
2001 2004 2007 2010
74.1 74.1 74.3 77.8
55.6 57.1 55.8 56.5
102.4 119.9 124.0 129.1
Cross-Sectional SD IMRS
Cross-Sectional SD Consumption Share
Gini Consumption
88.3 87.0 85.8
76.3 76.0 75.8
38.2 37.9 37.7
Gini Wealth
Gini Housing
Gini Financial Wealth
76.1 77.1 76.2
46.1 43.6 42.7
124.7 132.5 137.2
B. Model Model Model 1 Model 2 Model 3 Model Model 1 Model 2 Model 3
Note.—This table reports various measures of cross-sectional risk sharing: the crosssectional standard deviation of the intertemporal marginal rate of substitution (IMRS), the cross-sectional standard deviation of the consumption share CTi ,a,t =CT ,t , and the Gini coefficients of consumption, total wealth, housing wealth, and financial wealth. We simulate the model for N 5 2,400 households and for T 5 1,150 periods (the first 150 years are burn-in and are discarded). The data are from the SCF for the sample of homeowners (positive housing wealth). All numbers are multiplied by 100.
190
journal of political economy
or risk sharing: (i) the Gini coefficient for net worth, housing wealth, and financial wealth; (ii) the cross-sectional standard deviation in the individual consumption share in aggregate consumption; (iii) the Gini coefficient of individual consumption; and (iv) the cross-sectional standard deviation of the individual intertemporal marginal rates of substitution (IMRS), i b∂U =∂Ca11,t11 : i ∂U =∂Ca,t
The first of these are measures of inequality in wealth; the next two are measures of inequality in the numeraire consumption good. The last is a measure of risk sharing. Under perfect risk sharing (complete markets), individuals equate their MRS state by state. Thus, the cross-sectional standard deviation of the MRS is a quantitative measure of market incompleteness, with higher values indicating less risk sharing. Table 7 shows that the model essentially matches overall wealth inequality. For example, the Gini coefficient for total wealth (net worth) in the data is 74.0 in 2001 (Gini multiplied by 100) while it is 76.1 in model 1. The Gini of financial wealth in model 1 is 124.7, close to the average of 2004–10 values but higher than the 2001 value.15 The model understates inequality in housing (Gini equal to 46.1 in model 1 vs. 55.6 in 2001 data). But, like the data, the model generates large inequality in financial wealth and much smaller degrees of inequality in housing wealth. In the data, financial wealth inequality rises sharply from 2001 to 2010. During the housing boom of 2001–7, the Gini of financial wealth increases by 20 percent. Interpreting this period as a transition from model 1 to model 3, the model generates a 10 percent rise in inequality, or half of the observed amount. Table 7 shows that the decline in risk premia from model 1 to model 2 (documented in table 5) coincides with an increase in risk sharing (lower cross-sectional standard deviation of the IMRS) and a decline in consumption and housing wealth inequality. Risk sharing improves because a financial liberalization increases access to credit, which allows heterogeneous households to insure more of their risks. When a nontrivial fraction of households operate close to their collateral constraints, any economywide fluctuation that alters these constraints is itself an important source of aggregate risk. This can be evident in these results by observing that model 2 is an economy with lower collateral requirements than model 1 but the same level of business cycle risk. Yet it exhibits less
15 Note that the Gini index can exceed one when there are negative values for financial wealth (negative net worth for people with debt).
housing wealth, housing finance, and limited risk sharing
191
volatile consumption, more risk sharing, less precautionary saving, and lower housing and equity risk premia. On the other hand, these same measures of risk sharing and consumption inequality fall further from model 2 to model 3, a comparison that isolates the influence of the foreign capital inflow, despite the fact that housing and equity risk premia rise from model 2 to model 3 (table 5). To understand this result, it must be kept in mind that not everyone is constrained, and there are at least two factors that affect financial market risk premia. In particular, there is a trade-off: foreign flows make borrowing less costly for constrained households and improve their ability to insure against risks, but wealthier savers are forced into a leveraged position in risky asset markets and exposed to more systematic risk. (Additional results not reported in the table show that the cross-sectional standard deviation of the MRS of shareholders rises from model 2 to model 3, even though it declines slightly for the entire population.) Thus, the crosssectional standard deviation of MRS across all individuals reflects a trade-off between these two groups and can therefore go up or down, depending on which group’s experience dominates. Moreover, there are also offsetting effects on housing and equity risk premia. The improved insurance opportunities of constrained households push financial market risk premia down, while the greater exposure of wealthy savers to systematic risk pushes these premia up. Here too the overall effect depends on which effect dominates. In the equilibrium reported here, the second effect dominates the first so that financial market risk premia rise from model 2 to model 3 even though measures of risk sharing across all households actually improve. Turning to financial wealth inequality, we find that a financial market liberalization and foreign demand for the risk-free asset have reinforcing effects on financial wealth inequality: financial wealth inequality increases from model 1 to model 2 and again from model 2 to model 3. Financial wealth inequality rises by 7.7 points from a relaxation of credit constraints. Foreign inflows add another 4.7 points, or just over one-third of the overall effect. Why does a financial market liberalization have an upward effect on financial wealth inequality while reducing consumption and housing inequality? A financial market liberalization relaxes financial frictions, making it easier to borrow against home equity. This improves risk sharing and reduces consumption inequality and housing inequality. But financial wealth inequality rises because domestic borrowers take advantage of lower collateral requirements to increase current consumption, leading to a deterioration of their net worth position. This explains why financial wealth inequality rises from model 1 to model 3. But it further rises from model 2 to model 3 because domestic savers as a whole are forced to shift the composition of their wealth toward risky securities as a
192
journal of political economy
result of the foreign capital inflow. With more risky securities in their portfolio, they earn a higher return on their savings, driving their net worth more positive at the same time that constrained households are taking advantage of lower interest rates and driving their net worth more negative. This explains why financial wealth inequality rises further from model 2 to model 3. These model predictions are consistent with changes in the data from 2001 to 2010 presented in table 7 and with evidence that financial wealth inequality has risen more than consumption inequality in recent decades.16 G. Robustness This section discusses robustness of our results to different assumptions for the model calibration. Tables 8 and 9 present the model’s implications for the same statistics reported in table 2 (business cycle statistics) and table 5 (asset pricing moments) for a number of different calibrations of the model. For ease of comparison, the first panel of each table reproduces our benchmark results. Panel A of table 8 reproduces the results from model 1 reported in table 2. Panel A of table 9 reproduces the results from models 1 and 3 that are reported in table 5. Higher land share.—We studied a model with a higher land share of production, equal to 25 percent instead of 10 percent. Overall the results are similar to those in the benchmark model, with business cycle statistics almost identical (table 8). One difference is the lower residential investment volatility, due to the lower implied housing supply elasticity. Another interesting difference shown in table 9 is that the housing risk premium falls by less, percentage-wise, when moving from model 1 to model 3 than it does in the benchmark case with land share equal to 10 percent. For this reason the P/MU ratio rises by less from model 1 to model 3 (17.4 percent rather than 20.5 percent). Although a higher land share makes housing returns more volatile, the greater inelasticity of housing also makes these returns less correlated with individuals’ housing-consumption expenditure shares and therefore their marginal rates of substitution. The result is a smaller decline in risk premia and a lesser increase in P/MU from model 1 to model 3. Idiosyncratic house price depreciation risk.—We solved a case of our model with idiosyncratic housing depreciation shocks in order to assess the potential impact of idiosyncratic house price risk. Idiosyncratic housing risk could help the model better match evidence for a large idiosyncratic 16 Krueger and Perri (2006) and Heathcote, Perri, and Violante (2010) study income and consumption inequality directly and show that consumption inequality has risen less than income inequality. Their results for saving and income inequality suggest that wealth inequality has risen more than consumption inequality over time.
2.90 2.27 2.67 2.07 13.16 3.85 4.71
Y CT CH C pHYH I IT
Autocorrelation
.21 .29 .33 .26 .14 .09 .11
1.00 .96 .96 .95 .64 .95 .96
.21 .28 .33 .25 .14 .10 .13
C. Model with Depreciation Shocks
1.00 .96 .96 .94 .63 .95 .96
A. Benchmark Model
Corr. with GDP
1.00 .70 .26 .44 .05 .24 .29
1.00 .70 .26 .44 .05 .24 .29
Share of GDP
2.83 1.80 2.23 1.60 14.08 4.44 5.35
2.92 2.18 2.70 1.93 11.85 4.16 4.77
Autocorrelation
1.00 .96 .96 .94 .67 .94 .97
.21 .30 .35 .27 .14 .10 .10
B. Model with Higher Land Share
Corr. with GDP
1.00 .94 .95 .92 .71 .94 .97
.20 .31 .35 .27 .13 .13 .12
1.00 .68 .24 .44 .06 .26 .31
1.00 .69 .25 .44 .05 .24 .30
Share of GDP
D. Model with Idiosyncratic Unemployment Risk
Standard Deviation
Note.—The table reports the same moments as table 2. All panels use model 1. Panel A repeats the benchmark results. Panel B considers an alternative economy with a higher land share of 25 percent instead of 10 percent. Panel C contains results for a model in which housing depreciation contains an additive idiosyncratic component that is 0 percent or 5 percent with equal probability. Panel D contains results for a model with idiosyncratic unemployment risk: the income state is 1.01895 percent with 95 percent probability and 0.74 percent with 5 percent probability.
2.92 2.27 2.74 2.05 13.51 3.91 4.78
Standard Deviation
Y CT CH C pHYH I IT
Quantity
TABLE 8 Robustness: Real Business Cycle Moments
4.51 5.10
4.28 4.47
4.44 5.01
4.05 5.59
Model 1 Model 3
Model 1 Model 3
Model 1 Model 3
Model 1 Model 3
9.26 11.76
8.25 10.93
8.88 10.18
8.44 11.04
Std[RE] (2)
10.43 9.66
11.57 9.73
11.63 10.00
11.44 9.58
E[RH] (3)
.84 .23
1.69 1.53
1.46 1.43
1.70 1.60
E[Rf] (4)
E½RHex � (7)
9.74 7.98
.37 .35
SR[RE] (8)
2.81 3.05
10.17 8.57
.35 .33
B. Model with Higher Land Share
2.81 3.50
A. Benchmark Model
E½REex � (6)
2.75 3.48
9.87 8.20
.37 .35
20.1%
17.4%
20.5%
Dp H =R (9)
3.94 4.81
3.21 5.36
9.59 9.43
.38 .51
8.9%
D. Model with Idiosyncratic Unemployment Risk
3.25 4.69
C. Model with Depreciation Shocks
3.55 4.36
3.26 4.69
Std[Rf] (5)
9.75 9.57
10.07 8.32
10.37 8.72
9.33 8.10
EN[RH] (10)
8.91 9.34
8.38 6.79
8.91 7.29
7.63 6.50
EN ½RHex � (11)
8.64 9.00
9.72 9.24
9.57 9.23
9.30 8.78
StdN[RH] (12)
Note.—The table reports the same moments as table 2. Panel A repeats the benchmark results. Panel B features a model with a higher land share of 25 percent instead of 10 percent. Panel C contains results for a model in which housing depreciation contains an additive idiosyncratic component that is 0 percent or 5 percent with equal probability. Panel D contains results for a model with idiosyncratic unemployment risk: the income state is 1.01895 percent with 95 percent probability and 0.74 percent with 5 percent probability.
E[RE] (1)
Model
TABLE 9 Robustness: Return Moments
housing wealth, housing finance, and limited risk sharing
195
component in individual housing return volatility (Flavin and Yamashita 2002; Landvoigt et al. 2015). For this case, we change the individual’s house depreciation rate, dH, to be stochastic, equal to zero with probability .5 and 5 percent with probability .5. The mean is the same as the benchmark value, 2.5 percent. This amount of idiosyncratic risk causes swings of 100 percent in either direction around estimates of the mean, which implies substantial idiosyncratic housing risk. Importantly, these shocks have the potential to affect the volatility of individual housing returns StdN[RH]. The aggregate business cycle moments for this case are similar to those for the benchmark case without idiosyncratic depreciation shocks (table 8, panel C). The additional idiosyncratic volatility in house prices does make the average (across households) individual housing return slightly more volatile. It is StdN[RH] 5 9.3 in model 1 without depreciation shocks but Std½RHi � 5 9:72 with depreciation shocks, but the difference is quite small. Thus while depreciation shocks add risk to individual housing returns, they generate only a modest amount of additional variability in housing returns. Individual housing returns are more volatile than returns on the house price index, but these mechanisms are not enough in the model to capture the magnitude of estimated idiosyncratic volatility in housing returns found in local housing markets. For example, Landvoigt et al. (2015) estimate a standard deviation of the idiosyncratic component of individual housing returns for households in San Diego to be close to 9 percent but argue that total volatility is likely to be on the order of 14 percent. Flavin and Yamashita (2002) find a standard deviation of 14.29 percent. Income disasters.—As a final variation on our model, we solved a case with a form of idiosyncratic shocks more akin to “unemployment” shocks, modeled as rare but very large declines in income. The modeling approach follows Krusell and Smith (1999), whereby “unemployment” is characterized by an event that happens rarely but results in a large decline in income. Income shocks are therefore asymmetric, in the sense that good shocks are smaller but more frequent, while bad shocks are infrequent and very bad. The exact parameterization is such that income grows by roughly 1.9 percent per year 95 percent of the time but falls by 36 percent per year 5 percent of the time. Mean labor income growth is unchanged from the benchmark model. Note that the “unemployment” states do not imply that income declines all the way to zero; this is a simple way of capturing some basic exogenous level of insurance against employment shocks. Table 8, panel D, shows that, as for the case with depreciation shocks, this case has implications for real business cycle moments that are very similar to those of the benchmark model 1. But there are some notable differences for housing and equity assets. Table 9, panel D, shows that much more severe downside risk generates slightly higher equity and housing index return risk premia, and the increase in
196
journal of political economy
the P/MU ratio from model 1 to model 3 is considerably less than in the benchmark model. The more extreme idiosyncratic income risk of this case generates more precautionary saving in both model 1 and model 3, so that the same financial market liberalization leads to less of an increase in borrowing, less of an increase in risk sharing, and less of an impact on asset prices.
VI. Conclusion In this paper we have studied the macroeconomic and household-level consequences of fluctuations in housing wealth and housing finance. The framework endogenizes the interaction among financial and housing wealth, housing output and investment, rates of return and risk premia in both housing and equity assets, and consumption and wealth inequality. Interest rates in this environment are determined by a market clearing condition rather than modeled as an exogenous parameter. We have focused our investigation on studying the macroeconomic impact of systemic changes in housing finance that were a key characteristic of housing markets during the housing boom period from 2000 to 2006 and its aftermath. A theme of this analysis is the importance of time-varying housing risk premia that occur in general equilibrium environments with aggregate risk for transmitting and amplifying the effects of economywide shocks that shift risk-sharing opportunities in housing markets. The model has two key elements not previously considered in existing quantitative macro studies of housing finance that find small effects on house prices from a decline in financing constraints and large effects from a decline in interest rates. The first is aggregate business cycle risk, and the second is a realistic wealth distribution, achieved in the model by bequest heterogeneity in preferences. In contrast to models without these features, the framework here implies that national house prices may fluctuate considerably in response to changing financing constraints, but not in response to changing real interest rates. In the model here, both aggregate business cycle risk and economywide shifts in financing constraints influence households’ opportunities for risk sharing and insurance. As these opportunities change, the housing risk premium fluctuates, and it is through this channel that house prices rise following a relaxation of constraints. In a simulated transition for the period 2000– 2012, the model captures a large fraction of the run-up observed in US national house prices relative to housing fundamentals from 2000 to 2006 and predicts a sharp decline in housing markets starting in 2007. By contrast, mechanisms that help explain the low and declining interest rates over this period (such as borrowed funds from the rest of the world) play virtually no role in generating a housing boom. This occurs because
housing wealth, housing finance, and limited risk sharing
197
the foreign flows, which reduce interest rates but also reduce the effective supply of safe assets, generate an endogenous offsetting increase in the housing risk premium. This latter result runs contrary to the perception that, by driving interest rates lower, the vast inflow of foreign money into US bond markets from 2000 to 2006 was a major factor in the housing boom.17 These findings illustrate two fundamental principles. First, an economywide shift in financing constraints is itself an important source of aggregate risk that can have sizable effects on housing risk premia. The housing risk premium is an equilibrium quantity that responds both to business cycle shocks and to the tightness of financing constraints, as these two driving forces alter the landscape for risk sharing and insurance. Second, the model’s implications for the wealth distribution are of critical importance for the questions addressed here. In specifications of our model that deliver too little inequality, too few households operate near binding constraints, so changing those constraints has little influence on national home values. The model takes no stand on whether the changes in housing finance we have documented can be characterized as a rational response to economic conditions and/or regulatory changes. Focusing on features of the recent housing boom, Piskorski and Tchistyi (2011) study the mortgage contracting problem in a partial equilibrium setting with stochastic (exogenous) home price appreciation. They find that many elements of the housing boom, such as the relaxation of credit limits, the subsidization of risky (subprime) borrowers, and the clustering of defaults among riskier borrowers, can be explained as the outcome of an optimal dynamic mortgage contracting problem in which both borrowers and lenders are fully rational. Combining the partial equilibrium mortgage contracting problem with the general equilibrium model of limited risk sharing is a formidable challenge for future research. Future work could also address the role of regional heterogeneity in house price-rent ratios. The framework in this paper provides a model of the national price-rent ratio. But other researchers have emphasized that price-rent ratios varied widely across the United States during the boom-bust period (e.g., Gyourko, Mayer, and Sinai 2013). An extension of the model here could account for this heterogeneity, at least in part, if different regions were differentially exposed to the financial market liberalization, perhaps because of differences in demographics that implied some regions were more affected by the changes in credit constraints and mortgage transactions costs than others. Mian and Sufi (2009) provide evidence of the existence of such regional heterogeneity. For example, 17 This perception has been voiced by policy makers, academics, and industry analysts; see, e.g., Bernanke (2005, 2008) and Stiglitz (2010).
198
journal of political economy
they find that zip codes with a high prevalence of subprime debt experienced an unprecedented relative growth in mortgage credit from 2002 to 2005 despite sharply declining relative (and in some cases absolute) income growth in those zip codes. The model explored here has some notable limitations with regard to housing implications. It generates too high a correlation between home values and GDP and too little idiosyncratic house return volatility, and it abstracts from important real-world features of housing markets such as rental markets, long-term home mortgages, and default. This leaves room for much important additional work in determining the relative role of various economic factors in driving home values over the business cycle.
Appendix This appendix provides a detailed description of changes in housing finance, describes how we calibrate the stochastic shock processes in the model as well as all other parameters, describes the historical data we use to measure house pricerent ratios and returns, and describes our numerical solution strategy. A. Changes in Housing Finance This section documents the empirical evidence for changes in three features of housing finance. 1. Changes in Collateral Requirements First are changes in collateralized borrowing requirements, broadly defined. Collateralized borrowing constraints can take the form of an explicit down payment requirement for new home purchases, but they also apply to home equity borrowing. Recent data suggest that down payment requirements for a range of mortgage categories declined during or preceding the period of rapid home price appreciation from 2000 to 2006. Loan-to-value (LTV) ratios on subprime loans rose from 79 percent to 86 percent over the period 2001–5, while debt-income ratios rose (Demyanyk and Hemert 2011). For the top 50 percent of leveraged homeowners, the average down payment on securitized subprime and Alt-A loans went from 14 percent in 2000:Q1 to 2.7 percent in 2006:Q2 (Geanakoplos 2011). Other reports suggest that the increase in LTV ratios for prime mortgages was even greater, with one industry analysis finding that LTV ratios for conforming first and second mortgages rose from 60.4 percent in 2002 to 75.2 percent in 2006 (Zimmerman 2007, 5). These changes coincided with a surge in borrowing against existing home equity between 2002 and 2006 (Mian and Sufi 2009). By the end of 2006 households routinely were able to buy homes with 100 percent or higher financing using a piggyback second mortgage or home equity loan. The fraction of households with second liens rose dramatically during the boom. For subprime loans, that fraction rose from 3 percent in 2002 to 30 percent by the
housing wealth, housing finance, and limited risk sharing
199
18
end of 2006; for Alt-A loans it rose from 3 percent to 44 percent. In addition, second or third liens were often the way in which existing homeowners tapped into their home equity, often several quarters after they took out the original mortgage. This equity extraction through second liens is in addition to extraction via cash-out refinancing, another innovation of the boom that became increasingly prevalent. Lee, Mayer, and Tracy (2012) show that second-lien balances grew from about $200 billion at the start of 2002 to over $1 trillion by the end of 2007. It also shows that the prevalence of second mortgages rose in every US region from below 10 percent at the start of the boom (a bit higher in coastal cyclical markets) to around 40 percent in 2006 (except for the Midwest declining region, which peaks at a 20 percent share). More generally, there was a widespread relaxation of underwriting standards in the US mortgage market during the period leading up to the credit crisis of 2007, which provide a back door means of reducing collateral requirements for home purchases. The loosening of standards can be observed in the marked rise in simultaneous second-lien mortgages and in no-documentation or lowdocumentation loans (FDIC 2006). By the end of 2006 households routinely bought homes with 100 percent financing using a piggyback second mortgage or home equity loan. See also Mian and Sufi (2009). Loans for 125 percent of the home value were even available if the borrower used the top 25 percent to pay off existing debt. Industry analysts indicate that LTV ratios for combined (first and second) mortgages have since returned to more normal levels of no greater than 75–80 percent of the appraised value of the home. We assess the impact of these changes collectively by modeling them as a reduction in collateralized borrowing constraints and subsequent rise. 2. Housing Transactions Costs This section explains how we calibrate our housing transactions costs to empirical observations. In addition, below in this appendix we study a model in which the financial market liberalization was characterized by a decline in housing transactions costs, as well as a decline in financing constraints. (In the models of the main text, these costs are kept fixed.) We therefore also explain how we calibrate the change in transactions costs for this case.
18 An indirect indicator of the prevalence of the use of second mortgages is the fraction of first liens with LTV exactly equal to 80 percent. This fraction rose substantially between 2002 and 2006, as shown by Krainer, LeRoy, and Munpyung (2009). They also show that the fraction of fixed-rate mortgages (FRMs) with LTV greater than 80 percent decreased from 22 percent to 6 percent over this period. Their hypothesis is that mortgage lending underwent a shift from a practice of achieving greater home buyer leverage by simply increasing the LTV on the first lien (common prior to the housing boom) to a practice of achieving such greater leverage by combining an exactly 80 percent LTV first lien with a second lien taken out simultaneously (common during the housing boom). In short, during the housing boom, high LTV ratios were achieved by taking out “piggyback” second mortgages rather than by loading all leverage onto the first lien, as was previous practice. Consistent with this hypothesis, Krainer et al. find that the default rate on first-lien mortgages with exactly 80 percent LTV ratios was higher than that on first-lien mortgages that had either 79 percent or 81 percent LTV ratios.
200
journal of political economy
The period of rapid home price appreciation was marked by a decline in the cost of conducting housing transactions; houses, in effect, became more liquid. Closing costs for mortgages, mortgage refinancing, and home equity extraction all fell sharply in the years during and preceding the housing boom that ended in 2006. The Federal Housing Financing Board reports monthly data on mortgage and mortgage refinancing closing costs (based on a survey of the largest lenders). Closing costs on first mortgages and mortgage refinancings combined for Freddie Mac 30-year conforming mortgages declined 40 percent from the end of 2000 to the end of 2006. These costs began moving back up in the aftermath of the credit crisis of 2007/8. From 2007 to 2009, closing costs on Freddie Mac 30year conforming mortgages surged back up 56 percent. The most specific estimates in the reduction in borrowing costs are from Berndt, Hollifield, and Sandas (2010). They study subprime mortgage loans originated by New Century Financial Corporation. Total broker compensation decreased from 5.0 percent of the loan amount in 1997 to 4.3 percent in 2000 to 2.8 percent in 2006. Broker compensation includes direct fees and the yield spread premium, a fee the broker receives for steering the borrower toward a specific mortgage product. They also show that fees decreased after controlling for other loan characteristics. Corroborating evidence comes from a measure of total amount of dollars spent on real estate–related financial services divided by total dollars in real estate loans made. A reduction in that fraction signifies that these services become cheaper per unit. The data available on fees are “Financial service charges, fees, and commissions” from NIPA table 2.4.5. While this measure of fees includes all financial fees and is therefore a bit too broad, a substantial portion of the fees that are earned in this period are known to be real estate related. No finer breakdown of fees is available. For the denominator, the Federal Deposit Insurance Corporation (FDIC) has information on real estate loans for all FDICinsured commercial and savings banks. Fees per real estate dollar lent rise until 2000 and then fall from 7.3 percent in 2000 to 5.1 percent in 2006. Finally, transactions costs associated with home equity extraction declined significantly and coincided with a surge of 350 percent in mortgage equity withdrawal rates from 2000 to 2006.19 Greenspan and Kennedy (2008) compiled data on closing costs for home equity loans (HEL) and home equity lines of credit (HELOC) from periodic releases of the Home Equity Survey Report, published by the American Bankers Association. The data indicate that these costs trended down significantly: for HELOCs, they were 76 percent lower in 2004 than they were in 1988. For closed-end HELs, the costs declined 41 percent from 1998 to 2004. The surveys indicate that nonpecuniary costs, in the form of required documentation, time-lapsed from loan application to loan closing, and familiarity with available opportunities for refinancing and home equity extraction, also declined substantially. Mortgage closing costs for first and second (home equity) mortgages, HELOCs, and refinancing eroded considerably in the period during or preceding the housing boom, by 90 percent in some cases. Although some of these costs began to decline in the late 1980s and early 1990s, industry analysts
19 Figures are based on updated estimates provided by James Kennedy of the mortgage analysis in Greenspan and Kennedy (2005).
housing wealth, housing finance, and limited risk sharing
201
report that there was a delay in public recognition. Mortgage servicers only gradually implemented marketing tools designed to inform customers of lower costs for refinancing and home equity withdrawal. Likewise, news that borrowers could expect a reduction in financial documentation and shortened time periods from application to approval and from approval to closing also spread slowly (Peristiani et al. 1997). Taken together, we use the above evidence and estimates to calibrate the lending cost parameter, l. The data collected by Berndt et al. (2010) and the aggregate data on fees per dollar of real estate loan speak directly to the value of this parameter. As a compromise between the level and changes of these two measures of fees between 2000 and 2006, we choose l 5 5.5 percent. In the specification below in which we consider a decline in borrowing costs, we change this parameter to l 5 3.5 percent of the amount lent. In summary, the decline in both transaction costs and collateral constraints that we study in the model is designed to capture the broader empirical phenomenon that subprime mortgages, second mortgages, and HELOCs all became much more widely available between 2000 and 2006. For example, subprime constituted less that 10 percent of all mortgages in 2000, but it accounted for 40 percent of all originations in 2006. 3. Changes in Real Interest Rates A key development in the housing market in recent years is the secular decline in interest rates, which coincided with a surge in foreign ownership of US bonds.
F IG . A1.—Fixed-rate mortgage rate and 10-year constant maturity Treasury rate. The solid line plots the 30-year FRM rate; the dashed line plots the 10-year constant maturity Treasury yield (CMT). The FRM data are from Freddie Mac’s Primary Mortgage Market Survey. They are average contract rates on conventional conforming 30-year fixed-rate mortgages. The CMT yield data are from the St. Louis Federal Reserve Bank (FRED II). The data are monthly from January 1971 until December 2012.
202
journal of political economy
Figure A1 shows that both 30-year FRMs and the 10-year Treasury bond yield have trended downward, with mortgage rates declining from around 18 percent in the early 1980s to below 3.5 percent by the end of 2012. This was not merely attributable to a decline in inflation: the real annual interest rate on the 10-year Treasury bond fell from 3.6 percent in December 1999 to 0.93 percent in June 2006 using the consumer price index (CPI) as a measure of inflation. Alternatively, the 10year TIPS yield declined from 4.32 percent to 2.53 percent over this same period, or 180 basis points. The 10-year TIPS rate reached a prior low of 1.64 percent in September 2005, which represents a decline of 270 basis points, the same decline observed for the 10-year Treasury from December 1999 to June 2006. In the postcrisis period, both measures of the 10-year real rate continue to decline and are in negative territory at the end of our sample. At the same time, foreign ownership of US Treasuries (T-bonds and T-notes) increased from $118 billion in 1984, or 13.5 percent of marketable Treasuries outstanding, to $2.2 trillion in 2008, or 61 percent of marketable Treasuries (fig. A2, panel a). The bars, measured against the left axis, plot foreign holdings of long-term US Treasury securities (T-notes and T-bonds). It excludes (short-term) T-bills, measured in millions of nominal US dollars. The solid line, measured against the right axis, plots those same holdings as a percentage of total marketable US Treasuries. Marketable US Treasuries, available from the Office of Public Debt, are measured as total marketable held by the public less T-bills. Panel b plots foreign holdings of US Treasury securities (T-bills, T-notes, and T-bonds) and the sum of US Treasuries and US agency debt (e.g., debt issued by Freddie Mac and Fannie Mae), relative to GDP. Two of the series report only long-term (LT) debt holdings, while the other two series add in short-term debt holdings. Since no short-term debt holdings are available before 2002, we assume that total holdings grow at the same rate as long-term holdings before 2002. Dollar holdings continue to rise to $4.7 trillion in 2012, but the share declines to 52.5 percent. Foreign holdings of long-term US agency and government-sponsored enterprise-backed agency securities quintupled between 2000 and 2008, rising from $261 billion to $1.46 trillion, or from 7 percent to 21 percent of total agency debt. Agency holdings fall to $991 billion or 14 percent of the amount outstanding by 2012. Foreign holdings of long-term and short-term US Treasury and agency debt as a fraction of GDP doubled from 14.6 percent to 29.3 percent over the period 2000–2008 (fig. A2, panel b). Over this period, the fraction of marketable Treasuries relative to GDP was stable between 2000 and 2008 at around 31 percent. In the post-2008 period, foreign holdings continue to rise to 40.6 percent of GDP by 2012. Over the 2008–12 period, the supply of marketable Treasuries rises to 67 percent of GDP, so that foreign holdings fall as a share of Treasuries outstanding but rise relative to GDP. We study a model in which foreign purchases of US debt equal 18 percent of GDP, which is close to the observed average for the period 1974–2012. B. Calibration of Shocks The aggregate technology shock processes ZC and ZH are calibrated following a two-state Markov chain, with two possible values for each shock, fZC 5 ZCl , ZC 5 ZCh g, fZH 5 ZHl , ZH 5 ZHh g, implying four possible combinations:
F IG . A2.—Foreign holdings of US Treasuries. Panel a plots foreign holdings of US Treasuries. Panel b plots foreign holdings of US Treasury securities (T-bills, T-notes, and T-bonds) and the sum of US Treasuries and US agency debt (e.g., debt issued by Freddie Mac and Fannie Mae), relative to GDP. The foreign holdings data are from the Treasury International Capital System of the US Department of the Treasury. The foreign holdings data are available for December 1974, 1978, 1984, 1989, 1994, 1997, March 2000, and annually for June 2002 through June 2012. Nominal GDP is from the NIPA, table 1.1.5, line 1.
204
journal of political economy ZC 5 ZCl , ZH 5 ZHl , ZC 5 ZCh , ZH 5 ZHl , ZC 5 ZCl , ZH 5 ZHh , ZC 5 ZCh , ZH 5 ZHh :
Each shock is modeled as ZCl 5 1 2 eC , ZCh 5 1 1 eC , ZHl 5 1 2 eH , ZCh 5 1 1 eH , where the volatilities of eC and eH are calibrated to match the volatilities of GDP and residential investment in the data. We assume that ZC and ZH are independent of one another. Let PC be the transition matrix for ZC and PH be the transition matrix for ZH. The full transition matrix equals " H C H C# pll P plh P P5 , H C phlH PC phh P where " P 5 H
pllH plhH
#
H phlH phh
" 5
pllH
1 2 pllH
H 1 2 phh
H phh
# ,
and where we assume PC, defined analogously, equals PH. We calibrate values for the matrices as " P 5 C
" P 5 H
2
:60 :40 :25 :75 :60 :40 :25 :75 :36
# , # ⇒ :24
:24
:16
3
7 6 6 :15 :45 :10 :30 7 7 6 P5 6 7: 6 :15 :10 :45 :30 7 5 4 :0625 :1875 :1875 :5625 With these parameter values, we match the average length of expansions divided by the average length of recessions (equal to 5.7 in NBER data from the period 1945–2001). We define a recession as the event {ZCl, ZHl} so that the probability of staying in a recession is pllH pllC 5 :36, implying that a recession persists on average for 1/(1 2 .36) 5 1.56 years. We define an expansion as the event {ZCh, ZHl}, {ZCl, ZHh}, or {ZCh, ZHh}. Thus, there are four possible states (one recession, three expansion). The average amount of time spent in each state is given by the stationary distribution (4 � 1) vector p, where
housing wealth, housing finance, and limited risk sharing
205
Pp 5 p: That is, p is the eigenvector for P with corresponding eigenvalue equal to one. The first element of p, denoted p1, multiplies the probabilities in P for transitioning to any of the four states tomorrow conditional on being in a recession state today. Therefore, p1 gives the average amount of time spent in the recession state, while p2, p3, and p4 give the average amount of time spent in the other three (expansion) states. Given the matrix P above, the solution for p is 0
0:1479
1
C B B 0:2367 C C B p5B C: B 0:2367 C A @ 0:3787 This implies that the chain spends 14.79 percent of the time in a recession state and 85.21 percent of the time in expansion states, so the average length of expansions relative to that of recessions is 85.21/14.79 5 5.76 years. i Idiosyncratic income shocks follow the first-order Markov process lnðZa,t Þ5 i lnðZa21,t21 Þ 1 eia,t . We directly calibrate the specification in levels: i i i Za,t 5 Za,t21 ð1 1 Ea,t Þ:
The standard deviation in the unit root process in idiosyncratic earnings is calibrated to be equal to je 5 .125. This represents the average of the recession and expansion estimates for this parameter given in Storesletten, Telmer, and Yaron (2004b) and very close to the je 5 .129 Storesletten, Telmer, and Yaron (2004a) estimate in a homoskedastic model. Thus, in our benchmark models, i Ea,t takes on one of two values in each aggregate state: E
i a,t
5
( 0:125
with Pr 5 :5
20:125 with Pr 5 :5:
i i Thus, EðZa,t =Za,t21 Þ 5 1. For the case of the model designed to mimic unemployi ment shocks (see text), Ea,t takes on ( 0:0185 with Pr 5 :95 i 5 Ea,t 20:36 with Pr 5 :5, i i =Za,t21 Þ 5 1. where again, EðZa,t
C. Calibration of Parameters Parameters pertaining to the firms’ decisions are set as follows. The capital depreciation rate, d, is set to 0.12, which corresponds to the average Bureau of Economic Analysis (BEA) depreciation rates for equipment and structures. The housing depreciation rate, dH, is set to 0.025 following Tuzel (2010). Following
206
journal of political economy
Kydland and Prescott (1982) and Hansen (1985), the capital share for the nonhousing sector is set to a 5 0.36. For the residential investment sector, the value of the capital share in production is taken from a BEA study of “gross product originating,” by industry. The study finds that the capital share in the construction sector ranges from 29.4 percent to 31.0 percent over the period 1992–96. We therefore set the capital share in the housing sector to n 5 0.30.20 The adjustment costs for capital in both sectors are assumed to be the same quadratic function of the investment to capital ratio, J½ðI =K Þ 2 d�2 , where the constant J is chosen to represent a trade-off between the desire to match aggregate investment volatility simultaneously with the volatility of asset returns. Under this calibration, firms pay a cost only for net new investment; there is no cost to replace depreciated capital. This implies that the total adjustment cost J½ðI =K Þ 2 d�2 under our calibration is quite small: on average, less than 1 percent of investment, It. The fixed quantity of land/permits available each period, L, is set to a level that permits the model to approximately match the housing investment–GDP ratio. In postwar data this ratio is 4.8 percent; under our calibration of L, the ratio ranges from 5.4 percent to 5.9 percent across models 1, 2, and 3. Parameters of the individual’s problem are set as follows. The survival probability pa11Fa 5 1 for a 1 1 ≤ 65. For a 1 1 > 65, we set pa11Fa equal to the fraction of households over 65 born in a particular year alive at age a 1 1, as measured by the US Census Bureau. From these numbers, we obtain the stationary age distribution in the model and use it to match the average earnings over the life cycle, Ga, to that observed from the SCF. Risk aversion is set to j21 5 8 to help the model match the high Sharpe ratio for equity observed in the data. Low values for this parameter imply unrealistically low risk premia and Sharpe ratios. The static elasticity of substitution between C and H is set to unity (Cobb-Douglas utility), following evidence in Davis and Ortalo-Magne (2011) that expenditure shares on housing are approximately constant over time and across US metropolitan statistical areas. The weight x on C in the utility function is set to 0.70, corresponding to a housing expenditure share of 0.30. It is not immediately obvious how to set the parameter z (the fraction of bequesters). We use the results of Skinner and Zeldes (2002), who report that, in the 1998 SCF, saving for one’s estate or children was mentioned as a reason for saving by 8 percent of all households and 12 percent of all retirees. We take the midpoint of these numbers as our value for the fraction of bequesters in the economy, z 5 0.10. Given this value, we completely pin down values for the time discount parameter b and y (strength of bequest motive) jointly to match the average level of real interest rates and the degree of wealth inequality (Gini coefficient) in the data. For this we set b 5 0.8234, z 5 0.10, and y 5 1016. While b 5 0.8234 is low compared to models in which no agents have a bequest motive, note that the saving rate in this economy is equivalent to one with a much higher b because of the bequest motives. In fact, a low b for most of the population com-
20 See Lum and Yuskavage (1997). Gross product originating is equal to gross domestic income, whose components can be grouped into categories that approximate shares of labor and capital. Under a Cobb-Douglas production function, these equal shares of capital and labor in output.
housing wealth, housing finance, and limited risk sharing
207
bined with a strong bequest motive for a small fraction of the population allows us to roughly match the high level of wealth inequality in the data. We assume that the bequest motive is passed from parents to offspring so that a dynasty with a bequest motive never switches to one without, and vice versa. The other parameters of the individual’s problem are less precisely pinned down from empirical observation. The costs of stock market participation could include nonpecuniary costs as well as explicit transactions fees. Vissing-Jorgensen (2002) finds support for the presence of a fixed, per-period participation cost, but not for the hypothesis of variable costs. She estimates the size of these costs and finds that they are small, less than $50 per year in year 2000 dollars. These findings motivate our calibration of these costs so that they are no greater than i 1 percent of per capita, average consumption, denoted C in table 1. We are aware of no publicly available time series on collateral requirements for mortgages and home equity loans. However, our own conversations with government economists and industry analysts who follow the housing sector indicated that, prior to the housing boom that ended in 2006, the combined LTV for first and second conventional mortgages (mortgages without mortgage insurance) was rarely if ever allowed to exceed 75–80 percent of the appraised value of the home. In addition, home equity lines of credit were not widely available until relatively recently (McCarthy and Steindel 2007). By contrast, during the boom years, households routinely bought homes with 100 percent financing using a piggyback second or home equity loan. Our model 1 sets the maximum combined LTV (first and second mortgages) to be 75 percent, corresponding to - 5 25 percent. In model 2, we lower this to - 5 1 percent. It should be emphasized that 1 2 - gives the maximum combined (first and second mortgages) LTV ratio. This will differ from the average LTV ratio because not everyone borrows up to the credit limit. The fixed and variable “moving” components of the housing transactions costs are governed by the parameters w0 and w1. These costs are more comprehensive than the costs of buying and selling existing homes. They include costs of any change in housing consumption, such as home improvements and additions, as well as nonpecuniary psychological costs. To anchor the baseline level of these costs, in model 1 we set fixed costs w0 and variable costs w1 to match the average number of years individuals in the model go without changing housing consumption equal to the average length of residency (in years) for homeowners in the SCF across the 1989–2001 waves of the survey. In the equilibrium of our model, this amount corresponds to a value for w0 that is approximately 3.2 percent of annual per capita consumption and a value for w1 that is approximately 5.5 percent of the value of the house ptH Ha,ti . These costs are maintained between models 1, 2, and 3. As discussed above in the section on changes in housing finance, we use direct estimates to calibrate the lending cost parameter, l. As a compromise between the two different measures of fees and their reduction between 2000 and 2006, we set l 5 5.5 percent in model 1. Finally, we calibrate foreign ownership of US debt, BtF , by targeting a value for foreign bondholdings relative to GDP. Specifically, when we add foreign capital to the economy in model 3, we experiment with several constant values for BtF ; B F until the model solution implies a value equal to 18 percent of average total
208
journal of political economy
output, Y , an amount that is approximately equal to the rise in foreign ownership of US Treasuries and agency debt over the period 2000–2008. Figure A2, panel b, shows that, as of the middle of 2008, foreign holdings of long-term Treasuries alone represent 15 percent of GDP. Higher values are obtained if one includes foreign holdings of US agency debt and/or short-term Treasuries. Depending on how many of these categories are included, the fraction of foreign holdings in 2008 ranges from 15 to 30 percent. D. Additional Results: Changing Borrowing Costs This section considers a model in which we redefine a financial market liberalization (FML) as a simultaneous increase in the maximum LTV ratio and a decline in the cost of borrowing l. Thus the new model 2 is one that is identical to model 1 above but has both lower financing constraints and lower borrowing costs. The available data discussed above suggest that a decline in borrowing costs l from 5.5 percent to 3.5 percent of the amount borrowed is warranted. The decrease in the maximum LTV ratio is kept the same as in the text (75 percent to 99 percent). Model 3 in this case then adds foreign flows to the new model 2. In this model, an FML improves risk sharing not only because it increases access to credit (the LTV effect) but also because lower transactions costs reduce the expense of acquiring additional collateral, which increases borrowing capacity that can be used to insure against shocks. The results are reported in table A1. Since the borrowing costs are specific to housing, house prices and stock prices become more different from one another. This is reflected in a lower correlation of house P/MU and stock price/dividend ratios in model 2 (0.40 vs. 0.59 in the baseline, unreported). We find that an FML lowers risk premia more than in the benchmark, but disproportionately so for housing. Table 9 shows that the housing risk premium declines by 2.9 percentage points from model 1 to model 3 versus a decline of 1.8 percentage points in the baseline; the decline in the equity risk premium is 0.04 percent versus an increase of 0.69 percent in the baseline. As a result, the increase in the P/MU ratio due to an FML and foreign inflows is 27.7 percent, substantially higher than the 20.5 percent in the baseline model results. This 27.7 percent increase comes close to matching the 32 percent increase in the Flow of Funds and Freddie Mac data, even though business cycle shocks are averaged out. This exercise also produces larger shifts in housing wealth shares than the baseline model, as housing becomes increasingly attractive with lower transaction costs. Finally, this version of the model generates a larger increase in financial wealth inequality; the Gini coefficient goes from 124.7 in model 1 to 141.0 in model 2 (compared to 132.5 in the baseline). This is due to the lower borrowing costs making borrowing against housing wealth more attractive to all agents, not only the financially constrained, and due to the larger effects of an FML on risk premia and asset valuations. E. Numerical Solution Procedure The numerical solution strategy consists of solving the individual’s problem taking as given her beliefs about the evolution of the aggregate state variables. With
4.51 4.62 5.10
4.51 4.73 4.99
Model 1 Model 2 Model 3
Model 1 Model 2 Model 3
8.44 8.89 10.90
8.44 8.55 11.04
Std[RE] (2)
11.44 8.56 9.05
11.44 9.45 9.58
E[RH] (3)
1.70 2.49 2.22
1.70 2.04 1.60
E[Rf] (4)
3.26 3.47 4.60
3.26 3.42 4.69
E½RHex � (7)
2.81 2.58 3.50
9.74 7.41 7.98
.37 .33 .35
SR[RE] (8)
A. Benchmark Model
E½REex � (6)
2.81 2.24 2.77
9.74 6.07 6.83
.37 .28 .29
B. Lower Borrowing Costs Model
Std[Rf] (5)
32.1% 27.7%
20.1% 20.5%
Dp H =R (9)
9.33 6.17 6.93
9.33 7.55 8.10
EN[RH] (10)
7.63 3.70 4.71
7.63 5.51 6.50
EN ½RHex � (11)
9.30 6.96 8.82
9.30 7.35 8.78
StdN[RH] (12)
Note.—The table reports the same asset pricing moments as table 5. Panel A repeats the benchmark results. Panel B features a model with a different financial market liberalization. Model 1 is identical to the benchmark. In model 2 we not only increase the maximum LTV ratio from 75 percent to 99 percent but also lower the cost of borrowing, l, from 5.5 percent of the amount borrowed to 3.5 percent. Model 3 adds the benchmark foreign capital inflows to this new model 2.
E[RE] (1)
Model
TABLE A1 Robustness: Model with Lower Borrowing Costs
210
journal of political economy
this solution in hand, the economy is simulated for many individuals and the simulation is used to compute the equilibrium evolution of the aggregate state variables, given the assumed beliefs. If the equilibrium evolution differs from the beliefs individuals had about that evolution, a new set of beliefs are assumed and the process is repeated. Individuals’ expectations are rational once this process converges and individual beliefs coincide with the resulting equilibrium evolution. One important note: we have no results on uniqueness. We are unaware of any such results in the literature concerning models with the degree of complexity considered here, as is typically the case. The state of the economy is a pair, (Zt, mt), where mt is a measure defined over S ðA � Z � W � HÞ, where A 5 f1, 2, … , Ag is the set of ages, Z is the set of all possible idiosyncratic shocks, W is the set of all possible beginning-of-period financial wealth realizations, and H is the set of all possible beginning-of-period housing wealth realizations. That is, mt is a distribution of agents across ages, idiosyncratic shocks, financial, and housing wealth. Given a finite-dimensional vector to approximate mt and a vector of individual state variables mit 5 ðZti , Wt i , Hti Þ, the individual’s problem is solved using dynamic programming. An important step in the numerical strategy is approximating the joint distribution of individuals, mt, with a finite-dimensional object. The resulting approximation, or “bounded rationality” equilibrium, has been used elsewhere to solve overlapping generations models with heterogeneous agents and aggregate risk, including, among others, Krusell and Smith (1998), Storesletten et al. (2007), Gomes and Michaelides (2008), Ríos-Rull and Sánchez-Marcos (2008), and Favilukis (2013). For our application, we approximate this space with a vector of aggregate state variables given by mAG 5 ðZt , Kt , St , Ht , ptH , qt Þ, t where Kt 5 KC ,t 1 KH ,t and St 5
KC,t : KC,t 1 KH ,t
The state variables are the observable aggregate technology shocks, the first moment of the aggregate capital stock, the share of aggregate capital used in production of the consumption good, the aggregate stock of housing, and the relative house price and bond price, respectively. The bond and the house price are natural state variables because the joint distribution of all individuals matters only for the individual’s problem insofar as it affects asset prices. Note that knowledge of Kt and St is tantamount to knowledge of K C,t and KH,t separately, and vice versa (KC,t 5 Kt St ; KH ,t 5 Kt ð1 2 St Þ).
housing wealth, housing finance, and limited risk sharing
211
Because of the large number of state variables and because the problem requires that prices in two asset markets (housing and bond) must be determined by clearing markets every period, the proposed problem is highly numerically intensive. To make the problem tractable, we obviate the need to solve the dynamic programming problem of firms numerically by instead solving analytically for a recursive solution to the value function taking the form V ðKt Þ 5 Q t Kt , where Q t (Tobin’s q) is a recursive function. We discuss this below. In order to solve the individual’s dynamic programming problem, the individi AG ual must know mAG and mit and aggregate shocks Zt11. t11 and mt11 as a function of mt Here we show that this can be achieved by specifying individuals’ beliefs for the laws of motion of four quantities: A. B. C. D.
Kt11, H pt11 , qt11, and ðbt11 Lt11 =Lt ÞðQ C ,t11 2 Q H ,t11 Þ, where Q C,t11 ; VC,t11 =KC,t11 and analogously for Q H,t11.
Let bt11 Lt11 =Lt ; Mt11 . The beliefs are approximated by a linear function of the aggregate state variables as follows: ϰt11 5 AðnÞ ðZt , Zt11 Þ � e ϰt ,
(A1)
where A(n)(Zt, Zt11) is a 4 � 5 matrix that depends on the aggregate shocks Zt and Zt11 and H , qt11 , ½Mt11 ðQ C,t11 2 Q H ,t11 Þ��0 , ϰt11 ; ½Kt11 , pt11
e ϰt ; ½Kt , ptH , qt , St , Ht �0 : We initialize the law of motion (A1) with a guess for the matrix AðnÞ ðZt , Zt11 Þ, given by Að0Þ ðZt , Zt11 Þ. The initial guess is updated in an iterative procedure (described below) to ensure that individuals’ beliefs are consistent with the resulting equilibrium. i Given (A1), individuals can form expectations of mAG t11 and mt11 as a function of i mAG and m and aggregate shocks Z . To see this, we employ the following equit11 t t librium relation (as shown below) linking the investment-capital ratios of the two production sectors: IH ,t I 1 E ½M ðQ 5 C,t 1 2 Q H ,t11 Þ�: KH ,t KC,t 2J t t11 C ,t11
(A2)
Moreover, note that Et ½Mt11 ðQ C,t11 2 Q H ,t11 Þ� can be computed from (A1) by integrating the fourth equation over the possible values of Zt11 given e ϰt and Zt. Equation (A2) is derived by noting that the consumption firm solves a problem taking the form
212
journal of political economy �
V ðKC,t Þ 5 max Z IC,t ,NC,t
12a C ,t
a C,t
K N
12a C,t
2 wt NC,t 2 IC,t
�2 IC,t 2J 2d KC ,t
1 Et ½Mt11 V ðKC,t11 Þ�: The first-order condition for optimal labor choice implies NC,t 5
1=a ZC12a ,t ð1 2 aÞ KC ,t : wt
Substituting this expression into V(KC,t), the optimization problem may be written �
V ðKC,t Þ 5 maxXC ,t KC,t 2 IC,t It
I 2 J C,t 2 d KC,t
�2 KC ,t
(A3)
1 Et ½Mt11 V ðKC,t11 Þ� subject to KC,t11 5 ð1 2 dÞKC,t 1 IC ,t , where
XC,t
ð12aÞ=a ZC ,t ;a ð1 2 aÞ ZC ,t wt
is a function of aggregate variables over which the firm has no control. The housing firms solves 12f f V ðKH ,t Þ 5 maxptH ZH12nf ðKHn ,t NH12n ,t ðLt Þ ,t Þ 2 wt NH ,t 2 IH ,t IH ,t ,NH ,t
� 2 ptL Lt 2 J
IH ,t 2d KH ,t
�2
(A4) 1Et ½Mt11 V ðKH ,t11 Þ�:
The first-order conditions for optimal labor and land/permits choice for the housing firm imply that NH ,t 5 kN KH ,t and Lt 5 kL KH ,t , where � �1=nf , kN 5 k1f k212f � fð12nÞ 12fð12nÞ 1=fn k2 , kL 5 k1 k1 5 ptH ZH12nf ,t fð1 2 nÞ=wt , L k2 5 ptH ZH12nf ,t ð1 2 fÞ=pt :
Substituting this expression into V(KH,t), the optimization problem may be written
housing wealth, housing finance, and limited risk sharing �
V ðKH ,t Þ 5 maxXHt KH ,t 2 IH ,t It
�2 IH ,t 2J 2 d KH ,t KH ,t
213
(A5)
1 Et ½Mt11 V ðKH ,t11 Þ� subject to KH ,t11 5 ð1 2 dÞKH ,t 1 IH ,t , where ð12nÞf 12f kL : XH ,t 5 ptH ZH12nf ,t fnkN
Let s index the sector as either consumption, C, or housing, H. We now guess and verify that for each firm, V(Ks,t11) for s 5 C, H takes the form V ðKs,t11 Þ 5 Qs,t11 Ks,t11 ,
s 5 C, H ,
(A6)
where Q s,t11 depends on aggregate state variables but is not a function of the firm’s capital stock Ks,t11 or investment Is,t. Plugging (A6) into (A3), we obtain � �2 Is,t 2 d Ks,t V ðKs,t Þ 5 maxXs,t Ks,t 2 It 2 J I Ks,t (A7) t
1 Et ½Mt11 Q s,t11 �½ð1 2 dÞKs,t 1 Is,t �: The first-order conditions for the maximization (A7) imply Is,t E ½M Q �21 : 5 d 1 t t11 s,t11 Ks,t 2J
(A8)
Substituting (A8) into (A7), we verify that V(Ks,t) takes the form Q s,t Ks,t : � � E ½M Q �21 V ðKs,t Þ ; Q s,t 5 Xs,t Ks,t 2 d 1 t t11 s,t11 Ks,t 2J � � E ½M Q �21 2 2 J t t11 s,t11 Ks,t 2J 1 ð1 2 dÞðEt ½Mt11 Q s,t11 �ÞKs,t 1 Et ½Mt11 Q s,t11 � � � E ½M Q �21 Ks,t : � d 1 t t11 s,t11 2J Rearranging terms, it can be shown that Qs,t is a recursion: � � E ½M Q �21 Q s,t 5 Xs,t 1 ð1 2 dÞ 1 2J t t11 s,t11 2J � �2 E ½M Q �21 : 1 J t t11 s,t11 2J
(A9)
214
journal of political economy
Since Q s,t is a function only of Xs,t and the expected discounted value of Q s,t11, it does not depend on the firm’s own Ks,t11 or Is,t. Hence we verify that V ðKs,t Þ 5 Q s,t Ks,t . Although Q s,t does not depend on the firm’s individual Ks,t11 or Is,t, in equilibrium it will be related to the firm’s investment-capital ratio via � �
� �2 I I Q s,t 5 Xs,t 1 ð1 2 dÞ 1 2J s,t 2 d 1 J s,t 2 d , (A10) Ks,t Ks,t as can be verified by plugging (A8) into (A9). Note that (A8) holds for the two representative firms of each sector, that is, Q C,t and Q H,t; thus we obtain (A2) above. With (A10), it is straightforward to show how individuals can form expectations i AG of mAG and mit and aggregate shocks Zt11. Given a grid t11 and mt11 as a function of mt of values for Kt and St, individuals can solve for KC,t and KH,t from KC,t 5 Kt St and KH ,t 5 Kt ð1 2 St Þ. Combining this with beliefs about Kt11 from (A1), individuals can solve for It ; IC,t 1 IH ,t from Kt11 5 ð1 2 dÞKt 1 It . Given It and beliefs about bk Lt1k ðQ C ,t11 2 Q H ,t11 Þ Lt from (A1), individuals can solve for IC,t and IH,t from (A2). Given IH,t and the accumulation equation KH ,t11 5 ð1 2 dÞKH ,t 1 IH ,t , individuals can solve for KH,t11. Given IC,t individuals can solve for KC,t11 using the accumulation equation KC,t11 5 ð1 2 dÞKC,t 1 IC,t . Using KH,t11 and KC,t11, individuals can solve for St11. Given a grid of values for Ht, Ht11 can be computed from Ht11 5 ð1 2 dH ÞHt 1 YH ,t , where 12f f YH ,t 5 ZH12nf ðKHn ,t NH12n ,t ðLt Þ ,t Þ is obtained from knowledge of ZH,t, KH,t (observable today), from the equilibrium condition Lt 5 L and by combining (23) and (25) to obtain the decomposition of Nt into NC,t and NH,t. Equation (A1) can be used diH rectly to obtain beliefs about qt11 and pt11 . To solve the dynamic programming problem, individuals also need to know the equity values VC,t and VH,t. But these come from knowledge of Q s,t (using [A10]) and Ks,t via Vs,t 5 Q s,t Ks,t for s 5 C, H. Values for dividends in each sector are computed from � � I DC,t 5 YC,t 2 IC,t 2 wt NC ,t 2 fC C ,t KC,t , KC,t � � I DH ,t 5 ptH YH ,t 2 IH ,t 2 ptL Lt 2 wt NH ,t 2 fH H ,t KH ,t KH ,t and from 12a a 2a 12f nf KC ,t NC,t 5 ð1 2 nÞfptH ZH12nf KH ,t NHfð,t12nÞ21 wt 5 ð1 2 aÞZC,t ,t Lt
and by again combining (23) and (25) to obtain the decomposition of Nt into NC,t and NH,t. Finally, the evolution of the aggregate technology shocks Zt11 is given by the first-order Markov chain described above; hence agents can compute the possible values of Zt11 as a function of Zt. i i i Values for mit11 5 ðZt11 , Wt11 , Ht11 Þ are given from all of the above in combinai Þ5 tion with the first-order Markov process for idiosyncratic income logðZa,t i i i Þ 1 eia,t . Note that Ht11 is a choice variable, while Wt11 5 vit ðVC,t11 1 logðZa21,t21
housing wealth, housing finance, and limited risk sharing
215
VH ,t11 1 DC,t11 1 DH ,t11 Þ 1 B requires knowing Vs,t11 5 Qs,t11 Ks,t11 and Ds,t11, s 5 C, H, conditional on Zt11.These in turn depend on Is,t11, s 5 C, H, and may be computed in the manner described above by rolling forward one period both the equation for beliefs (A2) and accumulation equations for KC,t11 and KH,t11. The individual’s problem, as approximated above, may be summarized as follows (where we drop age subscripts when no confusion arises). The problem is illustrated for the nonbequesters; the problem for the bequesters is analogous using (6) in place of (5): i t11
i i Va,t ðmAG max U ðCti , Hti Þ 1 bpi Et ½Va11,t11 ðmAG t , mt Þ 5 t11 , mt11 Þ�: i i Ht11 ,vit11 ,Bt11
(A11)
The above problem is solved subject to (9) and (10) if the individual is of working age and subject to the analogous versions of (9) and (10) (using pension income in place of wage income) if the individual is retired. The problem is also solved subject to an evolution equation for the state space: ðnÞ AG mAG t11 5 G ðmt , Zt11 Þ:
The term G(n) is the system of forecasting equations that is obtained by stacking all the beliefs from (A1) and accumulation equations into a single system. This step requires us to make an initial guess for A(0) in the laws of motion for the four quantities in A–D. This dynamic programming problem is quite complex numerically because of a large number of state variables but is otherwise straightforward. Its implementation is described below. We next simulate the economy for a large number of individuals using the policy functions from the dynamic programming problem. Using data from the simulation, we calculate A–D as linear functions of e ϰt and the initial guess A(0). In particular, for every Zt and Zt11 combination we regress A–D on Kt, St, Ht, ptH , and qt. This is used to calculate a new A(n) 5 A(1), which is used to resolve for the entire equilibrium. We continue repeating this procedure, updating the sequence {A(n)}, n 5 0, 1, 2, . . . , until (1) the coefficients in A(n) between successive iterations are arbitrarily small, (2) the regressions have high R 2 statistics, and (3) the equilibrium is invariant to the inclusion of additional state variables such as additional lags and/ or higher-order moments of the cross-sectional wealth and housing distribution. We discuss numerical accuracy below. During the simulation step, an additional numerical complication is that two markets (the housing and bond markets) must clear each period. This makes ptH and qt convenient state variables: the individual’s policy functions are a response i i to a menu of prices ptH and qt. Given values for YH,t, Ha11,t11 , Ha,ti , Ba,t , and BtF form the simulation; and given the menu of prices ptH and qt and the beliefs (A1), we H then choose values for pt11 and qt11 that clear markets in t 1 1. The initial allocations of wealth and housing are set arbitrarily to ensure that prices in the initial period of the simulation, p1H and q1, clear markets. However, these values are not used since each simulation includes an initial burn-in period of 150 years that we discard for the final results. The procedure just described requires a numerical solution to the individual’s problem, a simulation using that solution for a large number of agents, and then a repetition (many times) of this procedure using the updated coefficients
216
journal of political economy
(n)
in A . The continuum of individuals born each period in this solution step is approximated by a number large enough to ensure that the mean and volatility of aggregate variables are not affected by idiosyncratic shocks. We check this by simulating the model for successively larger numbers of individuals in each age cohort and checking whether the mean and volatility of aggregate variables change. In addition, we have solved particular cases of the model for different numbers of agents. For numbers ranging from a total of 2,500 to 100,000 agents in the population, we found no significant differences in the aggregate allocations we report. But because of the high numbers of iterations required for convergence, larger numbers of agents drastically increase the computational burden and solving time. Owing to the number of cases with different parameter configurations we solve, we therefore use 10,000 agents in this iterative-simulation part of the model solution algorithm. We can, however, use a much larger number of agents for the aggregate statistics we report as output of the model since, once the model is solved, computing these requires only a one-time simulation. Doing so ensures that our reported statistics are as free as possible of any small amount of remaining idiosyncratic (income and death) risk. We therefore generate data for 100,000 agents when we perform the one-time simulation used to report aggregate statistics for the figures and tables of the paper. We could not readily increase the number of agents in the one-time simulation beyond 100,000 because attempts to do so exceeded the available memory on a workstation computer. F. Numerical Solution to the Individual’s Dynamic Programming Problem We now describe how the individual’s dynamic programming problem is solved. First we choose grids for the continuous variables in the state space. That is, we pick a set of values for W i, H i, K, H, S, p H, and q. Because of the large number of state variables, it is necessary to limit the number of grid points for some of the state variables given memory/storage limitations. We found that having a larger number of grid points for the individual state variables was far more important than for the aggregate state variables, in terms of the effect it had on the resulting allocations. Thus we use a small number of grid points for the aggregate state variables but compensate by judiciously choosing the grid point locations after an extensive trial and error experimentation designed to use only those points that lie in the immediate region where the state variables ultimately reside in the computed equilibria. As such, a larger number of grid points for the aggregate state variables was found to produce results very similar to those reported using only a small number of points. We pick 35 points for W i, 16 points for H i, and 4 points for K, H, S, p H, and q. The grid for W i starts at the borrowing constraint and ends far above the maximum wealth reached in simulation. This grid is very dense around typical values of financial wealth and is sparser for high values. The housing grid is constructed in the same way. Given the grids for the state variables, we solve the individual’s problem by value function iteration, starting for the oldest (age A) individual and solving backward. The oldest individual’s value function for the period after death is zero for all levels of wealth and housing (alternatively, it could correspond to an exogenously specified bequest motive). Hence the value function in the final period of
housing wealth, housing finance, and limited risk sharing
217
life is given by VA 5 maxH ,v ,B U ðC , H Þ subject to the constraints above for (A11). Given VA (calculated for every point on the state space), we then use this function to solve the problem for a younger individual (aged A 2 1). We continue iterating backward until we have solved the youngest individual’s (age 1) problem. We use piecewise cubic splines (Fortran methods PCHIM and CHFEV) to interpolate points on the value function. Any points that violate a constraint are assigned a large negative value. i t11
G.
i t11
i t11
i A
i A
Numerical Checks
This section presents some numerical checks designed to quantify departures from a fully rational equilibrium. At the end of this section, we discuss an important caution about these tests, namely, that their appropriateness for our bounded rationality equilibrium is open to question, and there is no consensus on the acceptable degree of departure from full rationality. Table A2 begins with standard R 2 statistics. The one-step-ahead R 2 statistics for the four quantities A–D are reported in column 1 of table A2, with the lowest being .994 for the Q forecasting D. These statistics are all quite high and suggest a high degree of accuracy. These R 2 statistics amount to a one-period-ahead test of the forecasting equations. Although most studies using the Krusell and Smith (1998) approach report just these one-period-ahead tests, Den Haan (2010) argues that even very accurate one-period-ahead forecasts can result in inaccurate multiperiod forecasts as the errors build up over time. Krusell and Smith (1998) suggest also looking at forecasting errors several periods ahead. In particular, for a given sequence of aggregate shocks from t to t 1 k, they suggest using the forecasting quantities A–D to iteratively forecast the state variables k periods ahead. This forecast would use actual state variables at t, the aggregate shocks from t to t 1 k, and A–D, but it would not use actual state variable realizations between t and t 1 k. The forecasted state variables at t 1k are
TABLE A2 Numerical Checks: R2 in Forecasting Equation Quantity A. Kt11 H B. pt11 C. qt11 D. ðbt11 Lt11 =Lt ÞðQ C,t11 2 Q H ,t11 Þ
In/(k 5 1)
In/(k 5 ∞)
Out/(k 5 ∞)
.997 .997 1.000 .994
.947 .995 .999 .967
.931 .995 .999 .962
Note.—This table describes the accuracy of our forecasting equations. For various horizons and simulations (described in the text), we report the R 2, dext is its forefined as 1 2 ½jðxt 2 x t Þ2 =jðxt Þ2 �, where xt is the actual variable and b cast. The simulation can be done with the same sequence of aggregate shocks as the simulation used to compute the original coefficients (in-sample) or with a new sequence of aggregate shocks (out-of-sample). The R 2 statistics are computed either one period ahead (k 5 1) or using the full sample procedure described in Den Haan (2010) (k 5 ∞).
218
journal of political economy
then compared to the realized state variables from simulating the actual model (with heterogeneous agents) for the same sequence of shocks. Den Haan (2010) extends this idea by simulating the model over the full sample (in our case 1,750 periods) and then taking the same sequence of aggregate shocks and using the forecasting equations to simulate the state variables for the same sample. Note that since this is done for a large sample (furthermore, the first 250 periods are thrown out), this is tantamount to Krusell and Smith’s (1998) suggestion for a very large (or infinite) k. We will refer to this test as k 5 ∞ for short. Indeed, we have also confirmed that as k rises in Krusell and Smith’s test, the forecast errors approach the errors in Den Haan’s test. (This is also consistent with results reported in Den Haan’s study.) For each state variable xt and forecast b xt , Den Haan (2010) suggests reporting the standard deviation of the forecast error jðxt 2 b xt Þ scaled by the standard deviation of the state variable j(xt). Note that this measure is equivalent to reporting the R 2, because the R 2 is defined as 1 2 ½jðxt 2 b xt Þ2 =jðxt Þ2 �. This definition of 2 R works for any k, including the one-period-ahead R 2 discussed above and reported in column 1 of table A2. In column 2 we report the R 2 statistics from the procedure suggested by Den Haan (k 5 ∞). These R 2 statistics are somewhat lower but still relatively high, with the lowest occurring for the equation for the aggregate capital, A, equal to .947. Note that the results above are all based on in-sample calculations because the forecasting coefficients and the forecast errors are computed on time series with the same sequence of aggregate shocks. Den Haan (2010) suggests doing the same experiments on simulated data with an alternative sequence of aggregate shocks. To do so, we start with the coefficients computed from simulating our actual model. We then simulate an alternative sequence of aggregate shocks to construct a time series of forecasted state variables b xt using these forecast coefficients A–D. We use the same alternative sequence of aggregate shocks to simulate our actual model with 100,000 agents to construct a time series of state variables xt. We report these errors in column 3. The R 2 statistics do fall some but are still relatively close to those in column 3. The lowest is again for the capital equation, now equal to .931 when using out-of-sample data. Because we are computing a bounded rationality equilibrium, it is expected that forecasts are imperfect. It is not surprising therefore that the R 2’s are not unity. There is no accepted cutoff in the literature. For example, Den Haan (2010, 81) writes that “accuracy tests can also be too strong in the sense that solutions that are close to the true solution in most important aspects are still rejected by the accuracy test.” The forecasting tests discussed above check how close our bounded rational equilibrium is to a fully rational equilibrium, along the forecasting dimensions described. As another test of numerical accuracy, one can check whether the Euler equation errors are close to zero. This test is inappropriate for most of the agents in our model, since these agents are constrained often over their lifetime, and by definition their Euler equations do not hold with equality. (Recall that households face fixed stock market participation costs, moving costs, a collateral constraint, and a wedge between the lending and borrowing rates.) We can, however, identify a subset of agents in our model who are likely to be unconstrained, namely, the wealthy bequesters who have a strong preference for saving. For these
housing wealth, housing finance, and limited risk sharing
219
agents, the stock market participation and moving costs are relatively small, while the collateral constraint is rarely binding. The wedge between borrowing and lending rates may still be binding, in which case households will invest 100 percent of their portfolio in the stock market but will not lever up. Under these conditions, it can be shown that the Euler equation should hold for these households with the equity return, as well as with their net portfolio return (but not for the risk-free rate). These Euler equation errors are reported in table A3. They are all sufficiently small. We have also experimented extensively with grid sizes to confirm that our results are not sensitive to grid size. Unfortunately, owing to the size of the state space, we are unable to simultaneously raise all grid sizes. However, we have resolved the model with (i) the grids for individual financial wealth and housing both doubled in size from 35 and 16 to 70 and 32 points, respectively; and (ii) the grids for aggregate capital and aggregate housing increased from 4 to 5 points, and for house prices from 4 to 6 points, while at the same time the upper and lower bounds of the grids are brought closer to the model’s simulated data so that the intervals in the capital, housing, and house price grids are reduced to 28 percent, 28 percent, and 60 percent of the original size, respectively. In all cases the aggregate quantities and prices look very similar to those reported in the text. We close this section by noting an important caution about these numerical checks. The model we are solving has a bounded rationality equilibrium, while the numerical checks are aimed at evaluating whether the model solution is consistent with the fully rational one. This incongruity between the numerical checks and the model environment is compounded by the complexity of the framework: when a very large number of agents face an infinite-dimensional state space, the fully rational equilibrium is not computable and the degree of departure from the fully rational equilibrium is unknowable. The fully rational equilibrium may not be a reasonable one with which to compare a model. The cost in terms of the agent’s objectives of computing the fully rational policy could in principle be infinite, so that no expenditure of resources on computing better policies would be economically optimal for an agent. Although the numerical checks conducted here suggest that—for the aspects of the model evaluated by the checks—our equilibrium is close to what would be implied by a fully rational one, the fundamental question of how closely our equilibrium policies and prices correspond to those of the fully rational one cannot ultimately be answered. We simply conclude with a caution. As we address issues of contemporary economic importance, we would do well to acknowledge the enormous complexity of real-world prob-
TABLE A3 Euler Equation Errors Euler Equation E[M � R e 2 1] (%) E[M � R p 2 1] (%)
Model 1
Model 2
Model 3
2.1 2.3
.3 .2
.2 .1
Note.—This table reports the Euler equation errors for bequesters whose portfolio weight in bonds is between 0 percent and 100 percent (this includes most of the bequesters). We report the errors for models 1, 2, and 3 for the return on equity and the net return on the portfolio.
220
journal of political economy
lems economic players face and the possibility that the fully rational outcome is an unattainable theoretical construct appropriate only in unrealistically simplistic environments.
References Aiyagari, S. Rao, and Mark Gertler. 1991. “Asset Returns with Transactions Costs and Uninsurable Individual Risk.” J. Monetary Econ. 27:311–31. Basak, Suleyman, and Domenico Cuoco. 1998. “An Equilibrium Model with Restricted Stock Market Participation.” Rev. Financial Studies 11 (2): 309–41. Benninga, Simon, and Aris Protopapadakis. 1990. “Leverage, Time Preference and the Equity Premium Puzzle.” J. Monetary Econ. 25:49–58. Bernanke, Ben S. 2005. “The Global Saving Glut and the U.S. Current Account Deficit.” Remarks at the Sandridge Lecture, Virginia Assoc. Econ., Richmond, March 10. ———. 2008. “Remarks on the Economic Outlook.” Remarks at the Internat. Monetary Conference, Barcelona, June 3. Berndt, Antje, Burton Hollifield, and Patrik Sandas. 2010. “The Role of Mortgage Brokers in the Subprime Crisis.” Working Paper no. 16175 ( July), NBER, Cambridge, MA. Boldrin, Michele, Lawrence J. Christiano, and Jonas D. M. Fisher. 2001. “Habit Persistence, Asset Returns, and the Business Cycle.” A.E.R. 91 (1): 149–66. Campbell, Jeffrey R., and Zvi Hercowitz. 2006. “The Role of Collateralized Household Debt in Macroeconomic Stabilization.” http://www.tau.ac.il/~zvih/pdf /CampbellHercowitz06.pdf. Campbell, John Y., and Joao F. Cocco. 2007. “How Do House Prices Affect Consumption? Evidence from Micro Data.” J. Monetary Econ. 54:591–621. Campbell, John Y., and Robert J. Shiller. 1989. “The Dividend-Price Ratio and Expectations of Future Dividends and Discount Factors.” Rev. Financial Studies 1 (3): 195–228. Campbell, Sean D., Morris A. Davis, Joshua Gallin, and Robert F. Martin. 2009. “What Moves Housing Markets: A Variance Decomposition of the Rent-Price Ratio.” J. Urban Econ. 66 (2): 90–102. Carceles-Poveda, Eva, and Danielle Coen-Pirani. 2010. “Owning Capital or Being Shareholders: An Equivalence Result with Incomplete Markets.” Rev. Econ. Dynamics 13 (3): 537–58. Cochrane, John H. 2005. Asset Pricing. Rev. ed. Princeton, NJ: Princeton Univ. Press. ———. 2011. “Presidential Address: Discount Rates.” J. Finance 66 (4): 1047–1108. Corbae, Dean, and Erwan Quintin. 2010. “Mortgage Innovation and the Foreclosure Boom.” http://erwan.marginalq.com/index_files/wp_files/dean.pdf. Davis, Morris A., and Jonathan Heathcote. 2005. “Housing and the Business Cycle.” Internat. Econ. Rev. 46 (3): 751–84. Davis, Morris A., and François Ortalo-Magne. 2011. “Household Expenditures, Wages, Rents.” Rev. Econ. Dynamics 14 (2): 248–61. Demyanyk, Yuliya, and Otto Van Hemert. 2011. “Understanding the Subprime Mortgage Crisis.” Rev. Financial Studies 24 (6): 1848–80. Den Haan, W. J. 2010. “Assessing the Accuracy of the Aggregate Law of Motion in Models with Heterogeneous Agents.” J. Econ. Dynamics and Control 34 (1): 79–99. Favilukis, Jack. 2013. “Wealth Inequality, Stock Market Participation, and the Equity Premium.” J. Financial Econ. 107 (3): 740–59.
housing wealth, housing finance, and limited risk sharing
221
Favilukis, Jack, David Kohn, Sydney C. Ludvigson, and Stijn Van Nieuwerburgh. 2013. “International Capital Flows and House Prices: Theory and Evidence.” In Housing and the Financial Crisis, edited by Edward L. Glaeser and Todd Sinai, 235–99. Chicago: Univ. Chicago Press. Favilukis, Jack, Sydney C. Ludvigson, and Stijn Van Nieuwerburgh. 2010. “The Macroeconomic Effects of Housing Wealth, Housing Finance, and Limited Risk-Sharing in General Equilibrium.” Working Paper no. 15988 (May), NBER, Cambridge, MA. FDIC (Federal Deposit Insurance Corporation). 2006. “Breaking New Ground in U.S. Mortgage Lending.” FDIC Outlook, December 18. http://www.fdic.gov /bank/analytical/regional/ro20062q/na/2006_summer04.html#10A. Fernández-Villaverde, Jesús, and Dirk Krueger. 2011. “Consumption and Saving over the Life Cycle: How Important Are Consumer Durables?” Macroeconomic Dynamics 15 (5): 725–70. Flavin, Marjorie A., and Takashi Yamashita. 2002. “Owner-Occupied Housing and the Composition of the Household Portfolio.” A.E.R. 92 (1): 345–62. Geanakoplos, John. 2011. “What’s Missing from Macroeconomics: Endogenous Leverage and Default.” Cowles Foundation Paper no. 1332, Yale Univ. Glaeser, Edward L., Joshua D. Gottlieb, and Joseph Gyourko. 2013. “Can Cheap Credit Explain the Housing Boom?” In Housing and the Financial Crisis, edited by Edward L. Glaeser and Todd Sinai, 301–59. Chicago: Univ. Chicago Press. Glaeser, Edward L., Joseph Gyourko, and Raven Saks. 2005. “Why Have Housing Prices Gone Up?” A.E.R. Papers and Proc. 95 (2): 329–33. Gomes, Francisco, and Alexander Michaelides. 2008. “Asset Pricing with Limited Risk Sharing and Heterogeneous Agents.” Rev. Financial Studies 21 (1): 415–48. Green, Richard K., and Susan M. Wachter. 2008. “The Housing Finance Revolution.” In Housing, Housing Finance, and Monetary Policy, 21–67. Kansas City: Fed. Reserve Bank. Greenspan, Alan, and James Kennedy. 2005. “Estimates of Home Mortgage Originations, Repayments, and Debt on One-to-Four-Family Residences.” Working Paper no. 2005-41 (September), Finance and Econ. Discussion Series, Fed. Reserve Board, Washington, DC. ———. 2008. “Sources and Uses of Equity Extracted from Homes.” Oxford Rev. Econ. Policy 24 (1): 120–44. Gyourko, Joseph, Christopher Mayer, and Todd Sinai. 2013. “Superstar Cities.” American Econ. J.: Econ. Policy 5 (4): 167–99. Hansen, Gary D. 1985. “Indivisible Labor and the Business Cycle.” J. Monetary Econ. 16:309–27. Heathcote, Jonathan, Fabrizio Perri, and Giovanni L. Violante. 2010. “Unequal We Stand: An Empirical Analysis of Economic Inequality in the United States: 1967–2006.” Rev. Econ. Dynamics 13 (1): 15–51. Heaton, John, and Deborah Lucas. 1996. “Evaluating the Effects of Incomplete Markets on Risk Sharing and Asset Pricing.” J.P.E. 104 (3): 443–87. Hodrick, Robert, and Edward C. Prescott. 1997. “Post-war U.S. Business Cycles: A Descriptive Empirical Investigation.” J. Money, Credit, and Banking 29 (1): 1–16. Iacoviello, Matteo. 2005. “House Prices, Borrowing Constraints, and Monetary Policy over the Business Cycle.” A.E.R. 95 (3): 739–64. Iacoviello, Matteo, and Marina Pavan. 2013. “Housing and Debt over the Life Cycle and over the Business Cycle.” J. Monetary Econ. 60 (2): 221–38. Jermann, Urban. 1998. “Asset Pricing in Production Economies.” J. Monetary Econ. 41 (2): 257–75.
222
journal of political economy
Kahn, James A. 2008. “What Drives Housing Prices?” Staff Report no. 345 (September), Fed. Reserve Bank New York. Kiyotaki, Nobuhiro, Alexander Michaelides, and Kalin Nikolov. 2011. “Winners and Losers in Housing Markets.” J. Money, Credit, and Banking 43 (2–3): 255–96. Kohn, Donald L. 2002. “Panel: Implications of Declining Treasury Debt: What Should the Federal Reserve Do as Treasury Debt Is Repaid?” J. Money, Credit, and Banking 34 (3): 941–45. Krainer, John, Stephen F. LeRoy, and O. Munpyung. 2009. “Mortgage Default and Mortgage Valuation.” Working Paper no. 2009-20 (November), Fed. Reserve Bank San Francisco. Krishnamurthy, Arvind, and Annette Vissing - Jorgensen. 2007. “The Demand for Treasury Debt.” Working Paper no. 12881 ( January), NBER, Cambridge, MA. Krueger, Dirk, and Fabrizio Perri. 2006. “Does Income Inequality Lead to Consumption Inequality? Evidence and Theory.” Rev. Econ. Studies 73:163–93. Krusell, Per, and Anthony A. Smith Jr. 1998. “Income and Wealth Heterogeneity in the Macroeconomy.” J.P.E. 106 (5): 867–96. ———. 1999. “On the Welfare Effects of Eliminating Business Cycles.” Rev. Econ. Dynamics 2:245–72. Kydland, Finn, and Edward C. Prescott. 1982. “Time to Build and Aggregate Fluctuations.” Econometrica 50:343–60. Landvoigt, Tim, Monika Piazzesi, and Martin Schneider. 2015. “The Housing Market(s) of San Diego.” A.E.R. 105 (4): 1371–1407. Lee, Donghoon, Christopher Mayer, and Joseph Tracy. 2012. “A New Look at Second Liens.” Working Paper no. 18269 (August), NBER, Cambridge, MA. Lettau, Martin, and Sydney C. Ludvigson. 2010. “Measuring and Modeling Variation in the Risk-Return Tradeoff.” In Handbook of Financial Econometrics, vol. 1, edited by Yacine Ait-Sahalia and Lars Peter Hansen, 617–90. Amsterdam: Elsevier Sci. Lettau, Martin, and Stijn Van Nieuwerburgh. 2008. “Reconciling the Return Predictability Evidence: In-Sample Forecasts, Out-of-Sample Forecasts, and Parameter Instability.” Rev. Financial Studies 21 (4): 1607–52. Liu, Zheng, Pengfei Wang, and Tao Zha. 2013. “Land-Price Dynamics and Macroeconomic Fluctuations.” Econometrica 81 (3): 1147–84. Lucas, Deborah J. 1994. “Asset Pricing with Undiversifiable Income Risk and Short Sales Constraints: Deepening the Equity Premium Puzzle.” J. Monetary Econ. 34 (3): 325–41. Lum, Sherlene K. S., and Robert E. Yuskavage. 1997. “Gross Product by Industry, 1947–96.” Survey Current Bus. (November): 20–34. http://www.bea.gov/scb /account_articles/national/1197gpo/maintext.htm. Lustig, Hanno, and Stijn Van Nieuwerburgh. 2005. “Housing Collateral, Consumption Insurance and Risk Premia: An Empirical Perspective.” J. Finance 60 (3): 1167–1219. ———. 2006. “Can Housing Collateral Explain Long-Run Swings in Asset Returns?” Working Paper no. 12766 (December), NBER, Cambridge, MA. ———. 2010. “How Much Does Household Collateral Constrain Regional Risk Sharing?” Rev. Econ. Dynamics 13 (2): 265–94. Luttmer, Erzo G. J. 1999. “What Level of Fixed Costs Can Reconcile Consumption and Stock Returns?” J.P.E. 107 (5): 969–97. McCarthy, Jonathan, and Charles Steindel. 2007. “Housing Activity and Consumer Spending.” Bus. Econ. 42:6–21. Mian, Atif, and Amir Sufi. 2009. “The Consequences of Mortgage Expansion: Evidence from the U.S. Mortgage Default Crisis.” Q. J.E. 124 (4): 1449–96.
housing wealth, housing finance, and limited risk sharing
223
Ortalo-Magné, François, and Sven Rady. 2006. “Housing Market Dynamics: On the Contribution of Income Shocks and Credit Constraints.” Rev. Econ. Studies 74:459–85. Peristiani, Stavros, Paul Bennett, Gordon Monsen, Richard Peach, and Jonathan Raiff. 1997. “Credit, Equity, and Mortgage Refinancings.” Fed. Reserve Bank New York Econ. Policy Rev. 3 (2): 83–99. Peterson, Brian. 2002. “Aggregate Uncertainty, Individual Uncertainty, and the Housing Market.” http://depts.washington.edu/sce2003/Papers/178.pdf. Piazzesi, Monika, and Martin Schneider. 2012. “Inflation and the Price of Real Assets.” http://www.stanford.edu/~piazzesi/inflationAP.pdf. Piazzesi, Monika, Martin Schneider, and Selale Tuzel. 2007. “Housing, Consumption, and Asset Pricing.” J. Financial Econ. 83:531–69. Piskorski, Tomasz, and Alexei Tchistyi. 2011. “Stochastic House Appreciation and Optimal Mortgage Lending.” Rev. Financial Studies 24 (5): 1407–46. Ríos-Rull, José-Víctor, and Virginia Sánchez-Marcos. 2008. “An Aggregate Economy with Different Size Houses.” J. European Econ. Assoc. 6 (2–3): 705–14. Sinai, Todd, and Nicholas S. Souleles. 2005. “Owner-Occupied Housing as a Hedge against Rent Risk.” Q. J.E. 120 (2): 763–89. Skinner, Jonathan, and Stephen P. Zeldes. 2002. “The Importance of Bequests and Life-Cycle Saving in Capital Accumulation: A New Answer.” A.E.R. 92 (2): 97–112. Sommer, Kamila, Paul Sullivan, and Randal Verbrugge. 2013. “The Equilibrium Effect of Fundamentals on House Prices and Rents.” J. Monetary Econ. 60:854– 70. Stiglitz, Joseph E. 2010. Freefall: American Free Markets and the Sinking of the World Economy. New York: Norton. Stokey, Nancy L. 2009. “Moving Costs, Nondurable Consumption and Portfolio Choice.” J. Econ. Theory 144 (6): 2419–39. Storesletten, Kjetil, Chris I. Telmer, and Amir Yaron. 2004a. “Consumption and Risk Sharing over the Life Cycle.” J. Monetary Econ. 51 (3): 609–33. ———. 2004b. “Cyclical Dynamics in Idiosyncratic Labor Market Risk.” J.P.E. 112 (3): 695–717. ———. 2007. “Asset Pricing with Idiosyncratic Risk and Overlapping Generations.” Rev. Econ. Dynamics 10 (4): 519–48. Streitfeld, David. 2009. “Tight Mortgage Rules Exclude Even Good Risks.” New York Times, July 11. Strongin, Steven, Jim O’Neill, Charles Himmelberg, Amanda Hindian, and Sandra Lawson. 2009. “Effective Regulation: Part 1: Avoiding Another Meltdown.” Global Markets Inst. Res. Paper, Goldman Sachs, New York. Telmer, Chris I. 1993. “Asset-Pricing Puzzles and Incomplete Markets.” J. Finance 48:1803–32. Titman, Sheridan. 1982. “The Effects of Anticipated Inflation on Housing Market Equilibrium.” J. Finance 37 (3): 827–42. Tuzel, Selale. 2010. “Corporate Real Estate Holdings and the Cross-Section of Stock Returns.” Rev. Financial Studies 23 (6): 2268–2302. Vissing-Jorgensen, Annette. 2002. “Towards an Explanation of Household Portfolio Choice Heterogeneity: Nonfinancial Income and Participation Cost Structures.” Working Paper no. 8884 (April), NBER, Cambridge, MA. Zimmerman, Thomas. 2007. “How Did We Get Here and What Lies Ahead.” Lunch and Learn (April 16), UBS, New York.