Testing Str(ltegie'Sl(i~is' .' ~
~ _,
,,,.,,
~
,
-",
.\:
"
't ~
THE SLOW MODULAR APPROACH
The aim of this series of Modules is gradually to introduce into the examination questions that will encourage a balanced range of classroom activities. It is particularly concerned with those activities highlighted by the Cockcroft Report: problem solving, practical mathematics, discussion and open investigation. A few new mathematical techniques may occasionally be introduced, but the main concern is to broaden the range of skills developed to include those strategic skills which are essential if pupils are to be able to deploy their technical skills when tackling unfamiliar problems both in and outside mathematics. Each Module will contain three elements: Specimen examinations questions, with sample answers (not model answers) and marking schemes, and an accompanying explanation of the scope of the Module. Classroom Materials worksheets.
which offer detailed
teaching
suggestions
and pupil
Support Materials which provide ways in which teachers, either individually or in collaboration with colleagues, can develop their teaching styles and explore the wider implications of the Module. The Materials include the use of video and microcomputer software resources which are included as part of the pack. Each of these elements is developed by Shell Centre for Mathematical Education working with groups of teachers under the overall direction of the Board. Before adoption, each Module is tested with pupils and teachers representative of the wide spectrum who take the Board's examinations to ensure that this new material is accessible to both teachers and pupils, and that their success on the new question is fully comparable with that on other questions on the paper. The material is also required to be enjoyable and interesting to those concerned. This book presents the second examination Module. We shall be seeking further systematic feedback on its use; however all comments based on experience with the Module are welcomed by the Shell Centre.
11~~in~llll~il~1111 N15820
The Language of Functions and Graphs
An Examination Module for Secondary Schools
Joint Matriculation Board Shell Centre for Mathematical
Education
AUTHORS
AND ACKNOWLEDGEMENTS
This Module has been produced by the joint efforts of many teachers working with the Shell Centre for Mathematical Education and the Joint Matriculation Board. It was developed as part of the Testing Strategic Skills programme which aims gradually to promote a balanced range of curriculum activities through the development of new examination questions. The Module is based on classroom research and teaching materials by: Malcolm Swan with help from Alan Bell, Hugh Burkhardt I t was produced
and Claude Janvier.
by the Shell Centre team:
Alan Bell, Barbara Binns, Gard Brekke, Hugh Burkhardt, Rita Crust, Rosemary Fraser, John Gillespie, Kevin Mansell, Richard Phillips, Andy Pierson, Jim Ridgway, Malcolm Swan and Clare Trott, co-ordinated
by Clare Trott, and directed by Hugh Burkhardt.
Specific responsibility
for the three sections of the book was as follows:
Specimen Examination Questions:
John Pitts
Classroom Materials:
Malcolm Swan
Support Materials:
Rosemary Fraser
This material has been developed and tested with teachers and pupils in over 30 schools, to all of whom we are indebted, with structured classroom observation by the Shell Centre team. These teachers include: Paul Bray, Paul Davison, Tansy Hardy, Anne Haworth, David Kaye, Steve Maddern, John Mills, Geoff Orme, John Rose, Chris Smith, Nick Steen, Aileen Stevens, Jon Stratford, Glenda Taylor and Alan Tizard. We gratefully acknowledge the help we have received from: * Paul Morby and the University of Birmingham Television and Film Unit in the making of the video material.
* The ITMA collaboration John in the development
at the Shell Centre and the College of St. Mark and 5t. of the microcomputer programs.
* Peter Wilson and his colleagues at the Joint Matriculation the staff of Richard Bates Ltd, in the preparation
Board, together with of this Module.
* Sheila Dwyer and Jenny Payne for much typing and even more patient support.
* Douglas
Barnes, Trevor Kerry, David Fielker and Clive Sutton in granting us permission to reproduce extracts from their books.
* John Doyle (Automobile
Association), Alan Heywood (Ffestiniog Railway), and Geraldine Mansell (Consumer's Association) in allowing us to reproduce data from their publications.
This book was designed,
edited and illustrated by Malcolm Swan.
2
The ~Language of Functions. and Graphs ....•.. -
-,
CONTENTS
Introduction
6
to the Module
9
Specimen Examination Questions
59
Classroom Materials
201
Support Materials
An expanded
version of the contents follows on the next page ...
3
EXPANDED CONTENTS
Introduction
to the Module
6
Specimen Examination Questions
9
Each of these questions is accompanied by afull marking scheme, illustrated with sample scripts. Contents Introduction "The journey" "Camping" "Going to school" "The vending machine" "The hurdles race" "The cassette tape" "Filling a swimming pool"
10 11 12 20 28 38 42 46 52
Classroom Materials
59
Introduction
60
to the Classroom Materials
Unit A
This unit involves sketching and interpreting graphs arising from situations which are presented verbally or pictorially. No algebraic knowledge is required. Emphasis is laid on the interpretation of global graphical features, such as maxima, minima, intervals and gradients. This Unit will occupy about two weeks and it contains afull set of worksheets and teaching notes. Contents Introduction Al "Interpreting points" A2 " Are graphs just pictures?" A3 "Sketching graphs from words" A4 "Sketching graphs from pictures" A5 "Looking at gradients" Supplementary booklets
62 63 64 74 82 88 94 99
UnitB
In this Unit, emphasis is laid on the process of searching for patterns within realistic situations, identifying functional relationships and expressing these in verbal, graphical and algebraic terms. Full teaching notes and solutions are provided. This Unit again occupies approximately two weeks. Contents Introduction B1 "Sketching graphs from tables" B2 "Finding functions in situations" B3 "Looking at exponential functions" B4 "A function with several variables" Supplementary booklets 4
108 109 110 116 120 126 130
A Problem Collection This collection supplements the material presented in Units A and B. It is divided into two sections. The first contains nine challenging problems accompanied by separate selections of hints which may be supplied to pupils in difficulty. The second section contains a number of shorter situations which provide more straighforward practice at interpreting data. This material provides a useful resource which may be dipped into from time to time as is felt appropriate. Solutions have only been provided for the nine problems.
142 143 144 146 150 154 158 164 170 174 178 182
Contents Introduction Problems: "Designing a water tank" "The point of no return" "'Warmsnug' double glazing" "Producing a magazine" "The Ffestiniog railway" "Carbon dating" "Designing a can" "Manufacturing a computer" "The missing planet"
190 191 192 193 194 195 196 198
Graphs and other data for interpretation: "Feelings" "The traffic survey"
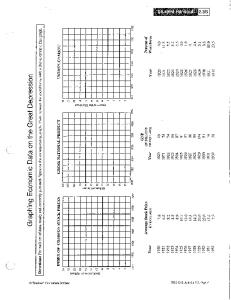
"The motorway journey" "Growth curves" "Road accident statistics" "The harbour tide" " Alcohol"
201
Support Materials These materials are divided into two parts-those that are part of this book, and those that accompany the videotape and microcomputer programs in the rest of the pack. They offer support to individual or groups of teachers who are exploring the ideas contained in this module for the first time. Contents Introduction 1 Tackling a problem in a group. 2 Children's misconceptions and errors. 3 Ways of working in the classroom. 4 How can the micro help? 5 Assessing the examination questions.
202 203 207 211 218 231 234
Inside back cover
Classroom Discussion Checklist
5
INTRODUCTION
TO THE MODULE
This module aims to develop the performance of children in interpreting and using information presented in a variety of familiar mathematical and non-mathematical forms. Many pupils are well acquainted with graphs, tables of numbers, and algebraic expressions and can manipulate them reasonably accurately-but remain quite unable to interpret the global features of the information contained within them. In addition, many pupils are rarely given the opportunity to use mathematical representations autonomously rather than imitatively, to describe situations of interest. Mathematics is a powerful language for describing and analysing many aspects of our economic, physical and social environment. Like any language, it involves learning new symbolic notations, and new 'grammatical rules' by which these symbols may be manipulated. Unfortunately, in mathematics, it is possible to learn these rules without understanding the underlying concepts to which they refer, and this often results in mathematics becoming a formal, dull, and virtually unusable subject. When learning any foreign language, pupils are indeed asked to learn a certain amount of grammar, but they are also given opportunities to express themselves using the language, both orally and through 'free' writing. In a similar way, it is often helpful to set aside the mechanical, grammatical side of mathematical language and spend a few lessons where the emphasis is on using mathematics as a means of communication. Using mathematics in this way requires a wider range of skills than have usually been taught or tested in public examinations, and a greater mastery and fluency in some of those techniques that are already included. This module has been developed to meet some of these needs. The Cockcroft Report* emphasises the need for such skills in many of its recommendations. It also recognises that in order to achieve these aims, a wider range of classroom activity and of teaching style is necessary. Two important instances are in paragraphs 34 and 243: "Most important of all is the need to have sufficient confidence to make effective use of whatever mathematical skill and understanding is possessed, whether this be little or much." '"Mathematics teaching at all levels should include opportunities for: * exposition by the teacher; * discussion between teacher and pupils and between pupils themselves; * appropriate practical work; * consolidation and practice of fundamental skills and routines; * problem solving, including the application of mathematics to everyday situations; * investigational work."
*Mathematics
Counts, HMSO 1982. 6
In this module,
the emphasis is therefore on:
helping pupils to develop a fluency in using the mathematical language of graphs, tables and algebra in order to describe and analyse situations from the real world. creating a classroom environment which encourages thoughtful discussion as pupils try to comprehend or communicate information presented in a mathematical form. This presents most teachers with some classroom actIvItIes that are relatively unfamiliar. The teaching materials have been designed, and carefully developed in representative classrooms, to guide and to help the teacher in exploring these new demands in a straightforward and gradual way. The Support Materials explore more reflectively what is involved-with the video showing various teachers in action and raising issues for discussion. The microcomputer is there to provide its own powerful support during the absorption of these classroom skills and in other teaching. The list of knowledge and abilities to be tested in the Board's O-level examination include the abilities to understand and translate information between different mathematical and non-mathematical forms, to interpret mathematical results, and to select and apply appropriate techniques to problems in unfamiliar or novel situations. The importance of these skills is also underlined by their prominence in the National Criteria for the General Certificate of Secondary Education. Any GCSE scheme of assessment must test the ability of candidates to:
3.1
recall, apply and interpret mathematical situations;
3.3
organise, interpret and present information graphical and diagrammatic forms;
3.7
estimate, context;
approximate
3.10
interpret, expressed
transform and make appropriate in words or symbols;
3.14 3.15
make logical deductions from given mathematical
3.16
respond orally to questions about rnathematics, and carry out mental calculations.
knowledge in the context of everyday accurately in written,
tabular,
and work to degrees of accuracy appropriate use of mathematical
to the
statements
data;
respond to a problem relating to a relatively unstructured translating it into an appropriately structured form;
situation
discuss mathematical
by
ideas
The level of performance to be expected in most of these areas is described in the Criteria only in general terms, without even the limited specific illustrations provided for traditional content areas. This reflects the general lack of experience in existing examinations in assessing such skills. This module illustrates how they o1ay be examined and how teachers may prepare pupils for such questions-the research and development effort has gone into ensuring that all the elements work well with pupils and teachers representative of those who take the Board's examinations. In view of the coming of the GCSE, many of the materials (Unit A in particul~r) have been
7
designed to be suitable also for pupils of average ability; somewhat different examination tasks will be needed in this context, and suitable questions are being developed and tested.
8
Specimen Examination Questions
9
~p~ecilJlen-EXaJniriation~Ojiesti~1!S,·'_ ~,~~.'. ~ ~ ~ --
-
-
-
,-
-
-
-
-
--
-
".:-'
-
---
-"
-
-
-
--
CONTENTS
11
Introduction Questions
The journey
12
Camping
20
Going to school
28
The vending machine
38
The hurdles race
42
The cassette tape
46
Filling a swimming pool
52
10
INTRODUCTION These specimen questions indicate the range of questions that is likely to be asked. The questions actually set rnay be expected to differ from those given here to about the same extent as they differ from each other. The marking schemes are designed to give credit for the effective display of some of the following skills: 1.
Interpreting
mathematical
representations*
2.
Translating
words or pictures into mathematical
3.
Translating
between mathematical
representations.
4.
Describing
functional relationships
using words or pictures.
5.
Combining information where appropriate.
6.
Using mathematical situations.
7.
Describing
presented
using words or pictures. representations.
in various ways, and drawing inferences
representations
to solve problems
arising from realistic
or explaining the methods used and the results obtained.
The sample answers which follow the questions are intended to illustrate various aspects of the marking scheme. The number of marks awarded for each question varies according to its length but, as a guideline, a question worth 15 marks should occupy about 20 minutes of examination time.
'By 'mathematical
representations'
we mean information
presented graphically.
11
algebraically.
or in tabular form.
THE JOURNEY The map and the graph below describe a car journey Crawley using the Ml and M23 motorways.
NOTTINGHAM
from Nottingham
to
150 -+----+---+~-+-_+-----+_+___+_/-r+-F
"l.--I'E
0/ Distance (miles)
100
+-----+--+-------i--+-+-/--+---+------1~-t_
V
Ml
/
Vc
B 50
/
-+---+-__.I<--+-----+-+----+---+---+-__+_
/
v /
LONDON A
/
IL-V----L_-t---J----+_.L--+----'-~t_
o ~ M23
2
3
Time (hours)
CRAWLEY ~
(i) Describe each stage of the journey, making use of the graph and the map. In particular describe and explain what is happening froln A to B; B to C; C to D; D to E and E to F. (ii) Using the information given above, sketch a graph to show how the speed of the car varies during the journey. 80 -
60
Speed (mph) 40
20
I
o
I
,
I
2
3
4
Time (hours)
12
THE JOURNEY (i)
... MARKING SCHEME
Interpreting mathematical representations using words and combining information to draw inferences. Journey from A to B
Journey from B to C
Journey from C to D
Journey from D to E
'Travelling on the M 1'
1 mark
'Travelling at 60 mph' (:± 5 mph) or 'Travels 60 miles in one hour'
1 mark
'Stops' or 'At a service station' or 'In a traffic jam' or equivalent
1 mark
'Travelling on the motorway'
1 mark
'Travelling at the same speed as before' or 'Travelling at 60 mph (:± 5 mph) or 'Travels 50 miles in 50 minutes' (:± 5 mins.)
1 mark
'Travelling through London'
1 mark
'Speed fluctuates', or equivalent. eg: 'there are lots oftraffic lights'. Do not accept 'car slows down'. Journey from E to F
(ii)
Translating
'Travelling on the motorway' or 'Travelling from London to Crawley'.
into and between mathematical
1 mark
1 mark
representations.
F or the general shape of the graph award:
1 mark
if the first section of the graph shows a speed of 60 mph (± 10 mph) reducing to 0 mph.
1 mark
if the final section of the graph shows that the speed increases to 60 mph (± 10 mph) then decreases to 20 mph (± 10 mph) and then increases again.
For more detailed aspects, award:
1 mark
if the speed for section AB is shown as 60 mph and the speed for section CD is shown as 60 mph (± 5 mph).
1 mark
if the changes in speed at 1 hour and 11/2 hours are represented by (near) vertical lines.
1 mark
if the stop is correctly represented
1 mark
if the speed through London is shown as anything from 20 mph to 26 mph or is shown as fluctuating.
1 mark
if the graph is correct in all other respects.
A total of 15 marks are available for this question. 13
from 1 hour to 1112 hours.
Jayne
=-
A ~B
g::> a l~
1-1~ ~e
h~
For
+0
;=a
0uJ
~L.L.Y
r0
~
p --tt-e
v\ .Yo-tA
(Yl~.+1
LcJy-x:j on .
D -3> E::==Wou -:slo"" E -3> ~
(Y)L
hole:--
Pc:>Y
-hrYIe
I u..JICh .
C -> D ::::Yo u -fro t..eJ +-he gel-
on --tt-e
.stc>p~
.:dOLl r
a snarl"
~
o.f"e-
yo-LJ
==- Uou
8-9> C
~
n as ,::j0l.-A 9~-tir>VDLAqh Lcvx::)an· You s~ up Dgo.'I-n on --tt--&.- m C23 -+1/1 you gek -to &-o-wl~ . dow
Sarah
~
~
fu':t>t-"
h-o..ueLt.nd
~
holAf';
~O
I
~Q/l
Cev
~s,~
G~e.n
cJ: hovr d
~
J~
Of(JioX
Z~
frU1~
'>f~~ '3 ~
h
DASJ
tx-~
(j)f
bo mf~ . C\.I\.Q{
rr~
\9..eb..ue-e
thL
'1
~
I~ ~
ver~LA-:J
-(ke..f'-
---::>.
2tclt~.
11 ~
OV\..QJ
CCt.A
r
) .
11-1
DJ\jj
~W
Ia.Q.{-wQ~
fYlpK
~
~
O(lq~
ttl)
~
(~~
~J
1 ~
co.J
~
MJ..B-).
0..1
4
~C5WS
CLff>rCl-l-
5:> ~h. Philip
/Ik
If ~
~ to
73
~~
;)/-ah
oj
So
M
7D
/'
dolrj
J~~
C
I t1
if
J
CoMkl
~ M
J
r~
u
Am
I-kn.
D,
J;;:,..
IJi -J:,
bP~
iJo1/-!j
C
cd a
~ttcl:J
r
Pr
a.
GAL>fa)-
AruJ'j
-10
/dj CU'- tow: D oJk- / ~ ~ M); hoUJ~ Convnh:J 0 I (0 I1fJt i./-
,1Jo-1f'r
la~ . 14
~!~
j)'~
w~
~
CcmJ>{
A~ol-
I~
Dhf(~~
-IralJdJ.,
Y1a.J
Ur.,iJ
ArJor-. (B) d
J>4~
Jf)
CJh
uk,
cAr
.l'j --Ik /'123 3~
c,.,lJ~ b,
-L
f
~bd-111j /
t-
fiu,.,
CoJl~
]ek ~
oJ
hkt,)
(or
oJ
j)
low d04;A /J
I
; /-
OJ'\
~
':rw~
to
Afet;J
0,
bf&,k
J
<1' ,,)/0(.)-4
(i) Marking
descriptions
Jayne's description depends almost entirely on the map. She does not specify the speed of the car at any stage (although the stop is included). She therefore did not gain the related marks for sections AB, CD and DE. She was awarded 5 marks out of the possible 8.
Sarah's description, in contrast to Jayne's, refers totally to the graph. No reference is made to the Ml, London or the M23. She therefore gains marks only for descriptions of speed forAB, BC, CD and DE. She scored 4 marks out of the possible 8.
Philip has reversed the journey, so that he describes a journey from Crawley to Nottingham. However, although he loses the "map" marks, he does gain "speed" marks for AB (60 mph), BC (zero) and CD (60 mph). So, he scores 3 marks out of the possible 8.
15
Angela
80 Speed
60
(mph) 40
20
o
1
2
3
4
Time (hours)
Theresa
80
Speed (mph)
20
o
1
2
3
Time (hours)
16
4
(ii) Marking
descriptions
General shape Angela has shown a decrease in speed in the first part of her graph from 60 mph to mph. However, in the second part of the graph, although the speed increases and then decreases, it does not increase again. Angela was therefore awarded one of the two possible marks here.
o
Theresa's graph gains both "shape" marks. It decreases from 60 mph to 0 mph, and then correctly increases, decreases and increases again. However, when the graph is marked in detail, she was awarded only one mark (for correctly representing the stop) out of the possible 5.
17
Robert
80
Speed
60 'too-----.,
(mph) 40 ~
20 ~
o
1
2
3
4
Time (hours)
Michael
80
Speed
60
n
(mph) 40 ~ j
20 ~ l
o
1
2 Time (hours)
18
3
4
Detail Robert's graph- was awarded 3 marks out of the possible 5 for detail. These were given for
* * *
AB and CD shown as 60 mph. Near vertical lines at 1 and 1112 hours. The stop shown correctly.
Robert did not obtain the final mark as there was one other error not already penalised-the section CD should be represented from I1J2 to under 21J2 hours, Robert has shown it to be from 1112 to 23/4 hours.
Michael's graph was awarded 4 marks out of the possible 5 for detail. Three were given for
* * *
The stop shown correctly. Near vertical lines at 1 and 11J2 hours. The journey through London shown correctly.
Michael was awarded the fourth mark for having no errors other than those already penalised.
19
CAMPING On their arrival at a campsite, a group of campers are given a piece of string 50 metres long and four flag poles with which they have to mark out a rectangular boundary for their tent. They decide to pitch their tent next to a river as shown below. Thismeans the string has to be used for only three sides of the boundary.
that
(i)
If they decide to make the width of the boundary 20 metres, what will the length of the boundary be?
(ii)
Describe in words, as fully as possible, how the length of the boundary changes as the width increases through all possible values. (Consider both small and large values of the width.)
(iii)
Find the area enclosed by the boundary for a width of 20 metres and for some other different widths.
(iv)
Draw a sketch graph to show how the area enclosed changes as the width of the boundary increases through all possible values. (Consider both small and large values of the width.)
Area Enclosed
Width of the boundary
The campers are interested in finding out what the length and the width of the boundary should be to obtain the greatest possible area. (v)
Describe, width.
in words, a method by which you could find this length and
(vi)
Use the method width.
you have described in part (v) to find this length and
20
CAMPING
... lVIARKING SCHEME
(i) and (ii) Describing
a functional
relationship
using words.
(i)
1 mark
for length
(i i)
3 marks
for' As the width increases from a to 2Sm, the length decreases linearly (uniformly) from Sam to ami.
=
lam.
or for 'As the width increases, at twice the rate'. Part marks:
the length decreases
Give 2 marks for' As the width increases the length decreases linearly (uniformly)' or 2 marks for' As the width increases from am to 2Sm, the length decreases from Sam toOm' or 1 mark for 'As the width increases, length decreases'.
(iii) and (iv) Translating (iii)
information
into a mathematical
(iv)
for area = 200m2•
2 marks
for finding correct areas for three other widths.
2 marks
1 mark for finding correct areas for two other widths.
for a sketch graph which shows a continuous a single maximum point. Part mark:
(v) Describing
representation.
1 mark
Part mark:
the
curve with
Give 1 mark for a sketch graph which is wholly or partly straight or consists of discrete points, but shows that the area increases and then decreases.
the method to be used in solving a problem. 3 marks
for a clear and complete to find both dimensions. Part mark:
description
of how
Give 2 marks for a clear and complete description of how to find only one of the dimensions. Give 1 mark if the explanation but apparently correct.
(vi) Using mathematical 2 marks
representations for 'width Part mark:
is not clear
to solve a problem.
= 12.Sm for maximum area'. Give 1 mark for a width given in the interval 12m < width < 13m. or 1 mark for 'width could be 12m or 13m'.
1 mark
for 'length = 2Sm for maximum area'. (follow through an incorrect width in the interval 12m "S width "S 13m).
A total of 15 marks are available for this question.
21
Julian
ii)
\f lhe ~d.l:h
Jet
IS jflr..n:o.sed
lhen bhe l,erI:;lJ, ~ovld
I~. IF L~e w; di:h OF eo.c.h ~16e 16 ,(1crec, - sed 'b'1 I ffl'Ct re {J-;en &h e f enJcn would be :J. me~tes
shor'ter.
s\,o rt~('.
the.
If-
v); 01 ~
or
l-he \~~~th ~tt-e51
i'" de c.r"eGl~ eel
the
6o~r-dar--4
b'i
on ~
~ouJcl
t"T1
~n
t:1--e ,.,
eh-s
t.~
extr-o.
\...J
Steven
ok tJ-..e
5lo..tB"3
(i;)
~~
Wtli
~t
be- ~
-3eX
dwl
srY'lQll~t lon.j.
tJ.-te- w;d!i.
As ~c.. w;dYc ~J:o
Lo.,,(j~
be-I
~
tJ--.eA
tJne.
th~
len-jH..
srnoJlu.
I.e.. .
wloiH
L f.N(rTt-l
4-3
I~
~o~
10"",
I .J:
Crn ... c..
rY\
15"" llt.-n
-LI
20"""
2"..".,
5~a.\)
Debbie
(\\J
c:9F.5
~~
~~~
~
~~ ~J
~~
CJ..Q:..-t-
~
c-~
... \:::.~
~~~
~
~
c~
~,
~~e-
~~_
c:::::o
~~~
~<2::re
22
\...~~ ~~
Ic~
~ ~~
~'d..~
I (ii) Marking descriptions Julian's description was awarded the full 3 marks. He has correctly described the relationship, including the fact that the length decreases at twice the rate at which the width increases.
I
Steven, by showing values of 1m and 24m for the width, has demonstrated the relationship numerically. He was therefore awarded 2 marks. (He clearly did not consider Om to be a realistic dimension.)
Debbie has simply stated that as the width increases the length decreases. For this she was only awarded one mark.
23
Catherine
Andrew
Emma
(V) To S ;()cL thVi, l.v-.~t:h t:he.. ~~b Then I ~tAA.CL S:",c::J.-
po~b
x
z ~
u...u.:,eU:h CUloL Jo\\~
\\ Vu-Ou..Lc:L Ib ol..cLJ...u\
CtK'lo'-
-
So
JrofYI
lex:>k. ,0"
be
S-'()oL
rn'::i Cj ~h <::0 the... ~olL-1,.
.
Katherine
F=t::>: ....• \-.
~ ~
24
~k
-...;)·\d~ ~J--~
~~
..
II-
~~
i~
(iv)
lYfarking sketch graphs
Catherine's sketch clearly shows a single maximum point, while Andrew's sketch is made up of several straight lines, although showing the area to increase then decrease. Catherine was therefore awarded one mark.
(v)
awarded both marks for her sketch graph while Andrew was
Marking descriptions
Emma's answer to part (v) clearly describes the method she will use to find both the width and the length corresponding to the maximum area. She was awarded the full 3 marks. Katherine's answer, however, only describes a method for finding the width. She was therefore only awarded 2 marks out of the possible 3.
25
Karen
A -
W
2G \-:L
¢
L
'"LbO I
2
'5
3\2
~r._
~L;.
X \3 '2--lt°
:72312
26
(vi)
Marking the numerical answers
Karen has calculated the area obtained for widths of 12m and 13m, and has given both in her answer to part (vi). For this she was awarded 1 mark and she also scored 1 mark for correctly giving the corresponding lengths. Karen was therefore awarded a total of 2 marks out of the possible 3 for the numerical answers.
27
GOING TO SCHOOL
o I
2
3
I
I
Graham
Scale (miles)
~
•
V!
•
Jane
Paul
•
Susan
•
Peter
Jane, Graham, Susan, Paul and Peter all travel to school along the same country road every morning. Peter goes in his dad's car, Jane cycles and Susan walks. The other two children vary how they travel from day to day. The map above shows where each person lives. The following graph describes each pupil's journey to school last Monday.
6
Length of journey to school (miles)
•
•
•
4
2-
•
• o
I
20
40
Time taken to travel to school (minutes)
i)
Label each point on the graph with the name of the person it represents.
ii)
How did Paul and Graham travel to school on Monday?
iii)
Describe
how you arrived at your answer to part (ii) -
_
_
(continued)
28
GOING TO SCHOOL (continued)
iv)
Peter's father is able to drive at 30 mph on the straight sections of the road, but he has to slow down for the corners. Sketch a graph on the axes below to show how the car's speed varies along the route.
Peter's journey to School
30 Car's Speed
20
(mph) 10-
o
I
3
1 Distance
29
4
from Peter's home (miles)
6
GOING TO SCHOOL ... MARKING SCHEME. (i)
Combining information presented pictorially and verbally, and translating into a mathematical representation.
6
•
•
Jane
Peter Length of journey to school (miles)
•
4
Paul
•
•
2
Susan
Graham I
0
20
40
Time taken to travel to school (minutes)
1 mark 1 mark 1 mark 1 mark
(ii)
if Paul is correctly placed. if Peter and Jane are shown at 6 miles. if Graham and Susan are shown at 2 miles. if Peter and Jane are correctly placed or if Graham and Susan are correctly placed.
1 mark
if the diagram is completely correct.
Combining
information
presented in various ways and drawing inferences.
If Part (i) is correct, then award
2 marks
for 'Paul and Graham cycled' or 'ran' (or used a method faster than walking but slower than a car). Part mark:
If Part (i) is incorrect,
2 marks
1 mark for 'Paul cycled' (or 'ran' etc) or 'Graham cycled' (or 'ran' etc) or 'Paul and Graham used method.'
the
same
then award
if the answers given for both Paul and Graham are consistent with the candidates' diagrams, otherwise give no marks.
30
(iii)
Explaining the methods used in part (ii) if the description of the argument used in part (ii) is clear and complete. (This description must involve speed, or distance and time.)
2 marks
Part
mark:
1 mark for a description complete.
which is not quite
or for a description which is not quite clear but apparently correct, or for any description which mentions speed.
(iv)
Translating information from a pictorial to a graphical representation.
Peter's journey to School
30 Car's speed (mph)
20
10
o
3
2 Distance
4
5
6
from Peter's home (miles)
1 mark
if the graph starts at (0,0) and/or finished at (6,0)
1 mark
if the graph has two minima to correspond
1 mark
if the second minimum point is not higher than 25 mph but is lower than the first minimum point
1 mark
if the distance between the minima is correct (representing approximately)
1 mark
if the speed is shown as 30 mph for at least 1 mile in the middle section and between and 30 mph (inclusive) elsewhere
1 mark
if the graph is correct in all other respects
°
A total of 15 marks are available for this question.
31
to the two bends
3 miles
Kelly 6
Length of journey to school (miles)
•
.J o.N2.
Peter
•
PllJ..{
4
qro.h:tKl
COv.5:Ul
•
•
2
o
40
20
Time taken to travel to school (minutes)
Leigh ~
6
Length of Journey to school (miles)
\f~
•
•
~~\
•
4
~'"
2
c;.r 4>.\'"
•
-.-...
•
o
20
40
Time taken to travel to school (minutes)
Jason p~
6
J~
•
•
Pw.J.
Length of journey to school (miles)
•
4
•
2
S'u~
o
20
.GraJ~
40
Time taken to travel to school (minutes)
32
Marking part (ii) when part (i) is incorrect Kelly's answer to part (ii) looks as though it is correct but it does not correspond to her answer to part (i), so she does not obtain any marks for the answer to part (ii). For part (i) she was awarded 4 marks.
Leigh was awarded 4 marks for his answer to part (i). Paul was correctly placed on Leigh's diagram and therefore the correct deduction would be that Paul did not walk to school. Graham, on the other hand, was placed in such a way that the correct deduction would be that he did walk to school. However, the answers given in part (ii) for both Paul and Graham need to be correct for the marks to be awarded.
Jason was awarded 4 marks for his answer to part (i). In part (ii) the answers for both Paul and Graham correctly reflect the answer given to part (i). Full marks were therefore awarded for part (ii).
33
Jackie
J; ~\ 'SU~
hocl LOa\?ed
\-e.
be. \---cd
~e..
~
\c~
noue ~~
LD<::::lU\d
're ~\d
C.CA'
\\"'1 ~
+ran
Steven
:r:.
~
S""""'~r
~h
c..1
r', .•..•
0.(
p~
1- --tL ~l ~J~"
~:l. J So
-tk
gfY'&-
~iL.r
e.-".S...-..F"
~o
c..J'L
~ ,r. '""?
~o
34
, ~L>
ell
Lu-
1\ """" Of""\.
2.
0..
.rr-eJ'lu . 1~
-r
ho.,V'c..
~~.
~c.~&.
t',AL
~.
wJU..~
S
(iii)
Marking descriptions
It is interesting to compare Steven's answer with Jackie's. Jackie has given a "wordy" description, comparing each boy's journey with the other pupils'. Steven on the other hand, has noted the fact that the points corresponding to Jane, Paul and Graham aU lie on a straight line and so they must have used the same method of transport. However, both descriptions are clear and correct and were awarded the full 2 marks.
35
Joanne 304----Car's speed (mph)
20
10
o
3
2 Distance
4
5
from Peter's home (miles)
Jane 30 Car's speed (mph)
20
10
0
3
2 Distance
4
5
6
from Peter's home (miles)
Stephen 30 Car's speed (mph)
20
10
0 Distance
i
i
i
i
3
4
5
6
5
6
from Peter's home (miles)
Jason 30 Car's speed (mph)
20
10
o
2
3
Distance
4
from Peter's home (miles)
36
,)
(iv)
Marking sketch graphs
Joanne has only shown one bend on her graph. However, one mark was awarded for representing the straight section correctly at 30 mph for at least one mile. The final mark was not awarded since the bend shown took 2 miles to negotiate-a further error. She obtained a total of 1 mark out of the 6 for part (iv).
Jane was awarded 1 mark out of 5 for the specific points relating to the graph (she represented the two bends as two minima). She was also awarded the final mark because all the errors she made relate to the specific points mentioned in the mark scheme and consequently have already been penalised. So, Jane obtained a total of 2 marks out of 6.
Stephen was awarded 3 marks out of 5 for the specific points relating to the graph (showing 2 bends as 2 minima; these being 3 miles apart; and the middle section being 30 mph for at least 1 mile). However, since Stephen has represented the car as slowing down for 1mile in approaching the bends and taking another mile to reach 30 mph again, he was not awarded the final mark. Stephen therefore scored 3 marks out of6.
Jason was similarly awarded 3 marks out of 5 for the specific points relating to the graph. But whereas Stephen did not obtain the final mark, Jason did. If Jason had shown the graph from (0,0) to (6,0) and the second bend more severe than the first, the graph would have been correct. He therefore scored 4 marks out of 6.
37
THE VENDING MACHINE A factory cafeteria contains a vending machine which sells drinks. On a typical day:
* the machine starts half full. * no drinks are sold before 9 am or after 5 pm. * drinks are sold at a slow rate throughout the day, except during the morning and lunch breaks (10.30-11 am and 1-2 pm) when there is greater demand.
* the machine is filled up just before the lunch break. (It takes about 10 minutes to fill). Sketch a graph to show how the number of drinks in the machine might vary from 8 am to 6 pm.
Number of drinks in the machine
8
k
9
10 morning
11
12
1
2
----3I~iE-(----
Time of day
38
3
4
afternoon
5
6
------':II)j
THE VENDING MACHINE ... MARKING SCHEME Translating
words into a mathematical
representation.
1 mark
if the graph is horizontal from 8 am to 9 am and from 5 pm to 6 pm.
1 mark
if the gradient of the graph ~ 0 from 9 am to 12 noon. (Do not accept a zero gradient throughout the period.)
1 mark
if the filling of the machine is represented at some time between 12 noon and 1 pm, and this filling takes not more than 24 minutes (ie, 2 small 'squares' on the graph paper).
1 mark
if the peak of the graph is shown at twice the height of the starting point.
1 mark
if the graph is noticeably steeper from 10.30 am to 11 am and from 1 pm to 2 pm than elsewhere.
1 mark
if the gradient of the graph ~ 0 from 1 pm to 5 pm. (Do not accept a zero gradient throughout the period.)
1 mark
if the graph is correct in all other respects.
A total of 7 marks are available for this question
39
Kevin
Number of drinks in the machine
8
9
10
11
12
2
3
4
6
5
Paul ,r--r++-+-+-++-i--'+-'
i~
i it
j
; i-
Number of drinks in the machine
Time of day
8
9
10
11
12
2
3
4
5
6
8
9
10
11
12
2
3
4
5
6
Cheryl
Number drinks
of
~f..t\
Time of day
40
Marking
the sketch graphs
In Kevin's graph the machine starts dispensing drinks from 8 am so that the representation from 8 am to 9 am is not correct and this mark was lost. He also shows that the machine takes 1 hour to fill and, since this is greater than the permitted 24 minutes given in the mark scheme, another mark was lost. These are the only two errors and so Kevin was awarded 5 out of the possible 7 marks.
In Paul's graph the machine was filled at 11.35 am, which was considered not to be "just before lunch" and so he lost one mark here. He has, however, clearly shown a steeper gradient between 10.30 and 11.00 am and also between 1 pm and 2 pm. He has successfully dealt with the period between 12 noon and 1 pm. He was therefore awarded a total of 6 marks.
Cheryl completely ignored the filling of the machine. She has, however, shown a negative gradient between 9 am and 12 noon and from 2 pm to 5 pm, and also clearly shown the slope to be steeper in the appropriate sections. It should also be noted that on a "typical day" the machine would not finish empty. Cheryl was awarded 3 marks out of the possible 7.
41
THE HURDLES RACE
Ii'
400-
.I ;' ,/ / /
Distance (metres)
----A
/
/
/' I
,-- - -/ .
I
j/""
I
/
--
",," /
-'-'-'-B
"
;,,,;
----------C
/ /
/'
o
I
60
>
Time (seconds)
The rough sketch graph shown above describes what happens when 3 athletes A~ Band C enter a 400 metres hurdles race. Imagine that you are the race commentator. Describe what is happening carefull y as you can . You do not need to measure anything accurately.
42
as
THE HURDLES RACE ... MARKING SCHEME Interpreting a mathematical representation using words. 1 mark
for 'C takes the lead'
1 mark
for 'C stops running'
1 mark
for' B overtakes
1 mark
for 'B wins'
2 marks
for any four of the following:
A'
A and B pass C C starts running again C runs at a slower pace A slows down (or B speeds up) A finishes 2nd (or C finishes last) Part mark:
2 marks
1 mark if any two (or three) of the above points are mentioned.
for a lively commentary Part
mark:
which mentions hurdles.
1 mark for a lively commentary mention hurdles, or for a 'report' hurdles.
A total of 8 marks are available for this question.
43
which does not which mentions
Martin ~f\d
r~
~ tfsr
wEJ(
ISQ
~ltl',e..
g rook.
\;~~rJ-
r~Qso(]G\b~
::J:)VY~(
('e."l--
cov(r~d
Ov'i\d
N\
d~' Co.[MY
D-f\d Co.HI-td
A
Q
let::,/- A Wt(\!- ~:i~e.' r~kl(\ by 6 who beP-f- ~ ofl\d
Second..;
yJe>c5
'rg
Iii
COMIQy O\/~r
(;f',tl\·~.s
1\\'5
~() 6 b~r( sfQpp2.d ~ r
~Qjf-tr 6~vl- tk,\
vJtrJ'
slowlY
aC\
@, Wort /
~\\S~.)
fj
lAi(\ls~l( fo
~or t~e
vt(y sho rf
lr\ ~
JJ·:J~o.A'JC{
po.ce.J
s~~~.J
~(\d k~p~ 3O\~ / blAr \Jus cCV<'~
bi9
CA
crJ\d
~o,.~+ ~~ oJ ~~
C
~A-
7
C ;ncrt~5(0d s~Q.,d ve.ry (GPIJ
Q~~
C
vJo.:5
5 tev-
t- '2-d
ON',J
fhl(J.
Stephen
Wendy
A th- Le.-te A
r~·~ the-
r'a.s[-
oJ7d
He
c2n d -
a./Y7e
~'=
51c3"'-e!:::;
0
S~L0-er
F-'P ~;~
IOCe.
R t~ Q..
c
LeJ:-e
steC\~
the
rUfl
rtAn()i~
c eur7e
w~
sc- ~ the-
C
3
C a-rY1 e
Q
~~ F-0.-0
He
Sec.on
0
Pr- CA-l
sp~cl
~
s CO-./t:- e d
c:>
~
ID.C-e-
He
col ~
he
t-o.-/Ce d
5
piC.kel
Gv-o~k
P4SC)
-h;,-
J
oJ7d
('C::LCe-
R th.l.Lt- e
3°;(5
E3
r'zlL d
O'v'eF
C:J"eJl
5
et;d n't:.
OJ2d
he-
~y
StcJt:-e d
I
CL3aJnj
0ra.~CA..~
0.. eJ:::li~ 44
sLowe..r
and
5~owe.J
Marking
the descriptions
Martin has mentioned all of the first 4 factors and also 3 of the additional ones. For this he scored 5 marks. Martin's commentary reads more like a report than a commentary, and since he does not mention the hurdles, he was not awarded any "commentary" marks. Therefore, Martin obtained a total of 5 marks out of the possible 8.
Stephen has only mentioned 2 of the first 4 factors and 2 of the additional ones, thus scoring 3 marks. However, Stephen's commentary is lively and interesting although he has ignored the fact that it is a hurdles race. He was awarded one "commentary" mark, making a total of 4 out of the possible 8.
Wendy has also mentioned 2 of the first 4 points, as well as 3 of the additional ones. She was awarded 3 marks for these. Wendy does not, however, obtain any "commentary" marks, since she has described each athlete's run separately, rather than giving a commentary on the race as a whole.
45
THE CASSETTE TAPE
--~
This diagram represents a cassette recorder just as it is beginning to playa tape. The tape passes the "head" (Labelled H) at a constant speed and the tape is wound from the left hand spool on to the right hand spool. At the beginning, lasts 45 minutes. (i)
the radius of the tape on the left hand spool is 2.5
Cill.
The tape
S ketch a graph to show how the length of the tape on the left hand spool changes with time.
Length of tape on left hand spool
o
10
30
20
40
50
Time (minutes)
(continued)
46
THE CASSETTE TAPE (continued) (ii)
Sketch a graph to show how the radius of the tape on the left hand spool changes with time.
/f\
3 Radius of tape on left hand spool (cm)
2 1 -
-+---Ir-------.----,------,----r-j'
o
10
20
30
~
40
50
Time (minutes)
(iii)
Describe and explain how the radius of the tape on the right-hand spool changes with time.
L==:==================================================:::::::::===::::::::=-.-------.-----~---
47
..======:::::=::::========:=J
THE CASSETTE (i) and (ii)
(i)
(ii)
(iii)
TAPE ... MARKING SCHEME
Translating
words and pictures into mathematical
representations.
1 mark
for a sketch graph showing a straight line with a negative gradient.
1 mark
for a sketch ending at (45,0).
1 mark
for a sketch beginning at (0,2.5) and ending at (45,1).
1 mark 1 mark
for a sketch showing a curve. for a curve that is concave downwards.
Describing and explaining a functional relationship using words.
2 marks
for a correct, complete description. eg: 'the radius increases quickly at first, but then slows down'. Part mark: Give 1 mark for 'the radius increases'.
2 marks
for a correct, complete explanation. eg: "the tape goes at a constant speed, but the circumference is increasing" or "the bigger the radius, the more tape is needed to wrap around it". Part mark: Give 1 mark for an explanation correct but not very clear.
A total of 9 marks are available for this question.
48
that is apparently
(ii)
Marking sketch graphs
Stephanie
3~ Radius of tape on left hand spool (em)
2 1
a
20
10
30
40
50
Time (minutes)
Stephanie's sketch shows a curve beginning at (0,2.5) and ending at (45,1). However, since it is not "concave downwards", she was awarded 2 marks out of the possible 3.
Mark
3 Radius of tape on left hand spool (em)
2 1
o
20
10
30
40
50
Time (minutes)
Mark's sketch is a "concave downwards" also awarded 2 marks for this section.
curve, but does not end at (45,1). He was
49
Paul
Ihe.. ~;
r-CA. cL
1\
~
o~
(..v/)
cy-ow
~
&0 ..... (]
s\o"""
or-- ~
~
~
~
0(\
~
cJ.- ~~\-
~\0-"='
t;bQ.
~;
con
s\-o-..n t- .
\r1e-nd
D-A"'J
h~ ut-
cyJ--.s ~~
~
spool.
Mcyh\-
~;Il
5~
be. C-~
~
Julie
1he
rCJdiu:s
r-J'9rY crt:
ho,.-d 0.
+he
-t- &.pe
~
c:nr=:xz
pFr.s+
~CC1~
spC)ol ,~
T
A+
~ed
&.L.t:..~ou3h "It ~
~
5'Td~.
h:9h
CJr't:>LH'IO
c:F
~
dor:g
.,::yz+f~"'3 t
bz-~ +ha.
rad~s
+~
+~ IS
r~cJi'U5 th~.s
ICl:JrCX7f
~ez::
61cvv
Brian
50
k:tz~
~
-t<:::rtZV"C:::Z"-
q"d -t"he::
-t-t-¥z
Ct'
~cz C}A,••..i'fC.}:::3:z:r
'"c..recjCI~~ slc;.u..JC2V-
$pool
$
vuzed
(iii )
Marking descriptions and explanations
The descriptions and explanations of how the radius on the right hand spool changes with time are often inseparable in the candidates' answers. To illustrate this, and also to demonstrate the range of acceptable responses, 3 scripts are shown-all of which were awarded the full 4 marks for part (iii).
51
FILLING A SWIMMING POOL (i)
A rectangular swimming pool is being filled using a hosepipe which delivers water at a constant rate. A cross section of the pool is shown below.
-
f ~I It I - -
-
-
-
- -- -
-
- dt
t
Describe fully, in words, how the depth (d) of water in the deep end of the pool varies with time, from the moment that the empty pool begins to fill.
(ii)
A different
rectangular
pool is being filled in a similar way.
1m 'V
~-----------
Sketch a graph to show how the depth (d) of water in the deep end of the pool varies with time, from the moment that the empty pool begins to fill. Assume that the pool takes thirty minutes to fill to the brim. 2
r-------+------+-----+-
Depth of water in the pool (d) (metres) 1 r-----+-----+-----_t__
u
10 20 Time (minutes)
52
30
FILLING (i)
A SWIMMING
POOL ... MARKING SCHEME
Describing a functional relationship using words.
1 mark
For stating that d increases 'uniformly' or 'steadily' for the first part of the filling.
1 mark
for stating that there is a change in the rate at which d increases.
1 mark
for stating that d increases more slowly for the second part of the filling.
1 mark
for stating that d increases 'uniformly' or 'steadily' in the second part of the filling.
(ii)
Translating a function presented pictorially into graphical form.
1 nlark
if the first part of the graph is curved.
1 mark
if the first part is concave downwards.
1 mark 1 mark
if the second part is a straight line with a positive gradient. if the sketch starts at (0,0), finishes at (30,2) and there is a change at (x,l) where 5 ~ x ~ 10.
If the graph consists of more than two parts, mark the first and last part, and deduct 1 mark from the total obtained. Ignore any final part that is a horizontal straight line showing an overflow.
A total of 8 marks are available for this question.
53
Paul
Christopher
-rc ,-¢\U. ~
~
lev·a. ~
~ wt-ere.
copeed
~~~ l1:-
W ·lll
F
u.r'
Less
'to ~
ro-e'c
Mark
10 3:arl:- w~ \je
o~
,,\- w\ \\
ro*
S~\.U
\At'
reA\I-iv\~ ~I- unh'l (5\\cAtl\ow) geb u,b,kr Ln, h-e n ~\)\fiJ 1\ "r~ mendo u,s tJ.j.
\:k. pod wi..'\ ~\\
54
(i)
Marking descriptions
Paul's description considers not only the fact that d increases at two rates but also that each rate is "constant". He was awarded the full 4 marks for his answer to part (i).
Christopher's description again considers the change in speed. However, although he has implied that for the first part of the pool, d increases at a constant rate, he has omitted this from the second part. He was therefore awarded 3 marks.
Mark has noted the fact that d increases at two rates, but he has not mentioned fact that these rates are linear. He scored 2 marks.
55
the
Simon
2t------f-----t-----t--"..L
Depth of water in the pool (d) (metres)
1 ~--:~----_+---_+__-
o
10 20 Time (minutes)
30
Mandy 2t------+-----+----~
Depth of water in the pool (d) (metres)
o
10 20 Time (minutes)
30
Beverley 2~----+-----+----i--
Depth of water in the pool (d) (metres)
o
10 20 Time (minutes)
30
Katrina 2
f------+-----+--------,:J--
Depth of water in the pool (d) (metres)
o
10 20 Time (minutes)
30
Andrew 2 ~----+------+-----+-
Depth of water in the pool (d) (metres)
o
10 20 Time (minutes)
56
30
(ii)
Marking sketch graphs
Simon's graph was awarded 3 marks out of a possible 4. His graph does not end at (30,2) and shows the change in rate occurring after 1 metre. Otherwise, his graph is correct .
.Mandy was awarded only 2 marks, since the first part of her graph was not a concave downwards curve. Beverley, Katrina and Andrew were each awarded 1 mark. Beverley's graph is similar to Mandy's but it does not end at (30,2). Katrina gained her mark for starting at (0,0), finishing at (30,2) and showing a change at (10,1). Andrew gained his mark for showing the second part as a straight line with a positive gradient.
57
58
Classroom Materials
59
,
Classroom Materials .'
-
--
_.,
.~ ~
.-
~
INTRODUCTION
These offer some resources by which pupils can be prepared for the questions on the examination. All the materials and suggestions are offered in the explicit recognition that every teacher will work in their own classroom in their own individual way. The aims of the material are to develop and give pupils experience in
* interpreting graphs of practical situations * sketching graphs from situations presented in verbal or pictorial form * searching for patterns within situations, identifying functional relationships and expressing
these verbally, graphically and algebraically
* using graphs to solve problems arising from realistic situations. The classroom material is organised into two Units (A and B, each of which is intended to support roughly two weeks' work), together with a problem collection providing supplementary material for students who need further practice at interpreting information presented graphically and for students who enjoy the challenge of solving realistic problems. Unit A contains a series of lesson suggestions which focus on the qualitative meaning of graphs set in realistic contexts, rather than on abstract technical skills associated with choosing scales, plotting points and drawing curves. (These skills are already thoroughly covered in most courses). This is because research evidence suggests that many pupils lack an understanding of the meaning of global graphical features such as maxima, minima, discontinuities, cyclical changes, increases or decreases over an interval, and gradients, when these are embedded in realistic contexts. U nitA contains almost no algebra, and has been used successfully with pupils in the top half of the ability range. (Some teachers have also used this Unit with pupils of low mathematical attainment, and have been encouraged by the results. However, in this case, a slower, more thorough approach was needed). Unit B offers pupils the opportunity to discover and explore patterns and functions arising from realistic situations and relate these to algebraic expressions which inel ude linear, reciprocal, quadratic and exponential functions. Unit B is technically more demanding than Unit A, and has been used successfully with pupils in the top quarter of the ability range. The Problem Collection has been divided into two parts. The first provides nine problems, set in realistic contexts, for quicker or more able pupils to solve cooperatively. Each problem is accompanied by a separate selection of hints which may be supplied to groups who need more detailed guidance. Many of these problems are quite challenging, and are open to a variety of approaches-although a
60
graphical situations
solution is usually possible. The second part contains seven shorter which require more straightforward practice at interpreting data.
More detailed introductions to these Units are provided on pages 63, 109 and 143 respectively. You may also find it helpful to look at the Support Materials and to work through them with your colleagues if possible; they are in a section at the end of this book. Notes for the teacher in each Unit provide specific teaching suggestions. Some of the activities involve class or group work and for this reason we have included some detailed suggestions on managing and promoting useful discussions between pupils. A summary of these suggestions may be found on the inside of the back cover to this book. As was eInphasised earlier, all the teaching suggestions are offered in the recognition that every teacher will work in their classroom in their own individual way. The trials of the material established that teachers found it helpful to have explicit detailed suggestions which they could choose from and modify. All the material contained in this book has been used in a representative range of classrooms and has proved to be effective in developing the skills that are the concern of this module. Throughout the Module, all pupils materials are "framed" and it is assumed that calculators will be available throughout. Masters of the worksheets for photocopying are enclosed in a separate pack.
61
Unit A CONTENTS
Introduction Al
A2
A3
63
Interpreting points
Are graphs just pictures?
Sketching graphs from words
Pupil's booklet
64
Teaching notes
65
Some solutions
71
Pupil's booklet
74
Teaching notes
75
Some solutions
80
Pupil's booklet
82 83 86
Teaching notes Some solutions A4
AS
Sketching graphs from pictures
Looking at gradients
Supplementary
booklets ....
Teaching notes
88 89
Some solutions
91
Pupil's booklet
94
Teaching notes
95
Some solutions
98
Pupil's booklet
Interpreting
points
100
Sketching graphs from words
102
Sketching graphs from pictures
104
62
INTRODUCTION U nit A focuses on the qualitative meaning of graphs, rather than on technical skills associated with choosing scales, plotting points and drawing curves. (These skills are already thoroughly covered in most courses). This is because research evidence suggests that many pupils lack an understanding of the meaning of global graphical features such as maxima, minima, discontinuities, cyclical changes, increases or decreases over an interval, and gradients, when these are embedded in realistic contexts. This Unit contains five lesson outlines, and is intended to occupy approximately weeks.
two
Al contains a number of activities which require pupils to reason qualitatively about the meaning of points located in the cartesian plane. Early items involve comparing positions and gradients, while later ones involve the consideration of correlation and a functional relationship. A2 is designed to expose and provoke discussion about the common misconception that graphs are mere 'pictures' of the situations that they represent. A3 contains activities which involve pupils in translating between verbal descriptions and sketch graphs. A4 and AS are both concerned
with sketching and interpreting graphs from pictures of situations. Gradually, more sophisticated graphical features are presented. In particular, A4 involves interpreting maxima, minima, interval lengths and periodicity while AS concentrates more on the interpretation of gradients. At the end of this Unit we have included some further activities which may be used to supplement these booklets. They may be used, for example, as a homework resource.
63
4. Sport Al
INTERPRETING
POINTS Suppose you were to choose, at random, 100 people and measure how heavy they are. You then ask them to perform in 3 sports;
As you work through this booklet, discuss your answers with your neighbours and try to come to some agreement.
High Jumping,
1. The Bus Stop Queue Who is represented
by each point on the scattergraph,
Weight Lifting and Darts.
Sketch scattergraphs to show how you would expect the results to appear, and explain each graph, underneath. Clearly state any assumptions you make ...
below?
Height LMax Max Jumped
Weight LJMax Lifted
Body weight
Score with 3 darts
Body weight
I
Body weight I I
5. Shapes
wid th -~
L...L-'--'---'--'-'--'--'---'--'-'--'-'---'--'-'--'--'---'--'-'--'-'-'
Alice
Brenda
Dennis
Cathy
Errol
Freda
Gavin
These
four shapes
* Label
four A,B,CandD.
L
each have an area of36 square units.
points
on
the
graph
below,
with
the
letters
* Can you draw a fifth shape, with an area of 36 square units, to correspond
*
Age
7.
4. 6·
5.
* Finally, Height
11=================================================
1'-1
2. Two Aircraft
--ll
to the other point? Explain.
Draw a scattergraph to show every rectangle with an area of 36 square units. include rea
x
height
what happens if you aLL shapes, with the same
, on your graph?
~
· L . ..-7 •
WIdth
4 3. Telephone
Calls
One weekend, Five people made telephone calls to various part of the country.
The following and B: (note:
quick sketch graphs describe two light aircraft, the graphs have not been drawn accurately)
Cost LB
i;~~s~ng~.B
RangeLA~
.A
Cost of call
• B
• John
Size
* Are the following statements
is cheaper"?
"The faster aircraft
is smaller"?
"The larger aircraft
is older"?
AgeL
B is more
• David
Capacity
expensive
Duration
* Who
was carefully.
ringing
long-distance?
Explain
of call
your
reasoning
same
distance?
* Who was making a local call? Again, explain. * Which
people
were
dialling
roughly
the
Explain.
* Copy
mark and label two
making
the graph and mark other points local calls of different durations.
which show people
* If you made a similar graph showing every phone call made in
S;zet
0>
• Sanjay
than
carries fewer passengers"?
Copy the graphs below. On each graph, points to represent A and B.
Speed
Passenger
true or false?
"The older aircraft
aircraft
• Barbara
• Clare
The first graph shows that aircraft aircraft A. What else does it say?
Cru;s;ng
A
•A
------7 Age
"The cheaper
They recorded both the cost of their calls, and the length of time they were on the telephone, on the graph below:
Britain during one particular week-end, what would it look like? Draw a sketch, and clearly state any assumptions you make.
~ 2
3
64
At
INTERPRETING
POINTS
The aim of this booklet is to offer pupils an opportunity to discuss and reason about the qualitative meaning of points in the cartesian plane. Five situations are presented which involve progressively more sophisticated ideas, from straightforward comparisons of position (items 1 and 2), to comparisons involving gradients (item 3), and eventually to the consideration of correlation (item 4) and functional relationships (item 5). Between one and two hours will be needed. Suggested Presentation 1.
Issue the booklet, and briefly explain the purpose of this lesson (and of the following few lessons), perhaps as follows: "What does the topic 'Functions and Graphs' mean to you? Perhaps you immediately think of putting numbers into formulae, making tables, choosing scales, plotting points and then joining them up with straight lines or smooth curves. In the next few lessons, however, our approach will be quite different. Instead of starting with algebra, we will be starting with situations from everyday life (sport, telephone calls, etc) and exploring how even a quick sketch graph can be used to communicate a great deal of information, and sometimes save many written words of explanation. For this work, you will need to talk with your neighbours and try to decide together what the various graphs are saying."
2.
Now allow pupils time to attempt the first three problems ("The bus stop queue", "Two aircraft" and "Telephone calls") in pairs or small groups. It is important that this is conducted in an atmosphere of discussion so that pupils are given every opportunity to explain and justify their own reasoning and receive feedback from others. Each group should be encouraged to discuss their ideas until they arrive at a consensus. Usually, the first two items cause less difficulty, whereas the third creates a great deal more discussion.
3.
Tour the room, listening and inviting pupils to explain what they are doing. This will heip them later, as they attempt to write down their own explanations. Before joining in a group discussion, we urge you to consult the inside back cover of this book, where we have provided a "Classroom discussion checklist" which contains a few suggestions concerning a teacher's role in promoting lively discussion. If pupils are making no progress then you may need to provide hints, but try to avoid giving too many heavily directed hints, like, for item 1, "Look at the points labelled 1 and 2. These represent the two oldest people. Which of these is taller?" Instead, give more strategic hints which encourage pupils to think for themselves, such as "How can you look at this graph more systematically?"
4.
Several difficulties may emerge: • "There are no numbers on the axes!" This problem may canse difficulty to pupils whose only previous graphical experience concerned those technical skills associated with accurate point plotting. If we had included scales on the axes,
65
pupils would have simply read off values, and answered the problem without considering the significance of the relative positions of the points. You may need
to remind pupils of the normal convention-that
quantities increase as we move
across the page from left to right or vertically upwards . • (on item 1) "I think that points 1 and 2 are Alice and Errol, and that 4 and 5 are Brenda and Dennis". Confusion is often caused by the fact that the height axis has not beel) placed vertically upwards. This is intentional in order to force pupils to look upon the graph as an abstract representation, rather than asa mere "picture", (ie, where "high" points are "tall" people). This common misconception is treated more fully in A2. • You may also need to explain the meaning of several words in the booklet. In particular, 'scattergraph' (item 1), 'range' and 'passenger capacity' (item 2), and 'duration' (item 3) have been seen to cause some difficulty. 5.
Towards the end of the lesson, you may feel the need to discuss item 3, "Telephone calls", with the class as a whole. This is the first item that requires an understanding of gradients and is therefore much more demanding. Below we indicate one way in which you may do this. If the class have been working in groups, call upon a representative from each group to explain their answers to the first three questions. As they do this, avoid passing an immediate judgement on their views as this may prevent other pupils from contributing alternative ideas. For example, in the dialogue below, the teacher allows pupils to continue putting forward their ideas even after a correct response has been received: Teacher:
"Who was ringing long-distance?"
Pupil A:
"You can't tell because distance is not on the graph."
Teacher:
"Sarah, what did your group think?"
Pupil B:
"It's John."
Teacher: Pupil B:
"Explain why you think it's John." "Because he has to pay a lot for a short time."
Teacher:
"Thanks Sarah, now are there any other ideas?"
PupilC:
"We think it's Barbara and John."
Teacher:
"Why?"
Pupil C:
"Because they pay the most, so they must be nnging furthest ... "
the
This last misconception may never have been uncovered and discussed if the teacher had acknowledged Sarah's response as correct. As pupils explain their answers, ask other pupils to comment on these explanations. 6.
The final two questions on the 'Telephone Calls' item are very demanding. Invite at least three representatives from the groups to sketch their ideas on the
66
blackboard and explain their reasoning. may be expected:
The graphs below are typical of what
Invite members of other groups to criticise these graphs, and explain how they may be improved. If this proves difficult, then the following approach, adopted by one teacher during the trials, may be helpful. She began by redrawing the axes, marked and labelled a point "John", and then continued as follows:
Teacher:
"If you were to make a long distance call, where would you put your point on the scattergraph?"
Pupil A:
"Below John and nearer to the cost line." (This pupil indicated point P).
Teacher:
"Why did you put the point there?"
Pupil A:
"Because if I talk for a shorter time than John, I don't have to pay as much as John."
Teacher:
"If you made an even shorter call, where would you put that point?"
Pupil A indicated point Q. Teacher:
"Would these three points lie on a straight line or a curved line?"
Pupil A:
"They have to be on a curved line, because otherwise the line would meet this line (the vertical axis), and you don't have to pay a lot of money not to talk."
Other pupils disagreed with this and insisted that the graph should be straight. Pupil B:
"It's straight because if you pay 5p for one minute, then you pay lOp for two minutes and ... "
67
Then one group suggested the following, rather stunning insight: Pupil C:
"It isn't like that, because you have to pay the same amount of money when you pick up the phone and just say a word for, say, half a minute ... you get this graph:"
(We would not expect many pupils to reach this level of sophistication spontaneously, and in most cases we would advise you against imposing such a model upon the class, where it could cause considerable unnecessary confusion. For most purposes, the graph suggested by Pupil B is perfectly adequate. Most graphs are only 'models' of reality and as such they usually involve making simplifying assumptions, which should be stated.) A long discussion ensued, and by the end of this lesson, most pupils appeared convinced by the step function. However, Pupil A still preferred a curved verSIon:
68
The teacher did not, in this case, impose 'the correct' answer on the class, as it didn't seem necessary. Such discussions do not always have to be resolved entirely in order for them to be valuable learning experiences. In many of these questions there is no single 'correct' answer anyway-it may all depend, as we have said, on the underlying assumptions. 7.
The remaining items in the booklet, 'Sport' and 'Shapes' , can also cause a similar amount of debate. Below, we offer one possible development with item 5, "Shapes": Ask everyone in the class to imagine a rectangle with an area of, say 36 square units. Draw the following graph on the blackboard, and place one point on it, explaining that this represents one such rectangle.
N ow ask various pupils to describe where they would place points to represent their imagined rectangles. The following questions may help develop the discussion:
69
"Suppose I mark a point here". (Indicate position A, but do not mark the
blackboard) . "Can this represent a rectangle with the same area, 36 square units? Why?" (Repeat this for positions B, C, D, E and F).
Can you identify other points on the graph which cannot represent rectangles with an area of 36 square units? Suppose we mark in all such points-in which "forbidden" regions will they lie?
Let's mark in another point which can represent such a rectangle. Are there any new "forbidden" regions?
Suppose we continue shading in "forbidden" time ...
in this way, regions each
70
Such a discussion may lead to an awareness that all points which represent rectangles with an area of 36 square units, will lie on a connected, curved, line. (It cannot be straight or it would meet an axis - giving a rectangle with zero area). If the "rectangular" constraint is now lifted, (and any shape is allowed, providing it has an area of 36 square units), the discussion can be developed still further. It may, for example, lead to such questions as: "Can we have a shape with a very large (infinite?) length and height, and yet still with an area of 36 square units?" Al
SOME SOLUTIONS
Note:
1.
In these solutions, as in all other solutions in this Module, there are often several correct alternatives, depending upon the underlying assumptions made or upon the degree of sophistication desired. In many cases the sketch graphs given, which are only intended as approximate models, may be further refined (using step functions, for example) to give more accurate representations. These solutions only attempt to represent a collection of acceptable responses achievable by an able pupil. They are in no way supposed to represent definitive, exhaustive analyses of the items.
The Bus Stop Queue Alice is represented
by point 2
Brenda is represented
by point 4 by point 6
Cathy is represented
by point 1
Dennis is represented
2.
Errol is represented
by point 5
Freda is represented
by point 3
Gavin is represented
by point 7
Two Aircraft
The first graph also states that aircraft A is older than aircraft B. The following two statements
are true:
"The older aircraft is cheaper." "The cheaper aircraft carries few passengers." The final two graphs should appear as below:
Age
.A
Size
.B .A
.B
Range
Cruising Speed 71
3.
Telephone Calls
John was ringing long distance. (Short time, high cost). Sanjay was making a local call. (Long time, low cost). David, Clare and Barbara were dialling roughly the same distance (assuming that the cost is proportional to the time). Other local calls will fall in a straight line which passes through Sanjay's point and the origin. At the time of writing, three charge rates operate at weekends; for local calls (L), for calls up to 56 km (a) and for calls over 56 km (b). (Here, we neglect calls to the Channel Islands, Northern Ireland and Overseas.) The graph showing every telephone call made in Britain during one weekend would therefore look like:
Cost
Duration
This again, of course, assumes that the cost is proportional to the time. (As costs can only be paid in discrete amounts, a more sophisticated model would involve a step- function).
4.
Sport
..
Maximum weight lifted
Maximum height jumped
,. . -....•... :." .. . :'~ ..:';.:'~'~"." .
.•
tI'.t 11 ••
o
Bodyweight (negative
correlation)
"
--:--
\,.
•••••.• t-
Maximum score with 3 darts
"
Bodyweight
Bodyweight
(positive correlation)
(no correlation)
In sketching these very rough graphs, we have assumed a random sample of people from roughly the same adult age group. If, for example, very young children are included, the graphs will be quite different. Pupils may also point out that many expert darts players are overweight, due perhaps to the nature of their training environment! 72
5.
Shapes
Height
A
D
•
•
.c •
No shape with an area of 36 square units can correspond to the fifth point. As both of its dimensions are less than those of point C, it can be seen that this shape must lie within a 6 by 6 square.
·B Width
If every rectangle with an area of 36 square units is plotted on the same graph, we obtain the rectangular hyperbola:
Height A
c B
Width If all shapes with the same area are plotted, then we will obtain
Height
hyperbola.
Width
73
the shaded
region
above this
A2
ARE GRAPHS JUST PICTURES? Finally,
Golf Shot
discuss and write about this problem: Which Sport?
Which sport will produce
a graph like this?
speedlO--,
I ! ! ! ! I I I
Time
I
Choose the best answer from the following and explain exactly how it fits the graph. How does the speed of the ball change as it flies through the air in this amazing golf shot?
Write down reasons
why you reject alternatives.
" Discuss this situation with your neighbour, and write down a clear description stating how you both think the speed of the golf ball changes.
Fishing Pole Vaulting 100 metre Sprint Sky Diving Golf Archery Javelin Throwing High Jumping High Diving Snooker Drag Racing Water Skiing
Now sketch a rough graph to illustrate your description:
Speed of the ball Time after the ball is hit by the golf club.
I i========================================
1
Peter attempted the golf question and produced a graph like this: Commenton
Speed of ball
it.
Can you suggest why Peter drew his graph like this? Can you see any connection the cartoon on page 1: Now try the problem
~==================4====================::j
~ /
\
1/
\\
_ 1
_
Time after ball between
Peter's attempt
• is hit
and
Fold this booklet coaster track. Try to answer graph.
below:
B
This next activity will help you to see how well you have drawn your sketch graph . so that you cannot see the picture of the rollerthe following
questions
using only your sketch
" Along which parts of the track was the roller-coaster quickly? slowly?
Roller-coaster
* Was the roller-coaster D or F' C or E?
travelling
* Where was the roller-coaster decelerating
travelling
faster at B or D"
accelerating
(speeding
up
P
(slowing down)?
Check your answers to these questions by looking back at the picture of the rolier-coaster track. If you find any mistakes. redraw your sketch graph. (It is better to use a fresh diagram than to try and correct your first attempt.) Describe your answer both in words and by sketching graph in your book. Speed of the Roller-coaster
a
* Now invent some roller-coaster
tracks of your own. Sketch a graph for each one, on a separate sheet of paper. Pass only the skefch graphs to your neighbour. Can she reconstruct tracks?
~L'
the shape
* Do you notice any connection ) -.---.-----r--~--,----~
ABC Distance
D travelled
E
F
coaster track, expl<:.nation.
G
along the track
3
74
roller-coaster
between the shape of a rollerand the shape of its graph? If so write down an
Are there any exceptions?
2
of the original
A2
ARE GRAPHS JUST PICTURES?
Many pupils, unable to treat graphs as abstract representations of relationships, appear to interpret them as if they are mere "pictures" of the underlying situations. This booklet is designed to expose and provoke discussion about this common misconception, so that pupils are alerted to possible errors in graphical interpretation which may result. Approximately one hour will be needed. Suggested Presentation 1.
Issue the booklet and explain the introductory situation. Ask the class to discuss this situation in pairs or small groups, until they come to some consensus. Then encourage each group to write down a clear description showing how they think the speed of the golf ball varies as it flies through the air, and then illustrate this description using a sketch graph.
2.
As pupils work on the problem, tour the room and listen to what they are saying. You may find that some pupils confuse the speed of the ball with the height of the ball and produce statements like "The ball speeds up after it has been hit by the golf club."
Speed
Time
They may feel that if the path of the ball goes 'up and down', then the graph should also go 'up and down'! (This is further reinforced by the fact that the ball begins and ends at rest!). Avoid condemning such responses, but rather invite comments from other pupils, and try to provoke "conflicts"-where pupils are made aware of inconsistencies in their own beliefs-by using questions like: "Where
is the ball travelling most slowly?"
"Does your graph agree with this?"
3.
After ten minutes or so, you may feel the need to hold a short class discussion. During this, it is quite easy to become bogged down in discussing the "physics" of the situation, and become immersed in long debates concerning the nature of gravity and so on. Try to resist this. It is not essential that everyone arrives at the "perfect" graph-only that everyone is alerted to the danger of treating the graph as a mere picture of the situation. Therefore, do not feel that the discussion has to be fully resolved before moving onto the "Roller-coaster" item. 75
Begin the discussion by inviting representatives from two or three groups to sketch their graphs on the blackboard, and explain their reasoning. Do not pass
judgement on them, but invite comments from the rest of the class.
Pupil A:
"We think it's A because the ball goes up and comes down."
Pupil B:
"It's B because the ball slows down as it goes up, and speeds up as it goes down."
Pupil C:
"In C, the ball starts off fast, then stops for a 'split second', then goes faster again."
Pupil D:
"In D, the ball speeds up after it is hit, then slows down, then speeds up again and then falls into the hole."
These four (genuine) responses illustrate the kind of reasoning that can be expected. Notice that pupil A has our classical "graph = picture" misconception, pupil B cannot translate a perfectly valid explanation into a graph (a common occurrence), pupil C has assumed that the ball becomes stationary at the highest point of the trajectory and Pupil D has assumed that the ball accelerates after it leaves the club face. In order to conclude the discussion, you may need to draw a fresh diagram on the blackboard showing the trajectory of the ball, and a pair of axes:
Trace the path of the ball with your hand and ask pupils to describe what happens to the ball's speed. As they make suggestions, ask them where the corresponding points on the graph should go. In this way it should be possible for everyone to see that the path of the ball and the shape of the graph are completely dissimilar. Do not worry if the resulting graph is not completely correct-the "Rollercoaster" situation will help to clear up any remaining misunderstandings.
76
4.
Now ask pupils to turn over and continue working on the booklet, again in pairs or small groups. The "Roller-coaster" situation reinforces the difference between a "picture" of the track and a graph. When drawing the speed-distance graph, some pupils may still be unable to vary things in a continuous manner, and prefer to plot a few discrete points and join them up. This often results in a few bouts of "straight-line-itis":
This is extremely the conventional,
r
o
(
f
common among pupils who have been introduced to graphs in point plotting way.
5.
It is important to emphasise that pupils rnay need to make several attempts at sketching a graph before they arrive at a correct version. Discourage them from erasing mistakes, but rather ask them to note down what is wrong with their sketch and draw a fresh one underneath. This will enable both the pupil and the teacher to monitor growth in understanding, and will help the pupil to treat each attempt as a helpful step towards a final solution.
6.
In the invent if their alone.
7.
After a while, pupils n1ay come to realise the following generalisation:
~
booklet, it is suggested that pupils should be given the opportunity to their own roller-coaster tracks, sketch corresponding graphs and then see neighbour can reconstruct the shape of the original tracks from the graphs As well as being enjoyable, this activity also emphasises the importance of cornmunicating information accurately.
c.anDOC:.\;.~.~
~
~~
~
~
~
',-~ ~m.. ~
~~Q.r::::,Q;...~
d~.
77
~~~
~.
~6.
~~O-..p"" ~
S""''CCLJ.-d .~\~
However,
others may be able to find exceptions:
f
-,-~
:
I
2; -:---, -rI
I
--F~--I---f : -----:
I --.
I
__
.__
! i -r---r-.
I
I
.'
!
I
I
I
!
I
(
8.
,
_--,
-I
I
--r--/ I .
_
l
..
I
The final activity in the booklet, "Which Sport?", is again intended to provoke a lively discussion. The following collection of answers (taken from the same class) illustrate the range of answers that may be expected.
Susan
6:. ~ ~
-.x.
6~
-r:~
~
\4 0--
~s ••.. ~~.
Ita.
~
~
"f
• ~
'\rQ.1JeJA
o..rJ.
~~).~
~
~ s~
~
-rt. ~ ~
~
~
\t1
~CN-n'\
~ 01-
~
Oe
OJ~
)~
$~'
Joanne
\ t~
~
be~
~
C'O.f ~
"7:)
ho"W"":'
~
tt ~~ ~ ~k ~ a" "':)kOJp cL-ap
w~
hot
a. ~~~
at Wu ~
tk
b~e
ot ~
w~cL \J~
~
cLo ~
~
~
~""~\, ~b.....r.:>.
Tony
I thv'lk gQJY\Q..
9~ a.
~
~
S?ort v:> ~"'all t-hP.. pkuj US ~ ~
vo ~
s~o.J:j ~
0v-Y
~
~
QnC1
pbju
not so streK\~~
hll tJ.u. 78
gOJ'(\fL
~.
~l
LV~
nn \n~ 0{- ~ bu.t
clrops ~
CU)
~
s~~
G\t
Greg
\ !2easo/1S
/
w~
have fa fodteve farachut tes because tieL f/an.t.. al01l3 ~ tarachutles /U/YlIS Md lands Ik.rz ~ 9081 for a
fk.n
dtu£r
who
slam
cltrn.b$
0/
a
thai
79
be -a A
1:Nzrz.. CJU.t of fb. jJ/aAe a. vJc:J.!<. Or
JOe..s
cit if'
SWc,mmlI1.J.
it).
~
Q/lol
Uj7
Q./ld
cilve5
Of
Q/lcl
A2
SOME SOLUTIONS
The Golf Shot The speed of the ball will vary roughly as shown in this graph: Speed
Time The Roller Coaster
Speed of the roller coaster
J A
B Distance
c
D travelled
F
E
G
along the track
Notice that the sketch graph looks rather like an 'upside-down' picture of the track. This can create a powerful conflict due to the "graph = picture" misconception. Which Sport? Sky diving provides one plausible answer because it clearly shows:
* the acceleration as the diver falls, * the terminal velocity as the wind resistance becomes equal to the gravitational \
pull,
* the rapid deceleration as the parachute opens, * the steady float down and * the 'bump' as he hits the ground. Some may argue that the parachutist will not begin his fall with zero speed because of the horizontal motion of the aircraft. The graph does fit, however, if 'speed' is taken to mean vertical speed. Sky diving may not be the only correct possibility, however. One pupil suggested that the graph could represent Fishing, where the speed of the hook is considered. As the line is cast, the hook accelerates, rapidly slows down as it enters the water, drifts along with the current and then stops suddenly when the line becomes taut.
80
Pole Vaulting, Golf, High Jumping, Javelin Throwing and Show Jumping all fail because the speed decreases as the athlete, ball, javelin or horse rises through the air, and increases again as they descend. Thus there will be a local minimum on the speed graph at the highest point of the trajectory.
81
A3
SKETCHING
GRAPHS FROM WORDS
Sketch graphs to illustrate the following statements. Label your axes with the variables shown in brackets. For the last statement you are asked to sketch two graphs on the same axes.
Picking Strawberries The more people we get to help, the sooner we'll finish these
\
picking
strawberries.
"In the spring, my lawn grew very quickly and it needed cutting every week, but since we have had this hot dry spell it needs cutting less frequently." (length of grass/time)
\
*
Using axes like the ones below, sketch a graph to illustrate situation.
1
Total time it will take to finish the job
"When doing a jigsaw puzzle, 1 usually spend the first half an hour or so just sorting out the edge pieces. When 1have collected together all the ones I can find, 1 construct a border around the edge of the table. Then 1 start to fill in the border with the centre pieces. At first this is very slow going but the more pieces you put in, the less you have to sort through and so the faster you get."
this
(number
"The Australian cottony cushion scale insect was accidentally introduced into America in 1868 and increased in number until it seemed about to destroy the Californian citrus orchards where it lived. Its natural predator, a ladybird, was artificially introduced in 1889 and this quickly reduced the scale insect population. Later, DDT was used to try to cut down the scale insect population still further. However, the net result was to increase their numbers as, unfortunately, the ladybird was far more susceptible to DDT than the scale insect! For the first time in fifty years the scale insect again became a serious problem." Use the same axes ... (scale insect population/time); (ladybird population/time).
--------------~ > Number
of people
picking strawberries
* Compare
your graph with those drawn by your neighbours. Try to come to some agreement over a correct version.
*
Write down an explanation of how you arrived at your answer. In particular, answer the folloWing three questions. -
should Why?
the graph 'slope upwards'
or 'slope downwards'?
-
should
the graph be a straight line? Why?
-
should
the graph meet the axes? If so, where? If not, why not?
4
9.
Choose the best graph to fit each of the ten situations described below. (Particular graphs may fit more than one situation.) Copy the graph, label your axes and explain your choice, stating any assumptions you make. If you cannot find the graph you want" draw your own version.
2,
"I quite enjoy cold milk or hot milk, but 1 loathe lukewarm milk!"
3.
"The smaller the boxes are, then the more boxes we can load into the van."
4.
"After the concert there was a stunned silence. Then one person in the audience began to clap. Gradually, those around her joined in and soon everyone was applauding and cheering."
5.
"If cinema admission charges are too low, then the owners will lose money. On the other hand, if they are too high then few people will attend and again they will lose. A cinema must therefore charge a moderate price in order to stay profitable, "
I
How does ..
the diameter it?
8.
the time for running race?
of a balloon
depend on its weight? vary as air is slowly released
a race depend
I
IlCl o ltD
In the following situations, you have to decide what happens. Explain them carefully in words, and choose the best graph, as before,
7.
along?
--
"Prices are now rising more slowly than at any time during the last five years."
the cost of a bag of potatoes
the speed of a girl vary on a swing?
10. the speed of a ball vary as it bounces
1.
6.
of pieces put in jigsaw/time).
from
upon the length of the
2
(k)
3
82
A3
SKETCHINf
GRAPHS FROM WORDS
.
In this booklet, pupils are invited to translate between verbal descriptions and sketch graphs. Two kinas of verbal forms are used: "Full descriptions" which give an explicit, detailedl account of exactly how the variables relate to each other and "Trigger phrases" which ask the pupils to imagine a situation and then decide for themselves the nature of the relationship between the variables. Within either kind of presentation, there exists a considerable variation in difficulty, depending on the context, the language used, and the kinds of graphical features demanded. Between one and two hours will be needed.
Suggested Presentation 1.
Issue the booklet and allow pupils time to discuss the introductory graph sketching activity in pairs or small groups, and encourage them to arrive at a consensus. Emphasise the need to write down an explanation of how they arrived at their answer, and draw their attention to the three questions at the foot of the page. As they work on this, tour the room listening and asking them to explain their reasoning-but at this stage it is better not to supply them with any answers, as this may spoil the class discussion which follows.
2.
You may like to ask three or four representatives from the groups to sketch their graphs on the blackboard. Try to arrange this so that different graphs are represented, including the following if possible:
Ask the groups to explain their decisions and invite comments from others. For example, graph A (or a similar kind of increasing function) is sometimes chosen because pupils have misinterpreted the axes: "At the beginning, few people are picking strawberries, but as time goes on, more and more join in." This misinterpretation has assumed that the vertical axis reads "elapsed time" rather than the "total time to finish the job." If this occurs~ emphasise that this particular situation is different to those presented in A2 in that here it is not 83
possible to trace a finger along the line of the graph and imagine time passing, because each point on the graph represents a different possible event. If pupils choosegtaph B, then the following development may be helpful: Teacher: Pupil:
"What does this point mean?" (Point P). "If you've only got a few people picking strawberries then it will take a long time."
Teacher:
" ... and this point?" (Point Q).
Pupil:
"If there are lots of people, it doesn't take so long. "
Teacher:
Total time
p
"What about this point?" (Point R) " ... and this point?" (Point S).
Q
Number of people
This kind of questioning should enable the pupils to see that the graph cannot meet either axis. Some may decide that the graph should therefore be curved. Others may prefer to simply erase the two ends:
Total time
Number
of people
If this is suggested, ask pupils to consider what would happen if very many people are involved in picking strawberries. This should enable most pupils to see that the right hand end of the graph cannot terminate in this way. When the left hand end is considered, however, pupils may raise the issue that "it is silly to have, say, half a person picking strawberries-so the graph must start with one person." (If, "number of people" is read to mean "number of people who work at a given rate", then it is just conceivable that the "fractional people" could be "lazy people!"). Ifpupils raise such issues, however, is it worth mentioning that the graph really only consists of discrete points;
84
Total time
...... N umber of people
As before, with the step functions in Al for example, it is not essential to develop the graph to this degree of sophistication. Occasionally,
pupils may raise the following insight:
"If you double the number of people picking strawberries, you halve the time it takes." This leads to the following sequence of points (PI, P2, ... ) which may settle once and for all the question of whether the graph is linear or curved:
Total time
Ps • N umber of people
>
3.
After the discussion, ask the class to write down a full explanation of the correct sketch graph, using the outline given at the foot of the first page in the booklet.
4.
N ow encourage pupils to work through pages 2 and 3 of the booklet, matching the situations to the graphs. Emphasise the importance of labelling axes, writing explanations and stating assumptions. Again, group discussion is essential if pupils are to improve in their understanding. This will take time and you should not worry if progress seems slow. (You may like to suggest that pupils work on, say, the odd numbered questions during the lesson, and leave the even numbered questions for homework). 85
In this exercise, pupils may soon notice, in discussion with their neighbours, that several different sketch graphs may be made to fit a particular situation-
depending on the labelling of the axes and the assumptions made. For example, for the first item, "Prices are now rising more slowly than at any time during the last five years", the following graphs are all valid solutions.
This multiplicity of answers may make full class discussion a bewildering experience, unless it is based on few questions, dealt with slowly and thoroughly. It is probably more helpful to coach the pupils on an individual or group basis. Often, it is enough to simply read through the question again with a pupil, and then run your finger along their graph and ask them what it is saying. This often helps them to see discrepancies in their solution. 5.
A3
The remaining items in the booklet, on page 4, invite pupils to attempt to sketch graphs with a wider variety of features. As the axes are now specified, there are fewer possible solutions which make them more amenable to class discussion, if it is felt necessary. Som~ Solutions
Page 1: A 'correct'
graph for the introductory
situation has the following shape:
Total time it will take to finish the job
N umber of people picking strawberries 86
(As has been mentioned before, a more refined model should consist of a set of discrete points. Also, if the number of people involved becomes very large, there is also the possibility that they will get in each others' way, and thus force the graph upwards again. Both of these refinements need not be emphasised to pupils, unless they raise such issues themselves). Page 2: The situations can be paired off with the graphs as follows (but as explained in the teacher's notes, there are many other possibilities and further refinements). 1 and 2 and 3 and 4 and 5 and
(g) (h) (1) (0) (j)
(Prices against Time) (Enjoyment against Temperature) (Number against Size) (Number clapping against Time) (Profit made against Price of admission)
6 and 7 and S and 9 and
(a) (f) (d) (m)
10 and (n)
(Cost against Weight) (Diameter against Time) (Time against Length of race) (Speed against Time) (Speed against Time)
Page 4: The final three situations may be illustrated with graphs as shown below:
Length of grass
~
Number of pIeces In JIgsaw
dryspell~
border
Time
Time
Population ,""'-
--, \
/
\
/ /
"
\
/
\ \
1868
1889
'-
--... 1930's
DDT introduced -- - ----
ladybird
centre
population
scale insect population (Note that the relative heights of these graphs is unimportant).
87
Time
A4
SKETCHING
B
The Big Wheel
GRAPHS FROM PICTURES
(,
The Big Wheel in the diagram turns round once every 20 seconds. On the same pair of axes, sketch two graphs to show how both the height of car A and the height of car B will vary during a minute.
Motor Racing
How do you think the speed of a racing car will vary as it travels on the second lap around each of the three circuits drawn below? (S = starting point)
Describe how your graphs turns more quickly.
will change
if the wheel
Orbits Each of the diagrams below shows a spacecraft orbiting a planet at a constant speed. Sketch two graphs to show how the distance of the spacecraft from the planet will vary with time.
Circuit
Circuit .2
1
Circuit 3
Explain your answer in each case both in words and with a sketch graph. State clearly any assumptions that you make. Using a dotted line on the same axes, show how your graphs will change if the speed of the spacecraft increases as it gets nearer to the planet.
speedL Distance Compare your graphs with those your neighbours. Try to produce which you all agree are correct.
along track produced by three graphs
Now invent your own orbits and sketch their graphs, on a separate sheet of paper. Give only your graphs to your neighbour. Can she reconstruct the orbits
~=============================================
~==fr=o=m==th=e==g=ra=p=h=s=a=l=o=n=e'=? ==..J.========================::::j
The graph below shows how the speed of a racing car varies during the second lap of a race.
Look again at the graph you drew for the third circuit. In order to discover how good your sketch is, answer the following questions looking only at your sketch graph. When you have done this, check your answer by looking back at the picture of the circuit. If you find any mistakes redraw your sketch graph.
Speed
Is the car on the first or second lap? How many bends are there on the circuit? Which
bend is the most dangerous?
Which "straight" portion Which is the shortest?
Distance Which of these circuits
of the circuit is the longest?
along the track
was it going round')
Does the car begin the third lap with the same speed as it began the second? Should it?
~w
I
invent
~
s
a racing circuit of your own with, at most,
:~ur bends. Sketch a graph on a separate sheet of paper to show how the speed of a car will vary as it goes around your circuit. Pass only your graph to your neighbour.
can she reconstruct circuit? ______ ~
the shape ~
of the original
racing Discuss this problem with your neighbours. Write down your reasons each time you reject a circuit.
....J
.2
3
88
A4
SKETCHING
GRAPHS FROM PICTURES
In this booklet we offer pupils the opportunity to discuss the meaning of various graphical features, (including maxima, minima and periodicity), in three realistic contexts. We also aim to give pupils a greater awareness of how to approach sketching a graph when many situational factors have to be taken into account simultaneously. Approximately one hour will be needed.
Suggested Presentation 1.
Allow the pupils about ten minutes to discuss the situation on the first page of the booklet, in pairs or small groups. While they do this, draw a simple racetrack on the blackboard. (It need not be the same one as in the booklet):
2.
N ow invite a volunteer to describe, verbally, how the speed of the car will vary as it travels around this track. (Discourage her from introducing too many technical details, such as gear changing, at this stage). Ask this pupil to sketch a speeddistance graph on the blackboard, and invite criticism from other members of the class.
3.
As each pupil passes a comment, invite them to come out and sketch a fresh graph under the previous one, explaining what new consideration they have taken into account. In this way, the original graph can be successively improved until everyone is satisfied that it fully describes the situation.
4.
Emphasise that when sketching graphs, pupils should not expect to get perfect sketches immediately, but must expect to have to make several attempts. Discourage pupils from erasing mistakes, but rather ask them to write down what is wrong with their sketch, and draw a fresh one underneath.
89
For example:
90
5.
N ow encourage the pupils to continue with the booklet, inventing their own circuits, and choosing the correct circuit to match the graph on page 3.
6.
The final page of the booklet contains two situations which are of a periodic nature. (If time is particularly short, then these may be used to provide suitable homework material).
A4
SOME SOLUTIONS
page 1: Motor Racing
Circuit 1 Speed
Distance
along track
Circuit 2 Speed
Distance
91
along track
Circuit 3
Speed
Distance
page 3:
along track
The car was travelling around circuit C. Circuits A, E and G have too many bends. Circuits Band D are ruled out because the second bend should be the most difficult. Circuit F is ruled out because the longest 'straight' should occur between the second and third bends.
page 4:
The Big Wheel
Height of Car
Car A CarB \ \ \
\ \
o
20
40
Time (seconds)
92
60
page 4:
Orbits
1. Distance from the planet
Time
2. Distance from the planet
Time (These graphs assume that the spacecraft is travelling at a constant speed).
93
AS
LOOKING
AT GRADIENTS
Draw sketch graphs for the following sequence bottles.
of
Filling Bottles In order to cal librate a bottle so that it may be used to measure liquids, it is necessary to know how the height of the liquid depends upon the volume in the bottle. The graph below shows how the height of liquid in beaker X varies as water is steadily dripped into it. Copy the graph, and on the same diagram, show the height-volume relationship for beakers A and B.
* Using your sketches
explain why a bottle with straight sloping sides does not give a straight line graph (ie: explain why the ink bottle does not correspond to graph g).
* Invent your own bottles and sketch their graphs on a separate sheet of paper. Pass only the graphs to your neighbour. Can he reconstruct the shape of the original bottles using only your graphs? If not, try to discover what errors are being made.
~--
Beaker
A
X
Sketch
Volume
B
two more graphs for C and D .
* Is it possible
to draw two different height-volume graph? Try to draw some examples.
..., I
I
Beaker
~!
J
lJ
X
X/
~/
k/_~_~
C
D
bottles which give the same
__
Volume
And two more for E and F
..c .~
::c
./
l/-", Beaker
E
X
/
X/
~ _ _ __
~
Volume
MJLt:.
4
t=========================================~=========================================j Here are 6 bottles
and 9 graphs.
Choose
the correct
Explain
your reasoning
For the remaining should look like.
graph for each bottle. clearly.
3 graphs,
sketch what the bottles
Conical
Ink bottle
flask
Volume
Volume
Volume
Volume
~rli! (g)
:r:::
I
Evaporating
flask
Bucket
Vase
Plugged
Volume
Volume
Volume funnel
2
Volume
3
94
~
Volume
AS
LOOKING
AT GRADIENTS
The situation, 'Filling Bottles' provides a harder challenge than most of the preceding ones, because it focuses mainly on sketching and interpreting gradients. The microcomputer program, "Bottles", (provided within the support material to this Module) may be used to enhance this presentation. Approximately one hour will be needed.
Suggested Presentation 1.
Ask the pupils to imagine themselves filling up a milk bottle at the kitchen sink. What happens? When does the water level rise slowly? Why is this? Why does the water tend to spurt out of the bottle at the top? (If at all possible, borrow a selection of bottles from the science department, and discuss how each of them will fill, perhaps demonstrating this by pouring water steadily into each one and asking the class to describe and explain what they see). In this way, try to focus their attention on how the water level in each bottle depends upon the volume of water poured in.
2.
Now issue the booklet. You may need to explain the opening paragraph. Ask the class if they have seen calibrated bottles in their science lessons. Ask pupils to explain why, for example, calibrations on a conical flask get further apart towards the top of the bottle. What would the calibrations on the evaporating flask look like? Why?
J~ Conical flask
3.
Evaporating
\
flask
Pupils should now attempt the worksheets in pairs or groups. In the exercise where the bottles have to be matched with the graphs, each pair or group should be asked to discuss the situation until they arrive at a consensus.
95
4.
The following stepwise approach can be of considerable difficulty.
help to those who are in
"Imagine you increase the volume by equal amounts. What happens to the height of the liquid in the bottle?"
Height
'--'=~~
~
Volume
(In this case, the height increases by a small amount to start with (so the bottle must be wide here), and gradually rises -by larger and larger amounts (so the bottle must gradually get narrower). This graph therefore, corresponds to the conical flask. 5 .As
you tour the room, you may notice that many pupils believe that graph (g) corresponds to the ink bottle, and graph (c) corresponds to the plugged funnel. This is probably due to a feeling that a "straight" edge on the bottle must correspond to a straight line on the graph (our old friend the 'graph = picture' mi~conception). Similarly, many pupils choose graph (e), graph (h) or even graph (d) for the evaporating flask, because the concave curve on the lower part of the bottle is identified with the concave graph. The final page of the booklet attempts to help pupils overcome such misconceptions, so it may be worth delaying a discussion about pages 2 and 3 until everyone has had a chance to discover and explain their own errors, on page 4. This page asks pupils to sketch graphs for the following sequence of bottles:
s.traight -).. hnes ~
curve
\ Volume
Volume
Volume
96
~
Volume
This may enable them to see that graph (f) rather correspond to the ink bottle. 6.
than graph (g) should
Finally, encourage pupils to invent their own bottles, sketch corresponding graphs, and then see if their neighbours can reconstruct the shapes of the original bottles from the graphs alone. Pupils may also discover that different bottles can result in the same graph:
This does of course assume that bottles without axial symmetry may be used.
97
AS
SOME SOLUTIONS B,
1
1 I Beaker
~ en 'Q) ~
I
X
A
B
A/
X
1
-+-l
"
I I I I I 1 1 I,,"
/
/
"
0
Volume
o
Volume
r
Beaker
X
u c
D
>
x r
r
i----J Beaker
E
X
The pairs are:
F
o
Volume
Ink bottle-(f) Conical flask--( d) Plugged funnel-(b) Bucket-(a) Evaporating flask-(i) Vase-(e)
The three remaining
(c)
graphs give the following bottles:
(h)
98
(g)
SUPPLEMENTARY
BOOKLETS
The pupil's booklets which follow, provide further practice at the ideas developed in Unit A, and may be used for revision, for homework or for additional classwork. Interpreting points continues the work introduced in AI, by providing additional material on the interpretation and use of scattergraphs. The fourth item illustrates the classic predator-prey relationship often encountered in biological work. Sketching graphs from words extends the work introduced in A3. The introductory situation invites pupils to interpret and discuss the meaning of several sketch graphs with particular reference to the changes in gradient. This is followed by further practice at translating "full descriptions" and "trigger phrases" into sketch graphs. Pupils are also invited to invent their own situations to accompany given sketch graphs-a very demanding activity. Sketching graphs from pictures introduces an unusual coordinate system, where each position in the plane is described by a pair of distances (x, y) from two fixed points. As pupils explore trajectories in this plane and the cartesian graphs (relating y to x) which result, they will uncover several surprising geometrical results and at the same time gain much valuable practice at sketching graphs and finding simple algebraic formulae. This booklet can be used to supplement any of the booklets in Unit A.
99
INTERPRETING
4. Sharks and Fish
POINTS
I. School Reports Alex
has ban. th.,s
iMld
!w.J
e;x~
~d
'"
a..,.
SU.'3
Vr:k~
"""-d
U a.
'"
WilJc
v,:~
N.l
~~
mO-
Mf'OH<.a.rJ..
rNJ~
wW
l
lA
.A~.
'-"-~
1l.S
bu..t
s!uJws,
b~
Pnff.
f"P,l)
ver~ oJJ~
J...a.rf.:j
rno.r1t
~
tiU"rv\.
ptr4~cL
t/\<~
p(5lJof
ta.3';j oJ}.
IN.
fu.r
fvl.< e;xa...t. ~tn1w~
ch.ssr
€({"'"'"
Below is a simplified description of what can happen when two species interact. The sharks are the predators and the fish are the prey. The situation in statement A has been represented on the graph by a point.
o..H.
How does this point goes by?
v-uy
SM cawd do
tJw
move as time
scJijW:
Number of sharks (predators)
J
~
~
WI)}... DO\'\£. {
•A Number
Each school report is represented by one of the points in the graph below. Label four points with the names Alex. Suzy. Catherine and David. Make up a school report for the remaining point.
(A)
Due to the absence of many sharks. supply of fish in the area ...
(8)
Sensing area.
Effort 4
(C)
The sharks eat many of the fish until .. .the fish population Many sharks therefore
(E)
With few sharks again.
•
•
Examination
(G)
is insufficient to support all the sharks. decide to leave.
around,
(F) The area now contains they return .
5
is an abundant
supply of fish for food. sharks enter the
(D) 1
•
a plentiful
of fish (prey) there
the fish population
increases
enough food to support more sharks, so
and begin to eat the fish ... until ..
mark 4
t=======================l============= ~===================================~ 3. Bags of Sugar
2. Is Height Hereditary?
i
I n an experiment, 192 fathers and sons were measured. (The sons were measured when they had attained their full adult height.) What can you say about points A and B? What conclusions
~
.
E
Cost D
can be drawn from this graph') A
74
..
. ..
f-
e
~
:c
Each point on this graph represents a bag of sugar. (a) Which bag is the heaviest? (b) Which bag is the cheapest? (c) Which bags are the same weight? (d) Which bags are the same price? (e) Which of For C would give better value for money? How can you tell? (f) Which of Bar C would give better value for money? How can you tell? (g) Which two bags would give the same value for money? How can you tell?
•
VJ
v ..c
'0
68 A
CD
'v
::r::
66
..
•
f-
.. -B
64
8
Weight
.--. 70
.
C
• •
72 __
u 2,
.
f-
,
1
62
64 Height
, 66
68
70
72
of father (inches) 2
100
once
SO~IE SOLUTIONS 1. School reports The graph should be labelled as illustrated below:
1
•
.2 Catherine
Effort
•
3
.
DavId
5
4
• Alex
•
Examination
Suzy Mark
The remaining point represents someone who has worked very hard, but did not perform well in the examination. 2. Is height hereditary? It is clear that there is some connection between the height of a father and the height of his son: A tall father is more likely to have a tall son. In this sample, no man 73 inches high has a son less than 70 inches, while no man of height 63 inches has a son as tall as 70 inches. In mathematical terms, there is a positive correlation between the two variables. 3. Bags of sugar (a) (b) (c) (d) (e) (f) (g)
Bag D is the heaviest. Bag B is the cheapest. Bags Band F are the same weight. Bags A and C are the same price. Bag C gives the better value for money. Bag C gives the better value for money. Bags A and F give the same value for money.
4. Sharks and fish
B,F
·A Number
of fish (prey)
101
SKETCHING
GRAPHS FROM WORDS
Sketch graphs to illustrate the following situations. Yau have to decide on the variables and the relationships involved. Label your axes carefully, and explain your graphs in words underneath.
Hoisting the flag Every morning, on the summer camp, the youngest to hoist a flag to the top of the flagpole. (i) Explain
in words what each of the graphs below would mean.
(ii) Which graph shows this situation (iii)
bOy scout has
Which graph is the least realistic?
Height flag
I
of
most realistically?
Your height vary with age?
Explain.
Height
(aJ
of
flag
I
flag
~_-
(b)
3 The amount
of daylight
The number Saturday')
of people
needed
o Time of
to make a pizza depend
we get depend
upon its
upon the time of year?
in a supermarket
5 The speed of a pole-vaulter
Height flag
of
Height of
of dough
L__ I
Time
~
:2 The amount diameter')
...j.
L Height flag
How does.
Explain.
vary during a typical
vary during a typical jump?
The water level in your bathtub you take a bath?
LL
vary, before.
during and after
o
Time
Time
Height flag
(e~
of
Time
Time
~==-====================================i '-'~o ~
~===============:================== Choose the best graph to describe each of the situations listeu below. Copy the graph and label the axes clearly with the variables shown in brackets. If you cannot find the graph you want, then draw your own version and explain it fully.
1) The weightlifter held the bar over his head for a few unsteady seconds, and then with a violent crash he dropped it. (height of bar/time)
2) When
I started to learn the guitar, I initially made very rapid progress. But I have found that the better you get, the more difficult it is to improve still further. (proficiency/amount of practice)
L~ l2 llll
3) If schoolwork is too easy, you don't learn anything from doing it. On the other hand, if it is so difficult that you cannot understand it, again you don't learn. That is why it is so important to pitch work at the right level of difficulty. (educational value/difficulty of work) 4) When jogging, I try to start off slowly, build up to a comfortable speed and then slow down gradually as I near the end of a session. (distance/time) 5) "In general, larger animals live longer than smaller animals and their hearts beat slower. With twenty-five million heartbeats per life as a rule of thumb, we find that the rat lives for only three years, the rabbit seven and the elephant and whale even longer. As respiration is coupled with heartbeat-usually one breath is taken every four heartbeats-the rate of breathing also decreases with increasing size. (heart rate/life span) 6) As for 5, except the variables
are (heart rate/breathing
rate)
=====:=lJ Now ma,ke up three stories of your own to accompany three of the remaining graphs. Pass your stories to your neighbour. Can they choose the correct graphs to go with the stories') 3
2
102
SOME SOLUTIONS Page 1.
Hoisting the flag
Graph
(a);
would mean that the flag was being raised at a constant rate.
Graph
(b):
the flag was raised quickly to start with, then gradually slowed down, near the top .
. Graph
(c):
the flag was hoisted in 'jerks', presumably as the scout pulled the rope 'hand over hand'.
Graph
(d):
the flag was hoisted slowly to begin with, but gradually accelerated up the pole.
Graph
(e);
the flag began rising slowly, then speeded up, and finally slowed down near the top of the pole.
Graph
(f):
impossible! (Included for those who see the graph as a 'picture' of the situation rather than as an abstract representation of it!)
Page 2.
The situations can be paired off with the graphs as follows:
1 and (f)
(Height of bar against time)
2 and (g)
(Proficiency
3 and (k)
(Educational
4 and (e)
(Distance
5 and (1)
(Heart rate against life span)
6 and (a)
(Heart rate against breathing rate).
(However,
these answers must not be regarded as the only possible correct ones).
Page 4.
against amount of practice) value against difficulty of work)
against time)
Suitable sketch graphs for the six items are:
2
1 Height
/
3 Amount of daylight
Dough needed
\ ~
SUffilner Diameter
Age 4
of pizza
Time of day
6
5 Water level
Speed
Number of people
Time of year
Tinle 103
Time
SKETCHING
GRAPHS
FROM PICTURES
In the accompanying of different paths.
Particles and Paths
booklet,
particles
are moving along a number
For each situation:
Or
* Sketch a rough graph to show how the distance from B will vary with the distance Oq
from A.
Ot
10
Op Os Distance froin B (em)
B
A
5 In the diagram
above,
there are 5 particles
labelled p, q, r, sand 1.
* Without
measuring, can you label each point on the graph below with the correct letter? Now check your answer by measurement (A and Bare 6 em apart)
o
5 Distance
10 Distance from B (cm)
. .
5
.
.
* Check your answer
5 Distance
by measuring various positions, recording in a table and by plotting a few points accurately.
your answers
.
* Try to find a formula the two distances Continue
()
10 from A (em)
Write
10 from A (cm)
exploring
which describes
the relationship
between
. other paths and their graphs.
up all yourfindings.
t=::======================1 =================§==============4===============l
&----------------~ ------------------~----
Graph
::
Diagram
I n this diagram, particle x is moving slowly along the path shown by the dotted line, from left to right. Sketch a graph to show how the distance distance from A during this motion.
from B relates to the
!1 J11
E
~
(;I
.1::
Distance from B (em)
~51:c
10
:Fl
o
be •
d
A
B
()..........-+-~~S~---->-1---0...•.......•. -)~ Distance
from A (cm)
5
o
5 Distance
Check your answer by measuring recording them in the table: Di~tance from A (cm)
h
5
4
Try to mark the positions of the five particles a, b, c, d and e on the right hand diagram (b has been done for you).
10 from A (em)
3
va flO us
2
I
positions
()
I
and
2
*
)
Which positions are impossible to mark? Why is this? Try to mark other points on the graph which would give impossible positions on the diagram. Shade in these.forbidden regions on the graph.
)
* One
Dj~tance from B (cm)
position of particle b has been shown. Is this the only position which is 4 em from both A and B? Mark in any other possible positions for particle b.
12
Write down any formube
~
Which points on the graph give only one possible position on the diagram?
that you can find which fit your graph.
3
2
104
SKETCHING
GRAPHS Particles
(i)
FROM PICTURES
(contd)
and Paths A
(vi)
a---.
/
.
...
",
"'
/ I
"'
I
'
I
'.
I
-----------------------------------+-0 -
\
I
I
~B I I
\ \
I
\ \
I
"' "'
B
105
"'
..•..•.......
-
--
--
- --
~~
SO,ME SOLUTIONS Page 1. 10 p Distance from B (cm)
•r
•
.q 5 s.
•t
o Distance
Page 2.
10 Distance from B (cm)
10
5
fran A (cm)
The arrows indicate the direction of travel of the particle. So, for the first part of the motion (until the particle reaches A): y = x + 6, from A to B:
/
5
x+y=6 and from B onwards:
y=x-6
o
5 Distance
10
from A (cm)
All the points in the shaded region are impossible to mark on the diagram.
Page 3.
Distance from B (cm)
where x and yare the distances from A and B respectively.
5
The points which lie on the boundary line are the only points which give one possible position on the diagraln .
·e •b
5
10
Distance from A (cm)
106
Page 4 and the second booklet:
10 Distance from B (em) 5
o
5 Distance
10 from A (em)
Each of these graphs must lie within the boundary indicated by the dotted line. Their equations
(i)
y
=
x
(ii) (iii)
x
=
4
(iv) (v) (vi)
are:
y = Ihx x -I- y = 10 y=x-l-2 x2 -I- y2 = 36
(x? (2 ~ (4 ~ (2 ~ (x?
3)
Y ~ 10)
x ~ 12) x ~ 8) 2) (x? 0, y? 0)
107
Unit 13 -
--~- -
~-,--, "
~
-
-
CONTENTS
Introduction Bl
109
Sketching graphs from tables
Pupil's booklet
110
Teaching notes
112 114
Some solutions B2
Finding functions in situations
Pupil's booklet Teaching notes Some solutions
B3
Looking at exponential functions
Pupil's booklet Teaching notes Some solutions
B4
A function with several variables
Pupil's booklet Teaching notes Some solutions
Supplementary
booklets ...
Finding functions in situations Finding functions in tables of data
108
116 117 119 120 121 123 126 127 129 131 138
INTRODUCTION In this Unit we offer pupils the opportunity to discover and explore patterns and functions arising from realistic situations and relate these to algebraic expressions which include linear, reciprocal, quadratic and exponential functions. This Unit contains four lesson outlines, and is intended to occupy approximately weeks.
two
BI contains a collection of activities which are designed to involve pupils in translating directly between tables of data and sketch g-aphs. ~y freeing them from time consuming technical skills (plotting points etc), pupils are encouraged to look at tables in a more global and qualitative manner. B2 attempts to involve pupils in searching for functions in situations. Pupils are invited to sketch graphs, construct tables of values and find formulae wherever possible. B3 involves the explorations of exponential functions within the context of ""Hypnotic drugs". We have included this activity because many textbooks appear to neglect these important functions. This is perhaps due to the fact that their study usually involves a great deal of difficult computation. However, with the advent of the calculator, exponential functions can be investigated by everyone. B4 presents a situation where three independent variables are involved. The pupil's booklet offers a collection of unsorted data concerning the strength of various 'bridges' with different dimensions. By holding two dimensions constant (length and thickness for example) a relationship can be discovered between the third (breadth) and the maximum weight the bridge will support. If pupils organise their attack on this problem in this way, they may discover a law by which the strength of any bridge may be predicted. To conclude this Unit, we again offer some further activities which may be used to supplement these materials. These include more algebraic material.
109
Bl
SKETCHING
GRAPHS
FROM TABLES
In this booklet, you will be asked to explore several tables of data, and attempt to discover any patterns or trends that they contain.
Try to make up tables of numbers which will correspond to the following six graphs: (They do not need to represent real situations).
How far can you see?
-Look carefully
Balloon's height (m)
Distance to the horizon (km)
5 10 20 30 40 50 100 500 1000
8 11 16 20 23 25 36 80 112
y~
x
0
0
0
-
x
Y~
Y~ x
x
0
Yb
Y~
at the table shown above.
0
* Without
accurately plotting the points, try to sketch a rough graph to describe the relationship between the balloon's height, and the distance to the horizon. Distance to the horizon
1 Balloon's
your method
x
x
0
Now make up some tables of your own, and sketch the corresponding graphs on a separate sheet of paper. (Again they do not need to represent real situations). Pass only the tables to your neighbour. She must now try to sketch graphs fron'\. your tables. Compare her solutions with yours.
--------------+ Explain
YL2_
height
for doing this.
4 Without plotting, choose selection on page 3) to fit Particular graphs may fit most suitable graph, name choice. If you cannot find own version. Time
the best sketch graph (from the each of the tables shown below. more than one table. Copy the the axes clearly, and explain your the graph you want, draw your
I"-----T""
(minutes)
Temperature
(CO)
~i ~:::';~;::,) 2. Cookin. Tim••
'0' Me,
How a Baby Grew Before Birth
lB··., "' \i Without plotting, try and sketch a graph to illustrate the following table: Altitude
Age (years)
Number of Survivors
Age (years)
0 5
1000 979
10
978 972 963
50 60 70 80 90 100
20 30 40
950
How daylight summer temperature varies as you go higher in the atmosphere
Numberof Survivors
913 808 579 248 32
o o
1
2
0
(DC)
20
Altitude (km)
Temperature (DC)
60
-12
10
-48
7U
-56
20
-50
80
-80
30
-38
90
-9U
40
-18
100
-75
50
6
110
-20
L---
o 3
110
Temperature
(km)
Bl.
(contd)
SOME HINTS ON SKETCHING GRAPHS FROM TABLES
Look again at the balloon problem, "How far can you see?"
The following discussion should help you to see how you can go about sketching quick graphs from tables without having to spend a long time plotting points.
*
As the balloon's height increases by equal amounts, what happens to the 'distance to the horizon'? Does it increase or decrease? Balloon's height (m) Distance to horizon (km)
5 8
10 20 30 40 50 100 500 1000 11 16 20 23 25 36 80 112
Does this distance increase
by equal amounts? ...
I
I
I
I
10
20
30
40
Balloon's
height
q
o
... or increase by greater and greater amounts? ...
]
.~
i
/
il_<~ L_
a§
'~~I
10
~
20
Balloon's
,----,-30
40
height
q
o N
... or increase by smaller and smaller amounts?
.~
o ..c
____ 5
v ,.d
•... •...o v u ~
N ow ask yourself: • do the other numbers in the table fit in with this overall trend? • will the graph cross the axes? If so, where?
.~ o L
·~I-~I
10
-~I
20
Balloon's
111
------.-1
30
40
height
BI.
SKETCHING
GRAPHS FROM TABLES
In this lesson, pupils are invited to explore tables of data and attempt to describe the patterns and trends they observe using sketch graphs. By freeing pupils from time consuming technical skills, such as deciding on scales and accurate point plotting, we aim to enable pupils to look at tables in a more global, qualitative manner. Between one and two hours will be needed. Suggested Presentation 1.
Issue the booklet and allow the pupils time to work on the balloon problem, '"How far can you see?", in pairs or small groups. Encourage each group to try to agree on a correct sketch graph, and ask them to write down an explanation of their method.
2.
Tour the room, listening and asking pupils to explain what they are doing. In spite of the instructions in the booklet, a few pupils may still feel an irresistible urge to plot accurate points. Discourage this, by asking them to try to describe how the numbers are changing in words, and inviting them to translate this verbal description into a sketch graph.
3.
After giving them time to attempt the problem, hold a short class discussion to discover their different approaches. Then give each pupil a copy of the follow-up sheet '"Some hints on sketching graphs from tables". This sheet describes one way of sketching a quick graph, by examining differences between entries in the table. Discuss this sheet with the class, emphasising the value of incrementing the balloon's height by equal amounts in order to find the overall shape of the graph. The final questions on the sheet may cause some disagreement. When deciding where the graph meets the axes, some may reason that when the balloon is on the ground, the distance the pilot can see is not zero. Others may decide that the "balloon's height" is equ~valent to "the height of the pilot's eye above the ground" in which case the graph will pass through the origin. It is not important that such issues are resolved however, so long as pupils clearly understand how the graphs relate to their interpretations of the situation.
4.
Now ask the pupils to continue working through the booklet, discussing each item in pairs or small groups. Emphasise the importance of labelling axes and writing explanations when matching the tables to the graphs on pages 2 and 3.As pupils work through these items they may realise that different sketch graphs may be made to fit a particular table if the axes are labelled differently. For example, for item 3, "How a baby grew before birth", both of the graphs shown below are valid solutions: (j)
(i) Length
Age
Age
Length 112
Considerable argument may also be generated when discussing if or where the graph should meet the axes. For example, some pupils may reject graph (b) in favour of graph (a) for the "Cooking times for Turkey" item, because they reason that "the graph must pass through the origin because a bird with zero weight will take no time to cook". (This is a particular case where none of the suggested sketch graphs fit the situation perfectly!) The final item on page 3 asks pupils to sketch a graph to illustrate a table which describes how the temperature of the atmosphere varies with altitude. In this case, some pupils may find it difficult to decide whether a change from -48°C to - 50°C is a rise or fall in temperature and may need help when examining the differences between successive table entries. 5.
The first item on Page 4 of the booklet invites pupils to construct their own tables of data, corresponding to six given graphs. This is a fairly open-ended activity with many correct solutions. As well as deciding whether the entries in a table should increase or decrease, pupils will need to decide exactly how the numbers increase or decrease. In particular, a comparison of graphs (0), (p) and (q) should provoke a useful discussion on gradients. The remaining item requires each pupil to first invent their own table of data, and then compare their sketch graph solution with one drawn by their neighbour. This kind of feedback provides pupils with a way of assessing their own understanding and usually generates a useful group discussion.
113
BI.
SOME SOLUTIONS
Page 1: How far can you see? The sketch graph should look something like the following:
Distance to the horizon
Balloon's
height
Page 2: The tables can be paired off with the graphs as follows: '1. Cooling coffee' with graph (g)
'2. Cooking times for turkey' with graph (b) '3. How a baby grew before birth' with graph (i) '4. After three pints of beer ... ' with graph (e) '5. Number
of bird species on a volcanic island' with graph (k)
'6. Life expectancy'
with graph (1)
(In each of the above cases, the independent horizontal axis.)
variable has been identified with the
However, in giving these answers, we are aware that, in several cases, these graphs do not correspond to the situations very closely. For example, the graph for item 2, 'Cooking times for turkey', is unrealistic for very small turkey weights. It implies, for example, that a turkey with zero weight will still take one hour to cook! Pupils may therefore prefer to choose grdph (i):
Cooking time
6
Weight (lb)
114
Page 3: How temperature
varies with altitude
o I-+-----------+--~-------------~>
Altitude
The shape of this graph may surprise you. Contrary to popular belief, atmospheric temperature does not drop steadily as altitude increases. It does fall from ground level to the top of the "Troposphere" , but in the "Stratosphere" it rises-affected by ozone (a heat-absorbing form of oxygen). In the ozone-free "Mesosphere" the air cools, while in the "Thermosphere" it rises again.
115
B2
FINDING FUNCTIONS
IN SITUATIONS For each of the two situations
The Rabbit Run
which follow,
(i) Describe your answer by sketching a rough graph. (ii) Explain the shape of your graph in words. (iii) Check your graph by constructing a table of values, and redraw it if necessary. (iv) Try to find an algebraic formula.
The Outing
-
Length
A coach hire firm offers ro loan a luxury coach fur £1::'0 per day The organiser of the trip decides to charge every member of the party an equal amount for the ride. How will the size of each person's contribution depend upon the size of the parti)
~
A rectangular rabbit run is to be made from 22 metres of wire fencing. The owner is interesied in knowing how the area enclosed by the fence will depend upon the length ofthe run.
Think carefully neighbour.
about
this situation,
and discuss
it with your Developing
Photographs
* Describe.
in writing. how the enclosed area will change as the length increases through all possible values. * Illustrate your answer using a sketch graph:
lL.
area Enclosed
"Happy Snaps" photographic service offer to develop your film for £1 (a fixed price for processing) plus IOp for each print. How does the cost of developing a film vary with the number of prints you want developed~ .
~ '> length of the rabbit run
1============_~====4 The pupils shown below have all attempted this problem. Comment on their answers. and try to explain their mistakes.
* I n order to see how good your sketch is, construct
o
'---------.-/
a table of
values:
AreaL
The longer the rabbit run. then the bigger the area
========t
Length
ot run (metre"s)
Length
* Do you notice any patterns
in this table? Write down what they are and try to explain why they occur.
Area
~ I
I
The amount of wire IS fixed. so as the run gets longer it gets narrower by the same amount 50 the area stays the same
'" Now,
o ~--~~--------'
,
B
0
so the graph
IS IS
11 metres .. no area .
turns
round
/
Are:~; Length
AreaL o
sketch
using
the
patterns
you
have
your sketch and your table of values. find out what the dimensions of the boundary should be to obtain the greatest possible space for the rabbit to move around in.
r
1~~~=~~ ~50n~r~:ngt\~~en
If the length again there
~
your
(This does not need to be done accurately).
* Using
Length
¢ '" ~
redraw
observed.
Longer runs are narrower. the area drops
* Finally.
try
to find
an
algebraic
situation.
11
so
Length
3
2
116
formula
which
fits this
B2
FINDING FUNCTIONS
IN SITUATIONS
In this lesson, we invite pupils to explore several situations in order to discover the functions (quadratic, reciprocal and linear) which underlie them. The situations are presented verbally, and pupils are initially asked to describe the relationships by sketching (not plotting) rough graphs and writing explanations. In this way, we hope that they will achieve a qualitative 'feel' for the nature of the functions. Pupils are then asked to check their sketch graphs by constructing and observing trends and patterns contained in tables of values, (using the methods introduced in B1). Finally, we challenge the pupils to try to describe the functions using formulae. (Notice how this completely inverts the traditional formula ~ table ~ graph sequence.) Between one and two hours will be needed. Suggested Presentation 1.
Issue the booklet and introduce the 'Rabbit run' problem to the class. It is quite helpful to use a loop of string and enlist the help of two pupils to illustrate how the shape of the rabbit run changes as the length of the run is increased:
1\
II
1 II Some pupils assume that the word 'length' means 'the longest dimension'. Explain that this is not the case, and that in this problem the length can even be made to take very small values. 2.
Now invite the pupils to discuss the relationship between the enclosed area and the length of the rabbit run in pairs or small groups. Ask each group to produce one sketch graph which adequately describes the situation, together with a written explanation, as suggested in the booklet. Emphasise that only a sketch graph is needed, it does not need to be drawn accurately.
3.
After giving them adequate time to do this, you may decide to collect together some of their ideas on the blackboard and hold a class discussion concerning the thought processes that went into these attempts. Again, we recommend that you act more as a 'chairman' or 'devil's advocate' than as a 'judge' at this stage (as described on the inside back cover of this book). You may be quite surprised at the variety of responses that are received. Page 2 of the pupil's booldet illustrates
117
four typical graphs and explanations. In addition, pupils often think a great deal about the practicalities of the situation, (for example the problem of putting a
hutch inside a very narrow enclosure), and often argue that "the enclosed area can never become zero, or the rabbit would be squashed!" They therefore reason that the graph should never cross the horizontal axis. Whether or not you decide to hold a class discussion, we recommend that all pupils are given an opportunity to write down their criticisms of the fOUf solutions presented on page 2 of the pupil's booklet. Such an exercise requires a great deal of thought and explanation. 4.
Pupils should now be encouraged to check their sketches by completing the table of data as shown on page 3 of the booklet:
I Length j
of run (metres) Area (square metres)
o I 1 o jl0
2 3 18 24
4
I
5
28 130
6 30
7
8
9
28 24
18
I I
10 10
1
6j
Again discourage them from plotting all these points, unless this is absolutely necessary. Instead, remind them of the methods they used to sketch graphs from tables in the previous booklet (B1). Some pupils may reason that the maximum possible area occurs when the run is "5 or 6 metres" in length. Remind thern of their initial sketch graph, (which probably didn't have a plateau), and if this still does not help, ask them to consider non-integral values of the length. 5.
Finding the final algebraic formula for this situation will provide a stumbling block for many pupils. It often helps if they are first asked to speak and then \vrite down a verbal recipe for finding the enclosed area for any given length of the rabbit run. For example: "Double the length, and take this away from 22 metres to find out how much is left for the two widths. Halve this to find the size of each width. Now multiply this by the length for the area." This may then be translated
into (22 - 2L) x
112
x L
=
A.
6.
The final two situations may now be attempted. The first situation produces a rectangular hyperbola, and the second, a straight line. Considerable argument may be generated as pupils try to decide if and where the graphs should cross the axes. (For example, in the second situation, "If you have no prints developed, it won't cost anything." "Can you have a film processed without having any prints?" etc.).
7.
In the supplementary section to this Unit, (see page 131), we have included some further situations which may be explored in a similar manner. These may be used as a resource for further practice or for homework.
118
B2
SOME SOLUTIONS
The Rabbit Run
Enclosed Area
~
Length of run !
I
Length of run (metres) Enclosed Area (m2) A
=
8'
24118
9
11011 1---10
0
L(11 - L) where A square metres = enclosed area L metres = Length of rabbit run.
The maximum area occurs when the shape of the boundary is a square, with each side measuring 5V2 metres.
The Outing This produces
the formula
C
=
120, where £C = size of each contribution N N = number of people in party.
=
ION + IOO,where C pence = cost of developing a film N = number of prints required.
Developing Photographs This produces
the formula C
119
B3
LOOKING
AT EXPONENTIAL
FUNCTIONS
* Check your sketch graphs by plotting a few points accurately on graph paper. Share this work out with your neighbour so
Hypnotic Drugs
that it doesn't
take too long.
* Do just one of the two investigations
Draw an accurate graph Triazolam wears off.
shown below:
to show how the effect of
After how many hours has the amount blood halved? How does this "Half initial dose?
life" depend
Write down and explain
Sometimes, doctors prescribe 'hypnotic drugs' (e.g. sleeping pills) to patients who, either through physical pain or emotional tension, find that they cannot sleep. (Others are used as mild sedatives or for anaesthetics during operations). There are many different kinds of drugs which can be prescribed. One important requirement is that the effect of the drug should wear off by the following morning, otherwise the patient will find himself drowsy all through the next day. This could be dangerous if, for example, he has to drive to work! Of course, for someone confined to a hospital bed this wouldn't matter so much.
on the size of the
your findings.
Investigate the effect of taking Methohexitone every hour. Draw an accurate implications.
of drug in the
graph
a 4/Lg dose
and
write
about
of
its
4
Imagine that a doctor prescribed drug called Triazolam. (Halcion®).
a
1I
~~ ~
After taking some pills, the drug eventually reaches a level * of 4/Lg/I in the blood plasma. How quickly
Continue the table below, using a calculator, drug wears off during the first 10 hours. You do not need to plot a graph. Amount
Time (hours)
~
will the drug wear off?
to show how the
of drug left in the blood
x
y
Look at the table shown below: 0 Drug name (and Brand name)
Approximate
Triazolam
y = A x (O.84Y
(HaIcion®)
Nitrazepam
I
(Brietal®)
!
KEY
4
I
3.36 ( = 4 x 0.84) 2.82 ( = 3.36 x 0.84)
2
y = A x (l.ISY
(Sonitan®)
Methohexitone
1
y = A x (O.97Y
(Mogadon®)
Pentobombitone
formula
A
=
size of the initial dose in the blood
y
=
amount
x
=
time in hours after the drug reaches the blood.
of drug in the blood
is y
I
y = A x (O.SY
For Triazolam,
the formula
In our problem
the initial dose is 4 /Lg/I, so this becomes
=
* Which of the following graphs best describes your data? Explain how you can tell without plotting
A x (O.84)X
y = 4 x (0.84)X
* On the same pair of axes, sketch four graphs to compare how a 4/Lg dose * of each of the drugs will wear off. (Guess the graphs-do not draw them accurately)
Please note that in this worksheet, doses and blood concentrations are not the same as those used in clinical practice, and the formulae may vary coniderably owing to physiological differences between patients.
* Only three of the drugs are real. The other was intended joke! Which is it? Explain What would happen
2
how you can tell.
if you took this drug? 3
120
as a
B3
LOOKING
AT EXPONENTIAL
FUNCTIONS
This booklet provides a practical context within which the properties of exponential functions may be discussed. Pupils will need to have access to calculators so that they can avoid becoming bogged down in unnecessary arithmetic. Graph paper will also be needed for the final two investigations on page 4 of the booklet. Between one and two hours will be needed.
Suggested Presentation 1.
Although the booklet alone may be used to introduce the situation, it is probably much better to discuss the first two pages with the class. The formulae which occur on the second page may appear daunting to some pupils, and it is therefore advisable to go through the "Triazolam" example with them. In particular, discuss various ways of using a calculator to find the amount of Triazolam in the blood (y) after successive hours (x), from the formula:
y
=
4 x (O.84Y
The most obvious key sequence is: , .... but there are considerable one is available:
or or
advantages in using a 'constant' multiplying facility if
~El~G
G
~0~0 ~0~~8
0
, ....
Although different calculators perform this function in different ways, we feel that it is important to discuss this issue so that pupils become fluent in the operation of their own machines. Of course, the amount of drug in the blood, after say 5 hours, can be evaluated more directly using the button if this is available.
G
e.g. ~
0 @B B 0 G
2.
Some pupils may appear surprised that repeatedly multiplying can actually decrease a quantity. From their earliest experiences with whole numbers, multiplication was always viewed as 'repeated addition' , and it therefore always 'made things bigger'. This misconception is extremely common, and it is therefore worth discussing in some depth.
3.
Now allow the pupils to continue working on the booklet in pairs or small groups. On the final page of the booklet, encourage the pupils to share the work 121
out between investigation,
them. For example, they may each choose to do a different and then report on their findings to the other members of the
group. Finally, encourage 4.
pupils to write up all their discoveries.
To conclude the lesson, you may like to generalise the work in the booklet by discussion concerning the shape of y = 4ax , (a > 0). For example, the following questions are very searching, and can lead to some deep, invaluable discussions. "How can you tell, purely by inspection, decreasing?"
whether the function is increasing or
"Is y always greater than zero? Why?" "What does a mean when x is not a whole number? a2 means a x a, but you cannot multiply a by itself 'half a time or 'minus three' times ... can you?" "What would happen if a < O?"
122
B3
SOME SOLUTIONS
The following sketch graph shows roughly how the same dose of each drug will wear off.
~.....•
----on
Key:
:i
"--'"
"'d 0 0
:0
4
~ .•...•
I
a
=
Triazolam
b
=
Nitrazepam
c
=
Pentobombitone
d = Methohexitone
"-J~
~
0
E ~
Time (Immediately,
we can see that Pentobombitone
was the joke drug.)
The first of the final investigations should lead to the following two conclusions: - the half life of Triazolam = 4 hours - this half life is independent of the initial dose. The second investigation asks pupils to investigate the effect of taking a 4 /-1g dose of Methohexitone every hour. This will produce the following graph, assuming that the drug enters the blood almost instantaneously: 8 -I--t----+--f-------t---j,-----+-----j,---t7Amount of drug in bloodstream (/-Lg/ I)
6-+-----,r-------+------I1+-------++-----l1--+---++----l-+----+-
5 -+-~~
+-\----I--~-+-----\--------+---\-+-4r-+---\-+-
4
. I
EE11--+-
3 ,
!
-~I
I
2
:
I
1
I
I
;
i
i
!
i
I
;
i
i
--t-f--+---I ------------+!-t-~r---i
I
.
.
I
,
I
---;----i-----t---+ i I
!
+ [
I I I --1~1-----+--~A-+ I
I
012345678 Hours
123
i
I
!
I
It can be seen from this graph that the maximum level of drug in the body tends towards a limiting value of 8 ~g/l. I t is vi tal for doctors to know exactly how the effect of a drug will build up in the body; too much may be dangerous, and too little may be ineffective. They must therefore try to keep the oscillations in between these two boundaries. (For example, in order to reduce the size of the oscillations a doctor may prescribe that a smaller dose should be taken more frequently.) In general,
suppose
that a dose of size "d" is administered
every hour. Then the
amount of drug in the blood just before the second dose will be ad (for some a < 1), and just after this dose, it will be ad + d. Eventually, the quantity of drug eliminated from the blood during one hour will become equal to the size of each dose, and the drug level in the blood will then reach its maximum value, dmax. where
d
=
max
and so
d
rnax
a d
max
=
+ d (see the diagram below)
_d_ 1- a
I I I
I I
I I
I
I
I
I I
d
I
I
I
max'
Amount of drug in bloodstream
(~g/l)
I I I
I
I I I ) I I I
I I I I
I )
I I I I
I I I
11
hour
124
I
ad
max
+
d
Alternatively, after successive hours, the maximum amount of drug in the blood will be: n d, d(l + a), d(l + a + a2), d(I + a + a2 + a3) ••• d(I - a +1) 1- a and as n ~
00,
this approaches
d , since a < 1. 1- a
125
B4
A FUNCTION
In this booklet
WITH SEVERAL
you will be considering
At the moment, we have 3 variables; length, breadth, and thickness. If we keep two of these variables fixed, then we may be able to discover a relationship between the third variable and the weight the plank will support.
V ARIABLE~
the following problem:
So ...
Bridges
* Collect
together all the data which relates to a plank 30 cm and thickness 2 cm, and make a table:
breadth
-I
Length
with
of plank (I metres)
Maximum
weight supported
(w kg wt)
Describe any patterns or rules that you spot. (Can you predict, for example, the value of w when 1 = 6?) Does your sketch graph agree with this table? Try to write down a formula to fit this data. Now look at all bridges with a fixed length and breadth, and try to find a connection between the thickness and the maximum weight it will support. Describe what you discover, as before.
* Now look at all planks with a fixed length and thickness.
How can you predict whether a plank bridge will collapse under the weight of the person crossing it?
For geniuses only! Can you combine all your results to obtain a formula which can be used to predict the strength of a bridge with any dimensions?
* Imagine
the distance between the bridge supports (I) being slowly changed. How will this affect the maximum weight (w) that can safely go across?
* Finally, what will happen in this situation? ~------
4m breadth thickness
Sketch a graph to show how w will vary with I.
-----= =
.....•
70 cm 3 cm
l============================~=========4=======================1 * Now imagine that, in turn, the thickness (t) and the breadth of the bridge are changed. on w.
(b)
Sketch two graphs to show the effect
w
w
r
2 I 2 2 I 2 2 I 2 1 4 I 2 2 3 3 4 5 I 4
* Compare
your graphs with those drawn by your neighbour. Try to convince her that your graphs are correct. It does not matter too much if you cannot agree at this stage.
* Write
down
an explanation
for the shape
of each of your
graphs.
The table on the next page shows the maximum weights that can cross bridges with different dimensions. The results are written in order, from the strongest bridge to the weakest.
* Try to discover bridge
patterns or rules by which the strength can be predicted from its dimensions.
Some Hints:
of a
Try reorganising this table, so that f, band t vary in a systematic way. Try keeping band w depends on 1 ...
Distance between supports f(m)
t fixed, and look at how
Breadth b(cm)
Thickness
t(cm)
40 20 50 40 20 20 30 20 20 30 40 20
5 5 4 4 4 5 4 3 4 2 3 2 4 2 2
to
30 30
to
30 30 20 40
lJ
If you are still stuck, then there are more hints on page 4.
2
3
126
Maximum supportable weight w(kg wt) 250 250 200 160 160 125 120 90 80 60 45 40 40 30 20 15 15 12 10 5
B4
A FUNCTION
WITH SEVERAL VARIABLES
This booklet provides an opportunity for pupils to discover an underlying pattern in a table of unsorted data. Since three independent variables are involved (breadth, length and thickness) this will require an appreciation that two need to be held constant in order to find a relationship between the third variable and the strength of the plank. The relationships involved are linear, reciprocal and quadratic respectively and should therefore be within the experience of most pupils. The microcomputer program, "Bridges", (provided within the support material to this module) considerably enhances this presentation. Between one and two hours will be needed.
Suggested Presentation 1.
Issue the booklet and allow the class sufficient time to sketch and discuss three sketch graphs relating the length, breadth and thickness of the plank to the maximum weight that it can support. (You may also decide to hold a class discussion to share their ideas). Opinions may vary widely. For example:
Pupil A:
"Thicker bridges are stronger. "
Pupil B:
"No they're not, because very heavy planks have more of their own weight to support. This means that they get weaker, like graph B."
Pupil C:
"Wider bridges are stronger."
Pupil D:
"If the plank gets wider then it will not affect how much it will hold until you get it very wide and the weight is spread more." '
At this stage the discussion need not be resolved and, in any case, it is almost impossible to form a conclusion on the little information that has been presented. The aim of this discussion is mainly to gain the interest of the pupils in the situation and enable them to think about the three variables on a global level before they become immersed in the detailed analysis of data. The sketch graphs will be referred to again, later on. 2.
After most pupils have acquired a 'feel' for this time to attempt to discover a rule by which the predicted from its dimensions using the table of the booklet. The most effective method involves and discovering how the maximum supportable the third variable. A hint to this effect appears
127
situation, allow them plenty of 'strength' of any bridge can be data given on the third page of keeping two variables constant weight is affected by changing at the bottom of page 2 of the
booklet. Discourage pupils from turning to page 4 of the booklet, where more detailed guidance is to be found, until they have explored their own strategies for solving the problem. This will take time, and it is unwise to hurry pupils, as it is only by trying various strategies and failing that the power of a systematic approach will become apparent. However, ifpupils are becoming discouraged, then tell them to read on. 3.
Towards the end of the lesson, it.n1ay be worthwhile spending some time discussing any observations or rules that members of the class have discovered. If the approach
outlined in the booklet is followed, then some pupils may have
discovered that the maximum supportable weight is proportional to the breadth, to the square of the thickness and inversely proportional to the distance between the bridge supports. (These results can be compared with the original sketch graphs). In fact, when l
=
2 and t =
4 then w = 4b (some may have w = b x t)
when l
=
1 and b
20 then w
when b
=
=
30 and t =
2 then w
= =
10f 60 (some may have w = ~) I I
In order to predict the strength of any bridge, these three expressions need to be combined into one:
w
=
(By substituting
kbt I
2
(where k is a constant).
values for b, t, I and w, it can be seen that k
= 112 ).,
This final idea is very demanding, and is probably only within the reach of a very few most able pupils. Do not feel it necessary to make everyone reach this stage.
128
B4
SOME SOLUTIONS
The three sketch graphs should show that
"Longer
bridges are weaker" '----------7/
"Thicker
bridgg~are
w
stronger"
(If you double the thickness, youqnore than double the maximum supportable weight). ~------7t
"Wider bridges are stronger"
w
(The fact that this relationship is linear can be deduced by recognising that two identical planks placed side by side will be able to support twice as much weight as a single plank.) Examining extracted:
the large table on page 3 systematically,
1
Length of plank (t metres) supportable
Thickness
of plank (t cm)
Maximum
supportable
Maximum
1
3
2
3
weight (w kg wt) 10 40 90
of plank (b cm) supportable
2
the following data can be
4
5
10 20
weight (w kg wt) 40 80
4
= 30 cm)
(breadth
weight (w kg wt) 60 30 20 15 12
Maximum
Breadth
"---------~b
(thickness = 2 cm)
5 (length
160 250
1 m)
= 20 cm)
(breadth
30 40 50 (length 120 160 200
=
=
2 m)
(thickness = 4 cm)
From these tables the relationships w = 60, w = 4b and w = 1012 may be deduced. I 2
Combining these we obtain: w = bt x constant I and substituting values for b, t, I and w into this equation we find that: w
=
bt2 21
Finally, according to this formula, the safe weight limit for the bridge on page 4 is
78.75 kg wt, so the woman can cross safely over.
129
SUPPLEMENTARY
BOOKLETS
The pupil's booklets which follow provide additional practice and extend the ideas presented in Unit B.
material which give further
Finding functions in situations. This booklet continues the work contained in B2. Six situations are presented, and pupils are invited to sketch graphs, construct tables of values and, finally, find algebraic formulae. (The functions involved are linear, quadratic, exponential and reciprocal.) Finding a formula will prove to be the major stumbling block, and it may help a great deal if pupils are first asked to speak and then write down in words the method they used for constructing the tables of values. This verbal description may then be translated into algebraic form, as described in B2. For some pupils, the algebraic part of the questions may prove to be too difficult, but they can still learn a great deal from the graph sketching and tabulating if this part is omitted. Finding functions in tables of data. This booklet extends the work begun in B 1, by introducing activities which involve fitting algebraic formulae to tables of data. Beginning with a table, pupils are asked to sketch rough graphs to illustrate the data, and match their sketch with a "Rogues gallery" of standard functions. These functions may then be made to fit the data using trial and error with a calculator, or by a little algebraic manipulation. Finally, pupils are asked to use their functions to produce additional data. Again, this is a demanding activity, but pupils should find it well worth the effort.
130
FINDING
FUNCTIONS
For each of the four situations
which follow,
Regular
your answer by sketching a rough graph.
(i) Describe (ii) Explain
IN SITUATIONS
6000
the shape of your graph in words.
(iii)
Check redraw
your graph by constructing it if necessary.
(iv)
If you can, try to find an algebraic too much if this proves difficult.
a table of values, formula,
and
EqUIlateral tnangle
but do not worry
A TV rental company charge flO per month for a colour set. An introductory offer allows you to have the set rent-free for the first month. How will the total cost change as the rental period increases?
Regular heptagon
x 0.8
=
Car
x U.8
=
Regular octagon
Regular nonagon
*
Describe graph.
*
Draw up a table of values,
Regular decagon
angles depend upon the
your answer in words and by means of a rough sketch
and check your sketch.
= 4 x 180° =
£2,400
720°
so each angle is .
£1,920 and so on.
How does its value continue
Regular hexagon
(If you find this difficult, it may help if you first calculate the total sum of all the angles inside each polygon by subdividing it into triangles, for example: sum of angles
and after two years, its value was £2,400
Regular pentagon
How does the size of one of the interior number of sides of the polygon?
When it was new, my car cost me £3,000. Its value is depreciating at a rate of 20% per year. This means that after one year its value was £3,000
Square
0000
1 Renting a Television
2 The Depreciating
Polygons
j
to change?
The instructions on what to do for these two questions the top of page 1.
Explain, in words, how you would calculate interior angle for a regular n sided polygon. Can you write this as a formula?
l
are at
0
.)
the size of an
The Twelve Days of Christmas
3 Staircases "The normal pace length is 60 cm. This must be decreased by 2 cm for every 1 cm that the foot is raised when climbing stairs."
.tr~~r treaa ~ +---+ "On the first day of Christmas my true love sent to me: A partridge in a pear tree. On the second day of Christmas my true love sent to me: Two turtle doves and a partridge in a pear tree. On the third ...
lf stairs are designed according to this principal, .hOWshould the "tread length" (see diagram) depend upon the height of each "riser"?
l
On the twelfth day of Christmas my true love sent to me: 12 drummers drumming, 11 pipers piping, 10 lords aleaping, 9 ladies dancing, 8 maids a-milking, 7 swans a-swimming, 6 geese a-laying, 5 gold rings, 4 calling birds, 3 french hens, 2 turtle doves, and a partridge in a pear tree."
4 The Film Show When a square colour slide is projected onto a screen, the area of the picture depends upon the distance of the projector from the screen as illustrated below. (When the screen is 1 metre from the projector, the picture is / 20 cm x 20 cm). How does the area of the picture vary as the screen is moved away from the projector?
After
/
twelve days, the lady counts up all her gifts.
How many turtle (No, not two).
doves
did she receive
altogether~
* If we call "a partridge
in a pear tree' the first kind of gift, a "turtle dove' the second kind of gift. .. etc, then how many gifts of the n th kind were received during the twelve days? Draw up a table to show your results.
2m
L
Sketch
a rough graph to illustrate
your data. (You do
not need to do this accurately). 1m
Which gift did she receive the most of? Try to find a formula
Om
to fit your data.
L.
2
3
131
SOME SOLUTIONS 1. Renting a television
lOr - 10, where £t = the total cost of renting the set, and r months = the rental period. (A step functio'n would bea better model). t =
Total cost
Rental Period
2. The depreciating
car
£3000 Value of the car
v = 3000 x (0.8)Q where £v = the value of the car and a years = the age of the car. Age of the car
3. Staircases
60 Tread length
60 - 2h where t cm = the tread length and h cm = the height of each riser. t =
30 Height of each riser
4. The film show
~rlchaC picture
r Distance
400d2 where a cm2 = the area of the picture and d m = the distance from the projector to the screen.
a
=
to the screen
132
The Twelve Days of Christmas Altogether, Altogether,
the lady received 22 turtle dov~s,(2 turtle doves on 11 occasions). over the twelve days,
Total 1 Partridge was received on 12 occasions 2 Turtle doves were received on 11 occasions 3 French hens were received on 10 occasions
1 x 12 = 12 2 x 11 = 22 3 x 10 = 30
12 Drummers
12 x 1 = 12
were received on 1 occasion
This results in the following table: nth gift total number received
1
2
3
4
5
6
7
8
9
10
11
12
12
22
30
36
40
42
42
40
36
30
22
12
The graph which results is shown below: 50 t3 40
4-<
'51 30
More swans and geese were received than any other gift.
20
A formula which fits this graph is y = x(13 - x)
4-<
0 l-<
v
..0
6
::l
Z
where y = number of gifts received 10
and x = the numerical label given to each gift. r-Il VJ
'"d l-<
VJ
:.0
(j)
O[J
'"d
'5
l-<
0...ro
VJ
>
0
Q
1 2
O[J
c::
VJ l-< Il)
VJ
bl)
c:: •...
••••
Il) VJ
VJ
VJ
VJ
~ U U U
c:: '"d Il) VJ ro '@ ;ra l-< ro 0 ~ r./) ~ ......l ......l
3
7
VJ
c:: Il)
- -
.•.• ""@
4
'"d 0
5
6
"0
8
VJ l-<
E E
a.. :1 l-< Q
0:
9 10 11 12
(The points on this graph should, strictly, not be joined up, as intermediate values have no meaning. However, since we only asked the pupils to sketch rough graph, they may well have illustrated the data with a continuous line.)
a
133
Regular Polygons
The graph and table drawn below illustrate how the interior angle of a regular polygon depends
upon the number of sides of the polygon.
180
Angle (degrees)
•
•
• • • • • • • • • • • • • • • •
•
•
100
• •
o
I
1
I
I
I
I
15
Number N umber of sides Size of each angle (0)
Number
of sides
Size of each angle CO)
3
4
60
90
30
I
10
5
40
5
6
I
25
20
of sides '7 I
8
9
10
11
12
108 120 128.6 135 140 144 156 162
60
72
90 120 180 360 720
x
168 171 174 175 176 177 178 179 179.5 180
The formula corresponding
to this data is:
a = 180 - 360 where a degrees = the size of each angle. n n = the number of sides. Again, strictly speaking, we cannot join the points on the graph with a continuous line as 'there is no such thing as a regular polygon with 21/2 sides, or 1T sides etc' ... or is there?
134
In a fascinating article:j:, David Fielker explains how an unexpected resulted when this question was taken seriously:
investigation
"For the sake of completeness they discussed a polygon with two sides. It should have an angle of 0°. They produced a formula in the form
n ~ 180 - 360 n
and this verified their intuition. It also seemed reasonable that asn became larger and larger, the angle became closer and closer to 180°. It was a nice-looking
graph. They could 'see' the curve. Should they draw it in?
Well, no. Not unless the rational points in between meant something. Could we, for instance, have a regular polygon with 21/2 sides? I t is in the nature of mathematics that questions like this can be taken seriously. This is one of the things that distinguishes mathematics from, say, physics. And although geometry seems to depend so much on intuition and imagery, one need not falter when intuition breaks down, but can continue in a more analytic way. After all, we could see where the point was on the graph: 21/2 sides should have an angle of around 40°. Calculation indeed showed that it was 36°. (N ote that I am now talking about 'we' rather than 'they'. At this stage I too am exploring new territory.) Undeterred by intuition, we decided to construct this polygon, using the only usable information, that it was regular, i.e. all the sides were equal and each angle was 36°. The result appears overleaf, so the reader can choose which way to be surprised!
extract is reprinted from "Removing the Shackles of Euclid" by David Fielker, one of a series of books entitled 'Readings in Mathematical Education' published by the Association of Teachers of Mathematics, Kings Chambers, Queen Street, Derby DE13DA.
:j: This
135
It needed a few more examples, and some rationalisation (no pun intended!) rather than a complete explanation. It made more sense if our 21J2 was written as 5/2, and we could now establish an interpretation for the numerator and the denominator. We looked at a 7/2,
and a 7/3,
and saw that a 7/4 looked the same as a 7/3. We could have an 8/3,
136
and even an 8/2,
but we noted that an 8/2 was not the same as a 4/1, which was a square, although the angle was the same! Evidently each point on the graph represented a set of (star) polygons each having the same angle. So, could we now go back to the graph and join up the points, since we now had a meaning for all the rational points? Yes, they said. No, said John. Because that would also include all the irrational points, and we had not yet found a meaning for those. And we did not, because even I thought we had got sufficient out of the exercise, and it was time to move on to other things three months before the examination! N or did we extend the graph backwards and try to interpret negative angles (e.g., a polygon with 11/2 sides having an angle of -90°). But someone should."
137
FINDING
FUNCTIONS
Try the following problem. get stuck, read on.
When you have finished, or when you
Dropping Time (seconds)
o
Distance fallen (metres)
o
1. Speed conversion chart
IN TABLES OF DATA
5
a stone 2
3
4
20
45
80
* Sketch a rough graph to illustrate this data.
* Can you see any rules or patterns in this table? Describe them in words and, if possible, by formulae.
4. Temperature
'" A stone is dropped from an aircraft. How far will it fall in 10 seconds?
•
conversion Fahrenheit 212
Celsius 100-
9590 85~~ 80-
Time for)OO Length of pendulum (em) swings (seconds)
Tables of data often conceal a simple mathematical rule or 'function' which, when known, can be used to predict unknown values. This function can be very difficult to find, especially if the table contains rounded numbers or experimental errors.
o
o
5 10 15
45 63 77
It helps a great deal if you can recognise a function from the shape of its graph. On the next page is a 'rogue's gallery' of some of the most important functions.
* Which graph looks most like your sketch for the 'dropping a stone'
70 65 60 5550 -_ 45---
185 176 _167
158 149 _140
40
35.-30~~
25 .. -20 15--10_~
131 113. .104
95 86 77
68 59 50
5
41
o
32
~----u-. 23 14
126
5
134 141
50
problem?
194
75
89 100 110 118
20 25 30 35 40 45
203
-17.8
60
o
~====-=====-=====-=====-=====-=- ~'=======================================:j "Rogue's
Gallery"
Fitting a formula to the data
Linear
l( )L VLL )~_ y = Ax + B
y = Ax
x
Y = Ax - B
x
Y = -Ax + B
x
By now, you have probably realised that the graph labelled y the only one which fits the 'dropping a stone' data.
= Ax2
is
In our case
y x
x
=
distance fallen (metres)
=
time (seconds)
and A is fixed positive number.
Quadratic
Try to find the value of A that makes the function fit the data either by trial and error or by substituting for values of x and y and solving the resulting equation.
* Reciprocal
Use your resulting in ten seconds.
formula
to find out how far the stone will fall
Now look at the tables on the next page
*
* Try to find patterns or rules in the tables and write about them.
~[>l)~~:_') Exponential
x
Sketch a rough graph to illustrate the type of function shown in each table. (You do not need to plot points accurately).
*
Use the "Rogue's each table.
*
Some of the entries in the tables have been hidden by ink blots. Try to find out what these entries·should be.
gallery" to try to fit a function to the data in
x
2
3
138
SOME SOLUTIONS Dropping
a stone
d = 5t2
Distance fallen
where d metres is the distance fallen in t seconds. After 10 seconds, the stone will fall 500 metres.
>
Time
Speed conversion chart
Speed in kilometres per hour
/
/
y = 1.61x where x is the speed in miles per hour and y is the speed in kilometres per hour. A speed of 50 mph corresponds to a speed of 80.5 kph.
Speed in miles per hour
Radio frequencies
and wavelengths xy = 300,000
Wavelength
Frequency
where x KHz is the frequency and y metres is the wavelength. (Note that frequency x wavelength = the velocity of light). The missing wavelengths are: Radio 2 330 m Radio 1 275 m Radio 3 247 m
139
A Pendulum
Clock t
=20rr-
where l cm = length t seconds = time for A pendulum with approximately 155 SWIngs.
Time for 100 SWIngs
of pendulum and 100 swings. length 60 cm will take seconds to perform 100
length of pendulum
Temperature
conversion
Temperature in degrees Fahrenheit
f
1.8e + 32 where e is the temperature in degrees Celsius, and f is the temperature in degrees Fahrenheit. 50°C = 122°F and - 50°C = -58°F.
Temperature in degrees Celsius
=
>
140
141
,
J
'
.A Problem Collection
-
CONTENTS
Introduction
143
Problems:
Carbon dating
144 146 150 154 158 164 170
Designing a can
174
Designing a water tank The point of no return "Warmsnug"
double glazing
Producing a magazine The Ffestiniog railway
Manufacturing
a computer
The missing planet
178 182
Feelings
190 191
Graphs and other data for interpretation:
The motorway journey
192 193
Growth curves
194
Road accident statistics
195 196 198
The traffic survey
The harbour tide Alcohol
142
INTRODUCTION This collection is intended to supplement the classroom materials presented in Units A and B. It is divided into two sections, "Problems" and "Graphs and other data for interpretation" . The first section contains 9 problems which can all be solved graphically. All but one of the problems is accompanied by a separate selection of hints which may be supplied to pupils who need more detailed guidance. These problems are challenging and pupils should expect to have to struggle with each one for some time before success is achieved. It is not intended that pupils should have to attempt every problem but that two or three should be selected and pursued in some depth. Below, we give some guidance on how this selection may be made. The second section presents a collection of shorter situations which are intended to provide more straightforward practice at interpreting data, and these items therefore tend to be easier than the problem solving situations presented in the first part. This section should not be treated as a collection which has to be worked through in a concentrated, ordered way but rather as a selection of ideas which can be dipped into and used from time to time as is felt appropriate. Solutions have not peen provided for this section.
143
PROBLEMS
Suggested Presentation As these problems are fairly demanding, it is helpful if pairs or small groups of pupils are allowed to work cooperatively in an unhurried atmosphere. Pupils are much more likely to achieve success if they are given problems which are pitched at a suitable level of difficulty and which concern a situation of some interest. It is therefore desirable to offer each group a selection of problems from which they can choose just a few (e.g., three) to work on over a given period (e.g., a week). The table shown overleaf should help you to select suitable problems, but it is advisable to read through each problem carefully before coming to a final decision. You will notice that each situation (except the last) begins with a problem statement and this is followed by a list of hints which offer more detailed step-by-step guidance. ('"The Missing Planet" is a longer, more involved situation and we have therefore decided that the problem-hint format is unsuitable.) We suggest that, initially, you only issue the problem statements. This will encourage pupils to explore and discuss their own ideas for solving the problems. If they run out of ideas or become completely bogged down, then the hints may be supplied either on paper or orally. Full answers have been supplied to the problems, but these should not be regarded as definitive. (Many problems can, be solved without using graphs or algebra.) Pupils should not be discouraged from pursuing a solution that appears very different from those supplied.
Summary
of problem situations
Designing a water tank To maximise the volume of a tank which can be constructed from a square sheet of metal. This involves maximising the cubic function v = 4x(1 - x)l (where o < x < 1), graphically. The point of no return To find the time and distance a pilot can tly before he has to turn back for home, assuming that he only has a limited quantity of fuel and a steady wind is blowing. To generalise these results for different wind speeds. This involves drawing pairs of linear graphs (using knowledge about their gradients) and finding their points of intersection. Warmsnug
double glazing
To discover a pattern in unsorted data and use it to spot an error and discover a rule behind the data. A scattergraph approach is useful. The function involved has two variables, and takes the form p = a + 21, where £p is the price of a window which uses I feet of wood for the frame, and contains a square feet of glass . .
-
-'
,
.....•...
_._ __ ..
..
---_._._.--._
.•
_---._._
..
-------~_._---_._--
144
.._._."_.
__ ._---_._-.------_._._.-----_
_-- •..._._-_.--_._~
•.----_ ... .. ,
Producing a magazine To consider the important decisions that must be made when producing a home made magazine and to decide on a selling price in order to maximise the profit made. This involves constructing and maximising two quadratic functions p = (100 - 2s)sandp = (100 - 2s) (s - 10) The Ffestiniog railway To design a workable railway timetable fulfilling a list of practical constraints. This is best done by fitting several linear distance-time graphs together and reading off arrival times at various stations. Carbon dating To discover the meaning of the term "half life", and how an archaeological find may be dated. This involves solving an exponential equation a = 15.3 x 0.886t where various values of a are given. As no knowledge of logarithms is assumed, this can be done graphically. Designing a can To minimise the surface area (a cost) of metal used when a cylindrical can with a given volume is to be manufactured. This involves minimising the function s = 1000 + 2TIr2, graphically. r
Manufacturing
a computer
To optimise the profit made by a small business which assembles and sells two types of computer. This is a challenging linear-programming problem. The missing plant A more extended situation requiring a variety of problem solving skills. Pattern recognition (using scattergraphs) and formula fitting both play an important part in forming hypotheses about the characteristics of a planet which, perhaps, used to lie between Mars and Jupiter millions of years ago.
145
DESIGNING A WATER TANK
<
2 metres>
I\:l?(:: ;'.:'' :..:.:;':: :
.::.~.~:.:.~:~:~.:.: . ..::~
r 1wr@!- - . - - - - ---- - :ffiG: : ------------: I
2 metres;
I
:
:
I I
A square metal sheet (2 metres by 2 metres) is to be made into an open-topped water tank by cutting squares from the four corners of the sheet, and bending the four remaining rectangular pieces up, to form the sides of the tank. These edges will then be welded together.
*
How will the final volume of the tank depend upon the size of the squares cut from the corners? Describe
*
your answer by:
a)
Sketching
a rough graph
b)
explaining
the shape of your graph in words
c)
trying to find an algebraic formula
How large should the four corners be cut, so that the resulting volume of the tank is as large as possible?
146
DESIGNING
*
A WATER TANK ... SOME HINTS
Imagine cutting very small squares from the corners of the metal sheet. In your mind, fold the sheet up. Will the resulting volume be large or small? Why? Now imagine cutting out larger and l~rger squares .... What are the largest squares you can cut? What will the resulting volume be?
*
Sketch a rough graph to describe your thoughts and explain it fully in words underneath:
Volume of the tank (m3)
r )
Length of the sides of the squares (nl).
*
In order to find a formula, imagine cutting a square x metres by x metres from each corner of the sheet. Find an expression for the resulting volume.
*
Now try plotting an accurate graph. (A suitable scale is 1 em represents 0.1 metres on the horizontal axis, and 1 em represents 0.1 cubic metres on the vertical axis). How good was your sketch?
*
Use your graph to find out how large the four corner squares should be cut, so that the resulting volume is maximised.
147
SOLUTIONS
TO "DESIGNING A WATER TANK"
This problem is considerably enhanced if a practical approach is adopted. A supply of scissors and 20 em by 20 em cardboard squares will enable pupils to construct scale models (1: 10) of a number of different water tanks. (Calculators will be needed to help with the evaluation of the volumes). Challenge each group of pupils to make the "largest" water tank (i.e., the one with the greatest capacity) from the given square of cardboard. Initially, few pupils are likely to adopt an algebraic approach. Usually, pupils prefer to begin by conducting a series of random experiments until they have acquired a strong intuitive 'feel' for the situation, and only then consider adopting a nlore systematic method. This, a most natural sequence of events, should not be discouraged or hurried. Below, we give a graphical solution to the problem: The relationship between the volume of the box (v cubic metres) and the size of the square (x metres by x metres) cut from each corner is given by
v
= (2 - 2x) (2 - 2x)x = 4x(1 - X)2
~2
-
(0 < x < 1)
2x ---+
A suitable table of values is given below:
0.3
0.4
J.-
0
0.1
0.2
v
0
0.324
0.512 0.588 0.576
148
0.7
0.8
0.9
0.5
0.6
0.5
0.384 0.252 0.128 0.036
1 0
The table results in the following graph:
1
-
I
0.9 0.8 I
I
:
0.7 Volume of box (metres3)
0.6
V
0.5
~
/
0.4
V
0.3
0.1
~I
1\
I
I
/ /
0.2
0
r----...
\ r\.
I
'\"
V o
0.1
0.2
0.3
0.4
0.5
0.6
0.7
0.8
Length of sides of squares (metres)
The maximum
"
"-..
volume of 0.593m3 occurs when x = 0.33 metres
149
0.9
1
THE POINT OF NO RETURN
Imagine that you are the pilot of the light aircraft in the picture, which is capable of cruising at a steady speed of 300 km/h in still air. You have enough fuel on board to last four hours. You take off from the airfield and, on the outward journey, are helped along by a 50 km/h wind which increases your cruising speed relative to the ground to 350 km/h. Suddenly you realise that on your return journey you will be flying into the wind and will therefore slow down to 250 km/h. *
What is the maximum distance that you can travel from the airfield, and still be sure that you have enough fuel left to make a safe return journey?
*
Investigate
these 'points of no return' for different wind speeds.
150
THE POINT OF NO RETURN ... SOME HINTS
*
Draw a graph to show how your distance from the airfield will vary with time. How can you show an outward speed of 350 km/h? How can you show a return speed of 250 km/h?
800 ~
rJJ
C) l-<
700
-+-'
C)
8 600
0 ---;
~
'-' "0
500 I
Q)
~l-<
.c; 400 8
0
~
300
(1)
u
::: C'j
200
-+-'
.•...• rJJ
Q
100
a
1
2
3
4
Time (hours)
*
Use your graph to find the maximum distance you can travel from the airfield, and the time at which you should turn round.
*
On the same graph, investigate the 'points of no return' for different wind speeds. What kind of pattern do these points make on the graph paper? Can you explain why?
*
Suppose
the windspeed is w km/h, the 'point of no return' is d km from the airfield and the time at which you should turn round is t hours.
Write down two expressions for the outward one involving wand one involving d and t. Write down two expressions for the homeward one involving wand one involving d and t.
speed
of the aircraft,
speed of the aircraft,
Try to express d in terms of only t, by eliminating w from the two resulting equations. Does this explain the pattern made by your 'points of no return'?
151
SOLUTIONS TO "THE POINT OF NO RETURN" A graphical approach to this problem is probably the most accessible. With a 50 km/h wind, the point of no return can be found by finding the intersection of two straight lines, one through the origin with a gradient of 350 (km/h) and the other through the point (4,0) with a gradient of -250 (km/h). The maximum distance that can be travelled is about 580 kilometres (or, more precisely, 583 kilometres) and the pilot must turn round after 1 hour 40 minutes. 700 ~
a
~
"--' '"d
] 4-1
600
I
500
a0
I'
"
1/
V
f'
V
~
'@
..•..
, V
/ 1/
I"
'"I"
'"
400
I"
I"-
~
4-1 Q)
300
u
/
C
•.... .....• C\l
r./J
r-..
200
I"
0
\. I\.
I
/ /
100
1'\
"
o
1
2 Time (hours)
3
4
When several 'points of no return' are found for different wind speeds, it may be seen that they lie in the parabola d =150t(4
- t)
where d kilometres = maximum distance travelled from airfield and t hours = time at which the aircraft must turn for home. This is illustrated
on the front cover of this Module book.
152
This formula Suppose
the windspeed
The outward
The homeward
Adding
is derived below: is w km/h.
speed of the aircraft
=
300 + w = ~ (km/h)
-CD
speed of the aircraft = 300 - w = 4 ~ t (km/h)
CD and 0
--0
we obtain 600 = ~ + (4 ~ t) =?
d = 150t(4 ~ t)
Other results which may be obtained are: w
t
= 2 - 150
1 d = 150 (300 + w) (300 - w) These formulae can be used to determine the time at which the aircraft must turn and the range of the aircraft for any given windspeed.
153
"WARMSNUG
DOUBLE GLAZING"
(The windows on this sheet are all drawn to scale: 1 cm represents 1 foot).
*
How have "Warmsnug" arrived at the prices shown on these windows?
*
Which window has been given an incorrect price? How much should it cost?
A
£88
Explain your reasoning clearly.
c £66
£46
\LL--------
£84
154
"WARMSNUG"
*
Write down a list of factors which ,nay affect the price that "Warmsnug" for any particular window: e.g.
*
DOUBLE GLAZING ... SOME HINTS
ask
Perimeter, Area of glass needed,
Using your list, examine the pictures of the windows in a systematic manner. Draw up a table, showing all the data which you think may be relevant. (Can you share this work out among other members of your group?)
*
Which factors or combinations determining the price?
of factors
is the most
important
In
Draw scattergraphs to test your ideas. For example, if you think that the perimeter is the most important factor, you could draw a graph showing: 11\
Cost of window
> Perimeter
of window
*
Does your graph confirm your ideas? If not, you may have to look at some other factors.
*
Try to find a point which does not follow the general trend on your graph. Has this window been incorrectly priced?
*
Try to find a formula which fits your graph, and which can be used to predict the price of any window from its dimensions.
155
SOLUTIONS
TO '"WARMSNUG"
DOUBLE GLAZING
In this activity, pupils are invited to search through a collection of unsorted data in an attempt to discover some underlying rule or pattern which may then be used to spot errors and predict new results. The initial data collection may prove quite time consuming, but if a group of pupils work cooperatively, and share tasks out among group members, much time and effort may be saved. (Pupils often find it hard to work collaboratively where each member presents a different contribution to the final product. It is more common to find every member of a group working through every task.) The table shown below summarises the information worksheet. Window
Breadth (feet)
Height (feet)
Area of glass (feet2)
that may be extracted from the
Perimeter (feet)
Length of wooden surround (feet)
Price (£)
A
8
4
32
24
28
88
B
6
4
24
20
26
76
C
6
2
12
16
16
44
D
5
4
20
18
23
66
E
3
5
15
16
16
47
F
4
8
32
24
28
88
G
2
4
8
12
12
32
H
3
4
12
14
17
46
I
2
6
12
16
18
55
J
4
6
24
20
20
64
K
3
3
9
12
12
33
L
2
2
4
8
8
20
M
2
1
2
6
6
14
N
4
4
16
16
20
56
0
4
3
12
14
14
40
P
6
6
36
24
24
84
Scattergraphs may be used to test the strength of the relationships between these factors and the overall prices. Indeed, the area of glass used and the length of the wooden surround both give strong correlations from which it is possible to identify window I as probably the one which has been incorrectly priced.
156
It seems logical to pay for the length of wood and the area of glass.
If we therefore
try to fit the model
Price = k I X area + k2 x length of wood used, then by substitution we find that k I = 1 and k2 = 2, in appropriate units. Thus the glass costs £1 per square foot, and the wooden surround costs £2 per foot. Window I has therefore
been given an incorrect price, it should be £48, not £55.
,157
PRODUCING
A MAGAZINE
A group of bored, penniless teenagers want to make some money by producing and selling their own home-made magazine. A sympathetic teacher offers to supply duplicating facilities and paper free of charge, at least for the first few Issues. 1
a) Make a list of all the important decisions they must make. Here are three to start you off: How long should the magazine be?
(l pages)
How many writers will be needed?
(w writers)
How long will it take to write?
(t hours)
b) Many items in your list will depend on other items. For example, For a fixed number of people involved, the longer the magazine, the longer it will take to write. /1\
For a fixed length of magazine, the more writers there are, Complete the statement, to illustrate it.
and sketch a graph w writers
./
Write down other relationships you can find, and sketch graphs in each case. 2
The group eventually decides to find out how many potential customers there are within the school, by producing a sample magazine and conducting a survey of 100 pupils, asking them "Up to how much would you be prepared to pay for this magazine?" Their data is shown below: Selling price (s pence) N umber prepared
Nothing
to pay this price (n people)
100
10 20
30
40
82
40
18
58
I-Iow much should they sell the magazine for in order to maximise their profit? 3
After a few issues, the teacher decides that he will have to charge the pupils lOp per magazine for paper and duplicating. How much should they sell the magazine for now?
158
PRODUCING 1
Here is a more complete account:
A MAGAZINE
list of the important
Who is the magazine for? What should it be about? How long should it be? How many writers will it need? How long will it take to write? How many people will buy it? What should we fix the selling price at? How much profit will we make altogether? How much should we spend on advertising?
* *
...
Can you think of any important
SOME HINTS factors
that must be taken into
(schoolfriends?) (news, sport, puzzles, (l pages) (w writers) (t hours) (n people)
(5 pence) (p pence)
(a pence)
factors
that are still missing?
graphs to show how: t depends on w; w depends on 5; p depends on 5; n depends on a.
Sketch
jokes .. ?)
on
I;
n depends *
" L
3
Explain
~~ Draw
the shape of each of your graphs a graph
of the information
in words.
given in the table of data.
*
Explain
*
What kind of relationship is this? (Can you find an approximate formula
the shape of the graph. which relates n to s?)
*
this data, draw up a table of values and a graph to show how the profit (p pence) depends on the selling price (5 pence). (Can you find a formula which relates p and 57)
*
Use your graph to find the selling price which maximises
From
Each
*
magazine
Suppose
the profit made.
costs lOp to produce.
we fix the selling price at 20p.
How many people will buy the magazine? How much money will be raised by selling the magazine, (the 'revenue')? How much will these magazines cost to produce? How much actual profit will therefore be made? Draw up a table of data which shows how the revenue, production and profit all vary with the selling price of the magazine.
*
costs
Draw a graph from your table and use it to decide on the best selling price for the nlagazine.
159
SOLUTIONS
TO "PRODUCING A MAGAZINE"
This situation begins with a fairly open ended graph sketching activity, which should help pupils to become involved in the situation, and moves on to consider two specific economic problems-how can profit be maximised without and then with production costs.
1.
Some possible relationships
which can be described are illustrated below:
t hours
"The more writers there are, the less time it will take." w writers
w writers
"The longer the magazine, the more writers needed." / pages
n people "The more you charge, the fewer that will buy." spence
p pence
"No profit will be made on a free magazine, or on a magazine which is too expensive for anyone to buy. In between these extremes lies the optimum". spence
n people
"A small amount of advertising may affect the sales considerably, but larger amounts will have a relatively diminishing effect due to "saturation". a pence
There are, of course, other possibilities. 160
2. When pupils plot a graph to illustrate how the 'number of people prepared to buy the magazine' (n people) varies with selling price (s pence), they should obtain a graph which approximates to the straight line n = 100 - 2s. 120 100 ~
Number prepared to pay this pnce
~
80
"" '"
60
~
40
'" ~
'"
20
j~
'"
0 10 20 30 40 Selling price of magazine (pence)
50
The profit made for various selling prices can be found by multiplying values of n by corresponding values of s:
Selling price (s pence) Number
prepared
to pay this price (n people)
Nothing
10
20
30
40
100
82
58
40
18
0
820
1160
1200
720
Profit made (p pence)
This will lead to the graph shown below, from which the optimum selling price, 25 pence, and the corresponding profit, £12.50, can be read off. £15
.... /J" /'
£10
"-
/ ./
Expected Profit
""'-
/
£5
""
" '" ~
/
/
'\.
V
,
/ / / II
o
10
20
30
40
Selling price of magazine (pence) 161
50
the profit made (p pence) is approximately given by p = ns = (100 - 2s)s. This can be differentiated to find the optimum selling price). (Algebraically,
3.
The final problem involves taking account of production costs. The table drawn above can now be adapted to give:
Selling price (s pence) Number
prepared
Revenue
(r pence)
Production Profit ((p
to pay this price (n people)
costs (c pence) =
Algebraically
r - c) pence)
we now have: n = 100 - 2s
Nothing
10
20
30
40
100
82
58
40
18
0
820
1160 1200
720
1000
820
580
400
180
-1000
0
580
800
540
(as before)
r = ns
(the revenue is obtained by multiplying the price of each magazine by the number sold at that price).
c = IOn
(each magazine costs lOp to produce, so the production costs for n magazines is IOn).
p=r-c
(the profit made = revenue - production costs).
These can be combined to give p
= ns - IOn = n (s - 10) = (100 - 2s) (s - 10)
Which results in the graph shown opposite. From this graph, it would appear that the selling price of each magazine should now be 30 pence, resulting in an expected profit of £8.00.
162
£10 Expected Profit
./
...•..••.•. ~
~ ~
/
£5 ~
""
~
,,-/
~
/
"
/
o
J,
7
/10 /
20
/
II
-£5
/ /
/
-£10
r\
/
I
163
30
40
Selling Price
·,·,,,,·~ e ..
1"-:,
.~
THE FFESTINIOG RAILWAY This railway line is one of the most famous in Wales. Your task will be to devise a workable 'timetable for running this line during the peak tourist season. The following facts will need to be taken into account:-
*
There are 6 main stations along the 131/2 mile track:
Blaenau Ffestiniog
(The distances between them are shown in miles)
Z
Tan-y-Bwlch
4314
~ 2
*
Three steam trains are to operate a shuttle service. This means that they will travel back and forth along the line from Porthmadog to Blaenau Ffestiniog with a 10-minute stop at each end. (This should provide enough time for drivers to change etc.)
*
The three trains must start and finish each day at Porthmadog.
*
The line is single-track. This means that trains cannot pass each other, except at specially designed passing places. (You will need to say where these will be needed. You should try to use as few passing places as possible.)
*
Trains should depart from stations at regular intervals if possible.
*
The journey from Porthmadog to Blaenau Ffestiniog is 65 minutes (including stops at intermediate stations. These stops are very short and may be neglected in the timetabling).
*
The first train of the day will leave Porthmadog
*
The last train must return to Porthmadog by 5.00 p.m. (These times are more restricted than those that do, in fact, operate.)
164
at 9.00 a.m.
THE" FFESTINIOG RAILWAY" ... SOME HINTS Use a copy of the graph paper provided to draw a distance-time 9.00 a.m. train leaving Porthmadog.
graph for the
Try to show, accurately: • • • •
What train? How Draw How From
The The The The
outward journey from Porthmadog to Blaenau Ffestiniog. waiting time at Blaenau Ffestiniog. return journey from Blaenau Ffestiniog to Porthmadog. waiting time at Porthmadog ... and so on.
is the interval between departure
times from Porthmadog
for the above
can we space the two other trains regularly between these departure times? similar graphs for the other two trains. many passing places are needed? Where will these have to be? your graph, complete the following timetable:
Miles
Daily Timetable
Station
0
Porthmadog
d
2
Minffordd
d
3%
Penrhyn
d
7V2
Tan-y-Bwlch
d
12%
Tanygrisiau
d
13%
Blaenau Ffestiniog
a
0
Blaenau Ffestiniog
d
1%
Tanygrisiau
d
6
Tan-y-Bwlch
d
10%
Penrhyn
d
11V2
Minffordd
d
13V2
Porthmadog
a
09.00
Ask your teacher for a copy of the real timetable, compares with your own.
165
and write about how it
o _ ..•... -or-I----+--4--~-_+___1'-~-4_-~I__-~-~'---_._-__+--+~ M
o
1--t--~---+--4--~-_+__+-~-_+_-~f__-_+_-+_i--_t_-__t--_t_~ M
t=:t=::::::t:::t==::::t==4:=~;:::=~~4==~=:4=::::4=~+==+==+==l-~ M
--o ..S::: :-....•. --...~ u
•..... -+--+-+--+---+---+---+--+-+__--+--~f__-_+_-+_t--_t_-__T--_t_~
~ .
M
.
~
o
'
~+_-t-+--+---+--+---+--+-+----+--~I__-_+_-+_+--_+_-_+--
..•.. O ("f') >-..
en.:
:. '1-CD:.
U' .........•••
o
M
ro Q 4-<
o
Q)
8
gE:
~-+--+-+--+----+--+---+--+-+---+--+----+--+-I--.....----+--+N
M
o ~+--t-+--+---+--+---+--+-+----+---I----+--+-+---+----+---+S M
o o M
+--+--+-+---+--__+---+---+--I~+---+--+_-_+-_+_~-
..•.. -__lf__-.•.•. O
0 0 0.0
0
:5.•...
0'\ ('f')
N
M
;:jM
.~VJ
M M
0 M
0'\
OO....c:: t--
~
'C
0.0
..CO
c C'j
c ro
G:
>...
~
If)
("f')
"T
N
u
~ ~ >...
r.F1
\0
c >... ..c
I
>-<
I
c Q) ~
~
(s~l!w) ~opBwqllod
166
W01J
~JuBls~a
'"0 '"0 >-<
@
c
~
M
0.00
0
'"0
ro 8 ....c
.•... >-<
0
~
C)
0 0 --
0 •••••
~
C)
e:: -~
0 UI -C CI>
c::" •••••
ca •• LL E :::s .t: ca ~ le:: 0 CI> c.. ca m
--... en
"Q)
-
~
~1! ,
II)
co
~
,...
j1)
0)
-co Q)
.c
ttYl
!l
•••• Q)
E .••••
11
ic
>-z a: :::2;
0::> ZI-
oW
> w Z o :E ~
::J o ~ ~
o u. en w ..J :E w ~ o :E
w
z
::J
t-
en < o o
c z <
en w ~
< ..J
enz C(
t-
Z
::J
o :E
"0 (j)
:J C
o
:
c.l
I I I
oa: w
C
o
u (j)
..c
>a:z «a: z::>
otu ~a: >a:w
<:--' Z(9
o~ a:UJ o
0000
CDo:to:tao
lriMC"'i"': c.lc.lc.lc.l
Monday 15 July to Friday 30 August (Also Spring Holiday Week Sunday 26 May to Thursday 30 May) MONDAYS TO THURSDAYS ---------------,
____ ------------
--
.----------.
__
.-------------1
0950 1035 1125 1220 1310 1400 1455 1545 1635 f=::;c=====~~===+"""~~====0~93=8=====1=,-3==5==---~ 1008
0959 1005 1025 1043 1055 ••••••••• ~===
======J
1400 1433 1343 1422
1500 1530
1504 1510 1530 1548 1600
1554 1600 1620 1641 1652
1205 0955 1040
0817 0901
1044 1050 1112 1135 1146
1155 1237
1134 1140 1205 1223 1233
1229 1235 1255 1313 1325 1330 1431 143'--
1105 1204 1214 ------0950 1000 1100
1319 1325 1345 1407 1417
1409 1415 1435 1458 1507
1155 1201 1225 1245
1644 1650 1710 1728 1740 2020 2117 2127
1105,0 1204'0 1214FO
1333 1343 1445
1450 1501 1609
1630 1640 1741
1745 1803 1903
0830 0950'0 0840 1000FO 0940 1100'0
1520 1526 1550 1606
1615 1621 1640 1659
1340 1346 1405 1424
1430 1436 1500 1520
1330 1431 1441 1110 1121 1224
1700 1706 1730 1746
1746 1752 1814 1830
1433 1514
Bntish
Rail Coast
line
SERVICE
d a
0755 0825
Barmouth Mlnffordd
d. a.
0817 0901
d.
Mlnffordd Pwllhe//
d.
1834 1901
'!1
1/1
8~
9
?l
t))
Beddgelert Pont
Aberglaslyn
J
•••••
P"ct,,,
1205 1246
1530 1616
2212 2239
1325 1353
1606 1533
1710 1751 1834 1901
'i344107~~ ')\ _
R Giasi/il
•••••..
National
th
G
'-9 t
J
=*'
TOL
-~O:~OC/~LC)DG~~-~~ /
I
p~
---.J~
•• -, ~
••
Stwlan
(
P
M08S
J-
T':N-V-BWLCH nature
=!:ill
FR.
:470
~
~~
-
~
)
~YArmS'"
~~
Hotel
~~~o
------.
".
~
~"'\....-~
~~::~6
/
/' _fiQ91
~
'.
~
l~
-.. B4391
Ffestln~
Bala
A5
A47C
T
.!!.§!!f!11g9~.""..... ·
..•. S .. '1\\
handslgnal to the driver. All trains other than the 0840 ex. Porthmadog will also call on request at Boston Lodge, PIas and Dduallt.
}
Y~
trail
~~
Maentwrog
j
.!)
(~AA4'496
~
A48~
~11~~~Wf'dd Caverns
Station
~--"'~/'--
~0.rpower~~.\\\~",
,,'
J;Y
liD.. Powe<
·t:lilW.-G!!!!ll!!!liltp;!iJii II
and Barmoulh
,~
1(7/
TANYGRIS ....IAU~ ~~_
(~
'V
, /f ·_ ...
Harlech
1450
.
-~--!enr~:::udraeth
~::
I ~~~
1901
FFESTINIO. G
Llyn
~~
pmtm~on
1533
Park
_
P ""
1450
-dCeg
.. \.,,,
~~ •••
1205 1530 1710 1530 1246 1616 1751 1616 ~-------:16;;-;;c06O:----;c18=34c-i--;c,4=22:o-------:-~--1
BLAENAU Snowdonia
/
MINFFORD;ENRHVN~
or
1955 2033
A4085
PORTHMADOG~
/. V
1710 1751
SATS. & SUNS. to Sunday 3 Nov.
I
~
1611 1706 1835
DAILY Monday 16 Sept.
(~
;'f
~<~s~~~~
A487
2\~
1746 1752 1814 1830
• 1625 1719 1848 1207 1442 1717 1207 1442 171711332 1717
a. 1209
~~~~~98
B
I
1710 1751
&
~*
1615 1621 1640 1659
4QJ>~455 1635 10950 1220 _~_~5 0950 1220
1~
1205 1246
8.
Caernarton
," I
1530 1616
, 1520 • 1526 1550 1606
d. 1025 d. 1043 a. 1055
J8~~
'I
1630 1640 1741
d. 0959
A4 1 A487
1501 1609
d. 1005
Mlnffordd Barmouth
2 A497
1748 1845 1903
--------------,----------1
Pwllheli Mlnffordd
Porthmadog
1625 1726 1736
1834 1901
MONDAYS TO FRIDAYS
PorthlTladog--.!!. 0-95-0---1125
(S~on~~~~~I~W)
1340 1429
I
Saturday 31 August to Sunday 15 September
AUTUMN AND WINTER
Cambnan
1340 1346 1405 1424
1955 2036
1606 1633
1450
1644 1650 1710 1728 1740
1209 1304 1354 1444 1539 1629 1719 1805 1848
I
Minffordd Penrhyn Tan-y-Bwlch Tanygrisiau BI. Ffestiniog
1710 1751
1530 1616
1343 1445
1245 1251 1315 1335
1154 1250 1340 1429 1525 1611 1706 1751 1835 1205 1246 1237 1305
1450 1548 1558 --'~1450
1504 1510 1530 1548 1600
=::;;;;~;;;j===;;;;,;;~;;;==._==-==;;;;~;;;;;;========j
----
1245 1251 1315 1335
1247so 1325so
• 1409 1415 1435 1458 1507
1748 1845 1903
----------------
1105 1111 1133 1149
1155FO 1237,0
1625 1726 1736
1450 1548
__~~L __.__
1110 1121 1224
1520 1606
Every effort possible will be made to ensure running as timetable but the Ffestiniog Railway will not guarantee advertised connections nor the advertised traction in the event of breakdown or other obstruction of services. Special parties and private charter by arrangement. Please apply to: FFESTINIOG RAILWAY HARBOUR STATION PORTH MADOG GWYNEDD Telephone: PORTH MADOG (0766) 2340/2384
FATHER CHRISTMAS EXCURSIONS A special service will operate on 21 and 22 December. Details available from 1 October. Father Christmas will meet the trains and distribute presents to the children. All seats reservable - Advance Booking Essential.
b~~'~~'f\::;d:~"","
by Narrow Gauge Train through the Mountains of Snowdonia
SOLUTIONS TO "THE FFESTINIOGRAILWAY" The graph below satisfies all the criteria. Two passing places are needed, situated at approximately 4.2 miles and 9.4 miles from Porthmadog. Trains depart from the stations at regular, 50 minutes intervals.
1------..........--- ..•.......• --.....,......,...---........--.----__..----__._....----
Bl. Flestiniog
------1
13 Tanygrisiau 12 11
~ ~ ~
10
(/l
9
OJ)
o
-0
6 o
-5
8
Tan-y- Bw lch
I----f-----+--+---+--+-----i----+---+----\----+---\----f--I,...-----t------I
7
0..
8
6
E
5 4 Penrhyn 3 Minffordd
2 +-+-----J'-----J---+---/---+--+---+---+---+---+---+----+-----\--------i-
i---.........,--~....,......Io----.-I...•.. -
Porthmadog
0900
1000
1100
p-'---.•••. -- .•.......•... -..a--
1200 1300 Time of Day
1400
1500
1600
This gives us the following timetable: Miles
Station
Daily Timetable
0
Porthmadog
d
09.00 09.50 10.40 11.30 12.20 13.10 14.00
2
Minffordd
d
09.10 10.00 10.50 11.40 12.30 13.20 14.10
3%
Penrhyn
d
09.15 10.05 10.55 11.45 12.35 13.25 14.15
71J2
Tan-y-Bwlch
d
09.35 10.25 11.15 12.05 12.55 13.45 14.35
12%
Tanygrisiau
d
10.00 10.50 11.40 12.30 13.20 14.10 15.00
131J2
Blaenau Ffestiniog
a
10.05 10.55 11.45 12.35 13.25 14.15 15.05
Blaenau Ffestiniog
d
10.15 11.05 11.55 12.45 13.35 14.25 15.15
1%
Tanygrisiau
d
10.20 11.10 12.00 12.50 13.40 14.30 15.20
6
Tan-y-Bwlch
d
10.45 11.35 12.25 13.15 14.05 14.55 15.45
10%
Penrhyn
d
11.05 11.55 12.45 13.35 14.25 15.15 16.05
111f2
Minffordd
d
11.10 12.00 12.50 13.40 14.30 15.20 16.10
131f2
Porthmadog
a
11.20 12.10 13.00 13.50 14.40 15.30 16.20
0
169
_ __+ 1700
CARBON DATING Carbon dating is a technique for discovering the age of an ancient object, (such as a bone or a piece of furniture) by measuring the amount of Carbon 14 that it contains. While plants and animals are alive, their Carbon 14 content remains constant, but when they die it decreases to radioactive decay.
The amount, a, of Carbon 14 in an object t thousand years after it dies is given by the formula: a = 15.3 x 0.886
t
(The quantity "a" measures the rate of Carbon 14 atom disintegrations is measured in "counts per minute per gram of carbon (cpm)") 1
and this
Imagine that you have two samples of wood. One was taken from a fresh tree and the other was taken from a charcoal sample found at Stonehenge and is 4000 years old. How much Carbon 14 does each sample contain? (Answer in cpm's) How long does it take for the amount of Carbon 14 in each sample to be halved? These two answers should be the same, (Why?) and this is called the half-life of Carbon 14.
2
Charcoal Estimate paintings
from the famous Lascaux Cave in France gave a count of2.34 cpm. the date of formation of the charcoal and give a date to the found in the cave.
3
Bones A and B are x and y thousand years old respectively. Bone A contains three times as much Carbon 14 as bone B. What can you say about x and y?
170
CARBON DATING ... SOME HINTS U sing a calculator, draw a table of values and plot a graph to show how the amount of Carbon 14 in an object varies with time.
t
2
1
0
(1000's of years)
3
4
5
6
7
8
9
10
10
11
12
13
14
... 17
a (c.p.m)
15 t:::
~ on -----
S 0..
0 '-'
•.... 0 Q)
10
'-' .D 0
c:: .....• -.:::t
.....-I
c:: 0 .D H
ro
U
4-<
0
5
•.... c::
::j
0
S ~
o
1
2
3
4
5
6
7
8
9
Age of object (in 1000's of years) = t
Use your graph to read off answers to the questions.
171
15
16
17
SOLUTIONS
TO "CARBON DATING"
If pupils have difficulty with the exponential notation used in this worksheet, then refer them back to booklet B3, "Looking at exponential functions", where there are similar items in the context of "Hypnotic drugs". The following table and graph both illustrate how the amount of Carbon 14 in an object decays:
Age of object (1000's of years.)
Amount of C14 (cpm/g)
0
15.3
9
5.15
1
13.56
10
4.56
2
12.01
11
4.04
3
10.64 9.43
12
3.58
13
3.17
14
6
8.35 7.40
15
2.81 2.49
7
6.56
16
8
5.81
17
4 5
15 r\ \:::l
II
\
\
Amount of C14 (cpm/g)
Age of object (1000's of years)
2.21 1.95
1\
\ '~
"""
'" "" ""
"" ""
~
"'"
"" ~~ ~
o
1
2
3
4
5
6
7
8
9
-------
10
----- r---
11
12
Age of object (in 1000's of years) = t 172
13
-r---- r---
14
15
--
16
17
1.
The fresh wood will contain 15.3 cpm's of Carbon 14. The Stonehenge
sample will contain 9.43 cpm's of Carbon 14.
In each case, the quantity of Carbon 14 will be halved after a further 5,700 years, approximately. (Pupils with no knowledge of logarithms will have to discover this graphically, or numerically by trial and error.) 2.
The charcoal from the caves is about 15,500 years old, and so the paintings date back to approximately 13,500 BC.
3.
The relationship y = x + 9 is approximately life of C'arbon 14 is approximately 9 years).
173
true. (In other words, the 'third'
DESIGNING A CAN
A cylindrical can, able to contain half a litre of drink, is to be manufactured aluminium. The volume of the can must therefore be 500 cm3•
from
Find the radius and height of the can which will use the least aluminium, and therefore be the cheapest to manufacture. (i.e., find out how to minimise the surface area of the can). State clearly any assumptions
*
you make.
What shape is your can? Do you know of any cans that are made with this shape? Can you think of any practical reasons why more cans are not this shape?
174
DESIGNING A CAN ...
*
SOME HINTS
You are told that the volume of the can must be 500 cm3• If you made the can very tall, would it have to be narrow or wide? Why? If you made the can very wide, would it have to be tall or short? Why? Sketch a rough graph to describe how the height and radius of the can have to be related to each other.
Let the radius of the can be r cm, and the height be h cm. Write down algebraic expressions which give -
the volume of the can
-
the total surface area of the can, in terms of rand h. (remember to include the two ends!).
U sing the fact that the volume of the can must be 500 cm3, you could either: - try to find some possible pairs of values for rand h (do this systematically if you can). - for each of your pairs, find out the corresponding
surface area.
or: - try to write one single expression for the surface area in terms of r, by eliminating h from your equations.
Now plot a graph to show how the surface area varies as r is increased, and use your graph to find the value of r that minimises this surface area.
Use your value of r to find the corresponding value of h. What do you notice about your answers? What shape is the can?
175
SOLUTIONS
TO "'DESIGNING
A CAN"
Most pupils will probably find it more natural to begin by evaluating possible pairs of values for the radius (r em) and height (h em) of the can using
v=
11"
r2h
h
<:?
-CD
= 500 =
500 11"r2
and then evaluate the corresponding
A
= 211" rh
<:?
This approach
(em)
+
211"r2
+
= 211"r (r
-
@
h)
will result in the following kind of table:
0
1
h (em)
00
159
A
00
1006
r
A
surface areas using
2
3
4
5
6
7
8
9
10
39.8
17.7
9.9
6.4
4.4
3.3
2.5
2
1.6
525
390
350
357
393
450
527
620
728
A more sophisticated approach with more algebraic manipulation, but less numerical calculation, involves substituting 11"rh = 500 (fromeD) into@, obtaining: r
A = 1000 + 211"r2 r
(This removes the need to calculate intermediate This table results in the graph shown opposite.
176
values for h in the table.)
1000 Surface area (cm
2 )
\
800
\ \
600
/
\
~
./
'-
400 ----
200
\.
/
/
~
"V
V
[7
-'------
o
1
2
3
4
5
6
7
8 Radius
9
10 (cm)
The minimum surface area is therefore approximately 350 em3 (more exactly, 349 cm3) and this occurs when the radius is 4.3 cm and the height is 8.6 em. This means that, when viewed from the side, the can is 'square'. (Notice that it makes very little difference to the surface area used if the radius varies between 3 cm and 6 em.) Narrower cans are much easier to hold and this may partly account for the reason why so few 'square' cans are marketed.
177
MANUFACTURING A COMPUTER Imagine that you are running a small business which assembles and sells two kinds of computer: Model A and Model B (the cheaper version). You are only able to manufacture up to 360 computers, of either type, in any given week. The following table shows all the relevant data concerning your company: Job Title
N umber of people doing this job
Assembler
100
Inspector
4
Job description This job involves putting the computers together This job involves testing and correcting any faults in the, computers before they are sold
I
the employees at
Pay
Hours worked
£100 per week
36 hours per week
£120 per week
35 hours per week
The next table shows all the relevant data concerning the manufacture computers. Model A
of the
ModelB
Total assembly time in man-hours for each computer
12
6
Total inspection and correction time in man-minutes for each computer
10
30
I
I
Component
costs for each computer
Selling price for each computer
I
At the moment, you are manufacturing of Model B each week.
£80
£64
£120
£88
and selling 100 of Model A and 200
*
What profit are you making at the moment?
*
How many of each computer worrying situation?
*
Would it help if you were to make some employees redundant?
should you make in order to improve this
178
MANUF ACTURING A COMPUTER ... SOME HINTS 1
2
Suppose you manufacture
100 Model A's and 200 Model B's in one week:
*
l-Iow much do you pay in wages?
*
How much do you pay for components?
*
What is your weekly income?
*
What profit do you make?
Now suppose that you manufacture each week.
*
x Model A and y Model B computers
Write down 3 inequalities involving x and y. These will include: - considering the time it takes to assemble the computers, and the total time that the assemblers have available. - considering the time it takes to inspect and correct faults in the computers, and the total time the inspectors have available.
Draw a graph and show the region satisfied by all 3 inequalities:
Number of Model B computers manufactured (y)
200 t-++++++++~H+H++++++++++-++-I+t-H++H++++++
a Number 3
100
200
400
of Model A computers manufactured
(x)
Work out an expression which tells you the profit made on x Model A and
y Model B computers. 4
300
Which points on your graph maximise your profit?
179
SOLUTIONS 1
TO "MANUFACTURING
The wage bill per week is The components
A COMPUTER"
£100 x 100 + £120 x 4 = £10,480
bill for 100 Model A's and 200 Model B's is £80 x 100 + £64 x 200 = £20,800
The weekly income from selling the computers is £120 x 100 + £88 x 200
£29,600
=
The overall profit is therefore £29,600 - £20,800 - £10,480 = - £1680 So under the currentpolicy, 2
the business is making a loss of £1680 per week!
If x model A and y model B computers are made, Since only a rnaximum of 360 computers can be made each week
x + y ~ 360
(I)
-------
The time taken in hours to assemble the computers is 12x + 6y The time available for the assemblers is 100 x 36 = 3600
}
The time taken in minutes to inspect the computers is lOx + 30y The time in minutes available for inspection is 4 x 35 x 60 = 8400
}
l2x + 6y ~ 3600 =>
2x + y ~ 600
lax + 30y ~ 8400 =>
x
+ 3y ~ 840
I n the graph below, we have shaded out the regions we don't want:
400
Number
300
of
Model B computers manufactured (y)
200
lOot
L
a
p = 1520 100
200
300
400
Number of Model A computers manufactured 180
(II)
(x)
(III)
3
The profit £p made on x model A and y model B computers is given by: p = (120x
= 4
40x
+
+
88y) - (80x 24y - 10,480
+
64y) - (100 x 100 - 120 x 4)
The maximum profit of £2000 per week occurs when 240 Model A and 120 Model B computers are produced each week. (In this case, it is interesting to note that one inspector is not needed. If he or she was made redundant this would increase the profit by a further £120 per week).
181
THE MISSING PLANET 1. In our solar system, there are nine major planets, and many other smaller bodies such as comets and meteorites. The five planets nearest to the sun are shown in the diagram below. .,.
..~.~:-':.
•
",.
"
Mars
(Jj'.,
o
'
, :. ::~:::.~: '. Asteroids ,
~CIDrcurY
• ..1'0
. ~.":' ..
~ •.......: ~..' .. .--".. ,":
Venus
. ..
••
"·e
_
'
Sun
Earth
.
•
;'
.•
.~.):>; ... .
,
•. •. ,:
..
., ..
.
.. ~..... ....• . "
.
". _
"
'
'
. .
Jupiter
. .~.\~. ::...
Between Mars and Jupiter lies a belt of rock fragments called the 'asteroids'. These are, perhaps, the remains of a tenth planet which disintegrated many years ago. We shall call this, planet 'X'. In these worksheets, you will try to discover everything you can about planet 'X' by looking at patterns which occur in the other nine planets. How far was planet 'X' from the sun, before it disintegrated? The table below compares the distances of some planets from the Sun with that of our Earth. (So, for example, Saturn is 10 times as far away from the Sun as the Earth. Scientists usually write this as 10 A.U. or 10 'Astronomical Units').
*
Can you spot any pattern in the sequence of approximate relative distances.
*
Can you use this pattern to predict the missing figures?
*
So how far away do you think planet 'X' was from the Sun? (The Earth is 93 million miles away)
*
Check your completed table with the planetary data sheet. Where does the pattern seem to break down?
Relative Distance from Sun, appro x (exact figures are shown in brackets)
Planet
?
~1ercury Venus
0.7
(0.72)
Earth
1 1.6
(1) (1.52)
Mars
?
Planet X Jupiter
I
5.2
(5.20)
Saturn
10
(9.54)
Uranus
19.6
(19.18)
Neptune
?
Pluto
?
182
o
o
o
1-----+----------------1 o C ~ .•...• C 0
I r/) I-;
~
C
~
;:j
8
;:j
o ...c=
o ...c=
0
~.s. Q)
r/) I-;
;:j
Q)"O
I-;
00
N
tn
o
~
rl
r/)
o o t-00 00
o
o 00
o
~
o
o o
o t--
N N
~
~
f------l--------------------------
l-J
J~ 183
o
THE MISSING PLANET ... SOME BACKGROUND INFORMATION
In 1772, when planetary distances were still only known in relative terms, a German astronomer named David Titius discovered the same pattern as the one you have been looking at. This 'law' was published by Johann Bode in 1778 and is now commonly known as "Bode's Law". Bode used the pattern, as you have done, to predict the existence of a planet 2.8 AU from the sun. (2.8 times as far away from the Sun as the Earth) and towards the end of the eighteenth century scientists began to search systematically for it. This search was fruitless until New Year's Day 1801, when the Italian astronomer Guiseppe Piazzi discovered a very small asteroid which he named Ceres at a distance 2.76 AU from the Sun-astonishingly close to that predicted by Bode's Law, (Since that time, thousands of other small asteroids have been discovered, at distances between 2.2 and 3.2 AU from the sun.) In 1781, Bode's Law was again apparently confirmed, when William Herschel discovered the planet Uranus, orbitting the sun at a distance of 19.2 AU , again startlingly close to 19.6 AU as predicted by Bode's Law. Encouraged by this, other astronomers used the 'law' as a starting point in the search for other distant planets. However, when Neptune and Pluto were finally discovered, at 30 AU and 39 A U from the Sun, respectively, it was realised that despite its past usefulness, Bode's 'law' does not really govern the design of the solar system.
184
THE MISSING PLANET 2. Look at the Planetary
data sheet, which contains 7 statistics for each planet.
The following scientists are making hypotheses about the relationship between these statistics:
A
@
The further a planet is away from the Sun, the longer it takes to orbit the Sun.
B
C
G
(0
•••
:>
The smaller the planet the slower it spIns.
~
*
Do you agree with these hypotheses? sheet)
*
Invent a list of your own hypotheses. Sketch a graph to illustrate each of them.
How true are they? (Use the data
One way to test a hypothesis is to draw a scattergraph. This will give you some idea of how strong the relationship is between the two variables. For example,
here is a 'sketch' scattergraph
testing the hypothesis of scientist A:
Notice that: There does appear to be a relationship between the distance a planet is from the Sun and the time it takes to orbit once. The hypothesis seems to be confirmed. We can therefore predict the orbital time for Planet X. It should lie between that of Mars (2 years) and Jupiter (12 years). (A more accurate statement would need a more accurate graph. )
/
Distance from sun •
Sketch scattergraphs to test your own hypotheses. out about Planet X? What cannot be found?
185
What else can be found
THE MISSING PLANET 3. After many years of observation the famous mathematician Johann Kepler (1571-1630) found that the time taken for a planet to orbit the Sun (T years) and its average distance from the Sun (R miles) are related by the formula
where K is a constant value.
*
Use a calculator to check this formula from the data sheet, and find the value ofK. Use your value of K to find a more accurate estimate for the orbital time (T) of Planet X. (You found the value of R for Planet X on the first of these sheets).
*
We asserted that the orbits of planets are 'nearly circular'. Assuming this is so, can you find another formula which connects -
The average distance of the planet from the Sun (R miles)
-
The time for one orbit (Tyears)
-
The speed at which the planet 'flies through space' (V miles per hour)? (Hint: Find out how far the planet moves during one orbit. You can write this down in two different ways using R, T and V) (Warning: Tis in years, V is in miles per hour)
planet
Use a calculator to check your formula from the data sheet. Use your formula, together with what you already know about Rand T, to find a more accurate estimate for the speed of Planet X.
*
Assuming connecting
that
the planets
are spherical,
can you find a relationship
-
The diameter of a planet (d miles)
-
The speed at which a point on the equator spins (v miles per hour)
-
The time the planet takes to spin round once (t hours)?
Check your formula from the data sheet.
186
SOLUTIONS
TO "THE MISSING PLANET"
Sheet 1 The following pattern planets to the sun: 0.55
0.7
~~~~~~~~"'-J +0.15
+0.3
may be used to predict the relative distances of the various
1
1.6 +0.6
2.8 +1.2
5.2 +2.4
10 +4.8
19.6 +9.6
38.8 +19.2
77.2 +38.4
This pattern predicts that Planet X is 2.8 x 93 million miles (= 260.4 million miles) from the sun. The background information sheet describes how this pattern was originally used to predict the positions of asteroids and other planets. The actual, more precise sequence is: 0.39,
0.72,
1, 1.52, 2.9, 5.20, 9.54,
19.18, 30.1,
39.5.
This shows that the pattern seems to break down for Mercury, Neptune and Pluto. It is interesting to note that if there was no Neptune then the pattern would fit more closely. Sheet 2 Scientist A is making a statement which is always true. Scientist B is making a statement which is often true. Scientist C is making a statement which is never true. If we denote the 7 variables on the data sheet by R, d, V, v, T, t, and m respectively, then there will be strong correllations within the group of variables R, Vand T and \vithin the group d, v and t, but no correllations between members of the different groups. Variable m does not correllate strongly with any other variable. We have only found data concerning R for planet X. The scattergraph therefore only produce additional information regarding Vand T.
method will
Sheet 3 From the data sheet, it can be seen that for every planet R3 = 8.06 P
X
1023 (± 0.5%)
Where R = the average distance from a planet to the sun in miles and T = the time taken for a planet to orbit the sun in years Using 260.4 million miles (= 2.604 X, we obtain its orbital period as
T=
(2.604 8.06
X X
108)3
=
X
108 miles) as the estimated distance of planet
4.68 years or 4 years 8 months
23
10
(The working would have been easier if R was taken to be in millions of miles, giving k as 806000) 187
Assuming
that the planetary orbits are nearly circular, then we obtain: C = 2-rrR C = 8760VT
where C
=
circumference
of one orbit in miles
V = speed at which a planet moves through space in miles per hour. (The figure 8760 is a conversion factor from miles per hour to miles per year.) One way of checking these formula from the data sheet is by evaluating 8760VT 2-rrR for each planet. If the orbits are circular we should then find out that our answers are all equal to unity. (In fact we find that the values have a mean of about 0.998). The speed of planet X can now be found by substituting R = 2.604 X 10⁸ into V = 2TIR :::::: 40,000 (mph) 8760T
Assuming
T
=
4.68,
that the planets are spherical, then we should find that TId =
vt
where d
=
diameter of the planet
v
=
speed at which a point on the equator spins
t
=
time for the planet to rotate once
This checks quite nicely with the information
188
presented on the data sheet.
1~9
GRAPHS AND OTHER DATA FOR INTERPRETATION The following section contains a miscellaneous collection of shorter situations which are intended to provide additional practice at interpreting data. We hope that this material will provide you with a useful resource which can be dipped into from time to time. Solutions have not been provided for this section.
190
FEELINGS These graphs show how a girl's feelings varied during a typical day. Her timetable
I
7.00 8.00 9.00 9.30 10.30 11.00
I I I I
l
for the day was as follows:
l
woke up went to school Assembly Science Break Maths Lunchtime Games Break French went home did homework went H)-pin bowling
am am am am am am
12.00 am 1.30 pm 2.45 pm
i
3.00 pm 4.00 pm 6.00 pm 7.00 pm IO.30pm
I
l
went to bed
~
Happy
(a)
Try to explain the shape of each graph, as fully as
"0
o o
possible.
~ Sad I
I
I
I
I
I
I
I
I
I
I
I
I
I
I
(b )
~
-i
I
6 7 8 9 10 11 12 1 2 3 4 5 6 7 8 9 1011 Time of day Full of energy \
>.
\
bJj I1)
C
~ Exhausted
f----4-+
I
I
I
6
7 8 9 10 11
I
I
I
I
I
I
I
-+---l
I
6 7 8 9 10 11 12 1 2 3 4 5 Time of day Full
0
I1)
C
:=l
::r::
i
lV1ake up some more questions like these, and give them to your neighbour to solve.
rv
up
bJj
I
(c)
Starving t
I
I
I
I
I
I
I
I
I
t
6 7 8 9 10 11 12 1 2 3 4 Time of day
I
~~I
I
I
5 6 7 8 9 10 11
191
How many meals did she eat? Which meal was the biggest? Did she eat at breaktimes? How long did she spend eating lunch? Which lesson did she enjoy the most? When was she "'tired and depressed?"Why was this? When was she "'hungry but happy?" Why was this?
Sketch graphs to show how your feelings change during the day. See if your neighbour can interpret them correctly.
THE TRAFFIC SURVEY
A survey was conducted to discover the volume of traffic using a particular road. The results were published in the form of the graph which shows the number of cars using the road at any specified time during a typical Sunday and Monday in June.
1.
Try to explain, as fully as possible, the shape of the graph.
2.
Compare
3.
Where do you think this road could be? (Give an example of a road you know of, which may produce such a graph.)
Sunday's graph with Monday's.
What is suprising?
900 800 ""d
ro
0
~
700
+-'
c
Q
600
if)
U
:.c
500
>
4--<
0
~Q.)
400
.D
E ~ Z
300 200 100
o t
Midnight
I.
2
4
6
8 10 12 2 4 t
Noon
Sunda y
6
8 10 12 2 t
4
6
Midnight
----------1+r-----192
8 10 12 2 4 t Noon
Monday
6
8 10 12 f
l'.1idnight -------------l~
THE MOTORW AY JOURNEY
8
,'-
7 ~
V1
..9I:: 6 -; bI) "-" H
~
5
'-~
,,
~
ro
u
>--. 4
8
~ ......
~
"0 3 H
~ ""'"
+-' It)
p.,
2
"-
" , ~
"
""""
~
"""
~
1
a
,"-
50
"""
""'!
, 100
150
200
250
Distance travelled in miles The above graph shows how the amount of petrol in my car varied during a motorway journey. Write a paragraph to explain the shape of the graph. In particular answer the following questions: 1
How much petrol did I have in my tank after 130 miles?
2
My tank holds about 9 gallons. Where was it more than half full?
3
How many petrol stations did I stop at?
4
At which station did I buy the most petrol? How can you tell?
5
If I had not stopped anywhere, where would I have run out of petrol?
6
If I had only stopped once for petrol, where would I have run out?
7
How much petrol did I use for the first 100 miles?
8
How much petrol did I use over the entire journey?
9
How many miles per gallon (mpg) did my car do on this motorway?
I left the motorway, after 260 miles, I drove along country roads for 40 miles and then 10 miles through a city, where I had to keep stopping and starting. Along country roads, my car does about 30 mpg, but in the city it's more like 20 mpg. 10
Sketch a graph to show the remainder
193
of my journey.
GROWTH CURVES Paul and Susan are two fairly typical people. The following graphs compare how their weights have changed during their first twenty years.
80 I
70 v;
I
E 60 ro •...
I
b1)
0
~
.5 •.... ..c
I
I
I
50
i
~
/
~-l
_/
/ / _. i
30 /"
20
10
"
v
1/ .....V .-
~~
~
~~
o
v
-r
//
I-
/
--
/
-'
l
1/
/, L- -~
./
40
/V
I
I
I
I
,/
V
I
;'
/1
,f
~
/
I I
b1) (J.)
I
Paul Susan----
--1---
J
~
i
\
L
-------L...-
lU
5
15
20
Age in years W rite a paragraph comparing the shape of the two graphs. everything you think is inlportant.
Write down
N ow answer the following: 1
How much weight did each person put on during their "secondary school" years (between the ages of 11 and I8)?
2
When did Paul weigh more than Susan? How can you tell?
3
When did they both weigh the same?
4
When was Susan putting on weight most rapidly? How can you tell this from the graph? How fast was she growing at this time? (Answer in kg per year).
5
When was Paul growing most rapidly? How fast was he growing at this time?
6
Who was growing faster at the age of 14? How can you tell?
7
When was Paul growing faster than Susan?
8
Girls tend to have boyfriends older than themselves. Why do you think this is so? What is the connection with the graph?
194
ROAD ACCIDENT STATISTICS The following four graphs show how the number of road accident casualties per hour varies during a typical week. Graph A shows the normal pattern Thursday.
for Monday,
Tuesday,
Wednesday
*
Which graphs correspond
* *
Explain the reasons for the shape of each graph, as fully as possible. What evidence accidents?
and
to Friday, Saturday and Sunday?
is there to show that alcohol is a major cause of road Graph B
Graph A
120 .-,--,--,.---,-....---r---.---.--.--r-.---.-.-,--,r-r-.---,---r--.--r-.---r-r---, Monday
to Thursday 100 f-+---I--1!-+-+-+--+-++__+_t-+--+---1f---+-+4__+_+-+-+-~
VJ
80 1-+-l-1-+-+-+-+-+-+---+-+--l---4-I-++4+l----+-+__+_~
.~ (Ij
::l
.~ 60
VJ (Ij
-;
U 60 I-+--+-I-+-+-+-+-~++--+--+-+---¥.
::l VJ
C\i
U
40 1-'+-+--+--+-+--+-~4---l20 I--+-+-+---+-+-+20 ~.. :+-+---+-+-+--~
2
~id. night
4
6
8
10
2
N:n
4
6
810M:'
o
night
2
~id. night
GraphC
4
6
8
10
N:n
1
I
1 ,
.\-1--+..1 -\-I_I\--+-I
I
+-+'---1Ir-\-1
[
I
~.....
10----:
l-
CF
"".'
1< ..
.... . ..
.' .•..
··1.:.
;
L,:::
Mid· night
[·1::
, :"1:.' 1/'· .. . I·....
t· j
o .•
I::::
}
2
n
t'T .. 1<1.1:
I'·:. ....1\ .... 1"'1/
, .. ~JT :\•.
I
""b
Ii:!:;
::::
."
VJ (Ij
h r.'·
'7'
.~ 60 -; ::l
7-
J.....> • .:: ··'1,'"
I·
20
M:.
I 7:;'
tJv
I
60
.~
U 40
10
--+-41-+--\,_ 1 +1 -+1_1t--+--1 ~
+'
I
T
::l
8
I 80 l-+--+-If--+--+-+-+-+-+·~t-+~1___R-1-+_+_+-+__+_~
80
VJ (Ij
6
night
I
~
4
GraphD 100
100
VJ
2
U
I
l'"
I··.· •..•k •
II"
"""'
r 1.
4
i:1: :..
t
6
8 10
.•
Noon
···1· I'
t<: .•• :'"
246
I:':
8 10
M:'
~id. night
night
195
2
4
6
8
10
.•
Noon
2
4
6
810M:
. night
THE HARBOUR TIDE The graph overleaf, shows how the depth of water in a harbour varies on a particular Wednesday. 1
Write a paragraph
which describes in detail what the graph is saying:
When is high/low tide? When is the water level rising/falling? When is the water level rising/falling most rapidly? How fast is it rising/falling
at this time?
What is the average depth of the water? How much does the depth vary from the average? 2
Ships can only enter the harbour when the water is deep enough. What factors will determine when a particular boat can enter or leave the harbour? The ship in the diagram below has a draught of 5 metres when loaded with cargo and only 2 metres when unloaded. Discuss when it can safely enter and leave the harbour.
Harbour . ': .. :: . -,' "
Draught"
~
'.':'
.'
depth
....
.
Make a table showing when boats of different draughts can safely enter and leave the harbour on Wednesday. 3
Try to complete the graph in order to predict how the tide will vary on Thursday. How will the table you draw up in question 2 need to be adjusted for Thursday? Friday? ...
4
Assuming (Where
that the formula which fits this graph is of the form
d
=
t =
d = A + B cos(28t + 166t depth of water in metres time in hours after midnight on Tuesday night)
Can you find out the values of A and B? How can you do this without substituting in values for t?
196
c ("-.l
~ ~ ~
0 0
c::
0
~
0\
00
t'\0
8
ro
if)
"'T ('f")
;>-.
ro
("-.l
.,......,
V /
V
v
("-.l
v·
~ ~ ~
.•....
...c:
on
'2
'"0 r:n ~;:j
...c: ~
'"0
·s
0
~
V
0\
I
00
\
t'-
'''''" ...•••.•.•.
\0
~
-..........
if)
~
,
...••....•.•
"'T
'"
('f")
'l/"
I
./ .,/ ./ /
V
V
("-.l
.,......, ("-.l
~ ~ ~
c
0
0
c
0
~
V
0\
/
00
f
t'-
\
a0..
a
ro
;>-.
"i'...
\0 if)
~
~
ro
'"0 VJ (])
t::
'"0
r---......
""""
~
('f")
197
(])
~
ALCOHOL Read through questions:
the data sheet carefully, and then try to answer the following
Using the chart and diagram on page 2, describe and compare the effects of consuming different quantities of different drinks. ( e g: Co n1pare the effect of drinking a pint of beer with a pint of whisky)
Note that 20 fl oz = 4 gills = 1 pint. Illustrate
your answer with a table of some kind.
An 11 stone man leaves a party at about 2 am after drinking 5 pints of beer. He takes a taxi home and goes to bed. Can he legally drive to work at 7 am the next morning? When would you advise him that he is fit to drive? Explain your reasoning as carefully as possible. The five questions below will help you to compare and contrast the information presented on the data sheet. 1
2
Using only the information presented in words by the ((Which?" report, draw an accurate graph showing the effect of drinking 5 pints of beer at 2 am. a)
What will the blood alcohol level rise to?
b)
How long will it take to reach this level?
c)
How quickly will this level drop?
d)
What is the legal limit for car drivers? How long will this person remain unfit to drive? Explain your reasoning.
Using only the formula provided, draw another graph to show the effect of drinking 5 pints of beer. How does this graph differ from the graph produced above? Use your formula to answer la) b) c) d) again. Compare
3
your answers with those already obtained.
Using only the table of data from the AA book of driving, draw another graph to show the effect of an 11 stone man drinking 5 pints of beer. Compare Answer above.
this graph to those already obtained. la) b) c) d) from this graph, and compare your answers with those
198
150 +--+--------1---+---+---+---+--+ ALCOHOL
...
"'0
DATA SHEET
o o :0
Alcohol is more easily available today, and more is drunk, than at any time over the past 60 years. At parties, restaurants and pubs you will be faced with the decision of how much to drink. Hundreds of thousands of people suffer health and social problems because they drink too much, so we feel you should know some facts.
E
o o •....• •... v a.
"0 ..c o
u
~ ~
01)
What happens to alcohol in the body? Most of it goes into the bloodstream. The exact amount will depend on how much has been drunk, whether the stomach is empty or not, and the weight of the person. We measure this amount by seeing how ~ much alcohol (in milligrams) is present in 100 millilitres of blood.
0_--+---+~-+---+-";:""l--~--41
2
(adapted
u o
3
4
5
from a Medical
6
Hours
7
textbook)
If you are above average weight (8-10 stone) subtract an hour; below it, add an hour.
~o
E:D
~E s:oL--------------------i c.:=:
gg ~:r ~:t
~~
How does alcohol affect behaviour? You cannot predict the effect of alcohol very accurately, since this will depend on how much you drink, and on your personaiity. Some people become noisy and others sleepy. Alcohol will affect your judgement, self control and skills (like driving a car).
~
ul:
'I
30 45 60 75 90 105 120 135 ISO 165 PjO 195 210
<0-\ IS 45 60 75 90 105 120 135 ISO 165 180 195 210
(adapted
~ ~ ~ 6
L..~
I
0 30 45 75 90 105 120 135 ISO loS 180 J95 21D
o
Export Lager 1/2 pint
8 brandy '16 gill
15
I
i!
15
20
15
The figures below the glasses show the concentration of alcohol in the blood (in mg per 100ml) after drinking the measure quoted.
5001'4 Death ~
is possible
Sleepiness. coma
.•• Stagger.
oblivion,
double
.•• Loss of self control,
o
This chart shows some ( of the physical effects of having different levels of alcohol in the blood
r
vision and memory speech slurred,
0
15 \ 0 45 30 60 45 75 60 90 75 120 105 13S 120 165 ISO 180 165 195 180 210 210
15 30 45 60 90 105 13S ISO loS 195
I
0
0
0
0
0
IS 30 4S 75 90 120 135 J50 180
0 15 30 60 75 105 120 DS 165
4
wear off?
The information shown below was taken sources. Do they agree with each other? table wine
whisky '16 gill
:-::::J ilJ 0
Experts generally agree that a person who regularly drinks more than 4 pints of beer a day (or the equivalent in other forms of drink) is running a high risk of damaging his health. However, smaller amounts than this may still be harmful.
20
20
;....::::J aJ 0
from the A.A. Book of Driving)
How do the effects of drinking
30
0
0 0
15 30 60 7S 90 lOS 13S ISO 16S 18U 195 2!0
~
Cider 112 pint
~
QJ
~O; I ~O~ <-o\
o
I~=======================-~ODraught Bitter 1 pint
l-
,;:;r:.::;r: ,;:;r:
loss slow reactions
.••• Legal limit for car drivers .•• Cheerful, feeling of warmth, Judgement impaired ~ Likelihood of having an accident starts to increase .2
Clearl y there" an urgent need for more public education about this. Here is a rough guide. An II stone man normally raises his blood/alcohol level bv about 30mg/l OOm! with each drink (pint of beer, 2 glasses of wine, or double measure of spirits). So after 2'h such drinks he will probably be Just below the legal limit (if he eats a meal al the same time, he may be able 10 go up to. say, three drinks without going over Ihe limit). [t take, about an hour for the blood/alcohol level to reach a peak. After this time-assuming you've stopped drinking-Ihe blood/alcohol level starts to fall at Ihe rate of about ISmg/lOOml (half a drink) per hour. This means that the rate at which you drink is important. Forexample, your blood/alcoho! level will probably be
(from a "Which?" Let the amount Let the number Let the number place be h hours Then a = JUb -
four different
higher after drinking 2'h pints of beer in quick ,uceession than after 4 pints taken over an evening. Don't look on the 8Dmg/iOOmi as a target to aim just short of. Many people (particularly the young) aren't safe to drive at levels well below this, and virtually everyone's reactions are at least ,Iightly slower by the time the blood/alcohol limit approaches 8Dmg/lO()mI. For safety'> sake you shouldn't drive if your blood/alcohol level i, likely to be 50mg/iOOmi or more. And bear in mind that. after a night's heavy drinking, you may still be unsafe to dflve (and over Ihe legal limit) the next morning. Note also Ihat it's an offence to drive or be in charge of a car while 'unfit through drink'-for which you could be convicted even if your blood/alcohollevei is below 80mg/iOOml
report on alcohol).
of alcohol in the blood at any time be a mg/ IOOml. of beers drunk be b of hours that have passed since the drinking took . ISh + IS 3
199
from
ALCOHOL (continued)
4
Compare the graph taken from the Medical textbook with those drawn for questions 1,2 and 3. Answer question la) b) c) and d) concerning the 11 stone man from this graph.
5
Compare the advantages and disadvantages of each mode of representation: words, formula, graph and table, using the following, criteria: Compactness
(does it take up much room?)
Accuracy
(is the information over-simplified?)
Simplicity
(is it easy to understand?)
Versatility
(can it show the effects of drinking different amounts of alcohol easily?)
Reliability
(which set of data do you trust the most? Why? Which set do you trust the least? Why?)
A business woman drinks a glass of sherry, two glasses of table wine and a double brandy during her lunch hour, from 1 pITl to 2 pm. Three hours later, she leaves work and joins some friends for a meal, where she drinks two double whiskies. Draw a graph to show how her blood/alcohol level varied during the entire afternoon (from noon to midnight). When would you have advised her that she was unfit to drive?
200
Support Materials
201
·
-
-Support Materials·,
- . '. '.
\. I
CONTENTS
203
Introduction 1
Tackling a problem in a group
207
2
Children's
211
3
Ways of working in the classroom
218
••
How can the micro help?
231
5
Assessing the examination
misconceptions
and errors
234
questions
202
INTRODUCTION The following support materials offer a range of ideas, discussion points and activities based on the Module. They can be used by individuals, but it is perhaps more profitable to use them as a basis for a series of meetings with colleagues where classroom experiences may be shared. This Module, 'The Language of Functions and Graphs', as its title suggests, focuses on communication skills. Pupils are expected to translate contextual information into various mathematical forms (graphs, tables, formulae etc), translate between them, and also interpret them back into the situational context. The main advantage of using graphs, tables or formulae is that they can distil a wealth of information into a small amount of space, and comparatively small changes in them can represent significant changes in meaning. Unfortunately, this 'denseness' of information can also make them difficult to interpret. Most teachers would agree that the ability to interpret and use these modes of information is of importance to pupils of all ages and abilities and many other areas of the school curriculum, such as biology and geography, use graphs and tables extensively. In order to develop interpretative skills, pupils need many opportunites to talk through their ideas and misconceptions, present evidence and discuss explanations. To some pupils this will be a new way of approaching mathematics and it is worthwhile explaining this to the class before starting on the Module. In fact, a discussion on '"how to discuss" can make a valuable introduction to the work. (An example of one teacher's approach is given in Section 3 on page 220). Language skills play an important role throughout the work. The building up of these skills is only achievable if the individual is actively involved; this is well illustrated by Clive Sutton's diagram below, taken from 'Communicating in the Classroom'. * Talking for Meaning Well managed discussion. Questioning by the pupils ~ as much as by the teacher
Writing for Meaning
~
./
Tasks which provoke active reorganisation of what the learner knows
'"
Active Listening
,/
Better comprehension of the subject matter now being studied Reading for Meaning~ 'active interrogation of the books'
* 'Communicating
in the Classroom'
'" 'mental questioning of the speaker'
edited by Clive Sutton, and published by Hodder and Stoughton, London 19i)I.
ISBN 0340266597
203
It is useful to distinguish two uses for language:
*
Language for telling others - being able to communicate verbally or diagrammatically so that another person understands;
* Language
for oneself (or language for learning) - "the struggle to communicate what you want to say is one of the most powerful provocations to sorting out what you understand."
This latter use of language involves the learner in a great deal of active reflection in which she reorganises her own thoughts as she tries to communicate with others. The advantages of encouraging this approach in the classroom is summarised in the following table, which is again taken from the introduction to Sutton (1981):
1 (a) (b)
(c) (d)
2 (a) (b) (c)
Knowledge reformulated by the learner for himself is more easily recalled, linked to other knowledge, and so accessible from other points in his thought patterns, more easily used in daily living, or when solving a problem, in some other field of thought, influential upon future perceptions, and an aid to further learning in the subject. Knowledge that the learner does not reformulate is more easily forgotten, usually rernembered only in situations very like those where it was learned, not applied or used elsewhere.
3 Reformulation may be provoked (a) by small group discussion (in appropriate (b)
circumstances), by any writing which is the pupil's own composition, as long as pupils and teachers expect such reformulation, and the relationships between them allow it and encourage it.
The materials in the Module are written with the objective of provoking reformulation of the children's ideas about graphs etc; classroom lessons typically include the following sequence of activities: i)
A short introductory discussion aimed at introducing the material, and at equipping pupils with the right expectations. (This includes establishing the relationship referred to in 3(b) above.)
ii)
Pupils working in pairs or small groups. Here, they may explore the task, consult and discuss with each other, work towards a group consensus and perhaps present their findings to other groups. (This relates to 3(a) above.)
204
iii)
A 'reporting back' session, with the teacher chairing or facilitating a whole class discussion, is often appropriate. (This large discussion can also provoke reformulation, so we would include it under 3 above.)
iv)
A 'summing up' of the current state of knowledge. This may leave the situation still open for further discussion but an attempt should be made to ensure that pupils feel secure in the knowledge that they are heading in the right direction. (It is also useful to look back at the experiences gathered in previous lessons.)
Th us the classroom materials introduce new concepts for the children to understand and at the same time suggest ways of working that may be new to both teachers and pupils. These support materials offer some ideas and comments both on the mathematical concepts and on the range of teaching styles that lllay be adopted. The suggested activities include working in small groups, exploring microcomputer programs and using the videotape to discuss how others work with the materials. However, if it's not possible to set up such activities we hope that merely reading these support materials will be of help. These support materials are divided into 5 sections:
Section 1 Tackling a problem in a group Here, three activities are given that provide teachers with an opportunity to gain personal experience of tackling problems in a small group and then sharing their ideas with a larger group.
Section 2 Children's misconceptions and errors This section contains a discussion of common difficulties and misconceptions that pupils have experienced with the work on functions and graphs. (In the classroom materials, various worksheets are specifically written to bring these difficulties and misconceptions to light and they are clearly referenced in this section.)
Section 3 Ways of working in the classroom This section considers the need to balance classroom exposition, small group discussion and class discussion.
activities between teacher
Section 4 How can the micro help? The four programs BRIDGES, SUNFLOWER, BOTTLES and TRAFFIC briefly described. Activities are suggested to help staff to get to know them.
are
Section 5 Assessing the examination questions This section brings us back to assessing children's responses to a few possible examination questions. We show how marking schemes may be devised for other questions and then provide an outine for a practical session using pupils' scripts. (These are included in the 'Masters for Photocopying' pack). 205
The videotape accompanying this book gives you an opportunity to watch others working with the classroom materials. It shows various ways of working and raises many questions as you see other teachers discussing their experiences. It is worth emphasising that every teacher develops his or her own personal style of working and the teachers that are sharing their methods with us through the video would not wish these extracts to be regarded as 'the way' for everyone to operate. However, they do provide a good focus for a discussion on how the teaching materials may best be used to help children 'think for themselves'. Finally,
as the Cockcroft Report* says:
"Mathematics teaching at all levels should include opportunities between teacher and pupils and between pupils themselves." These support
for discussion
materials attempt to address this recommendation.
* 'Mathematics Counts', HMSO 1982.
Report
of the Cockcroft
Committee
206
of Inquiry into the Teaching
of Mathematics,
1
TACKLING
A PROBLEM IN A GROUP
The Module suggests that children tackle the various worksheets in pairs or in small groups. Effective group discussion is an art that will need gradual development with encouragement and guidance from the teacher. The activities which follow have been used by teachers to gain more personal experience of how it feels to tackle a problem in a group and then report back to other groups. You might like to try them with a few colleagues, initially working in groups of two or three.
A Country Walk
\ The axes of this graph have not been labelled. By choosing different sets of labels the graphs can represent many different walks. Activity 1 (If possible tape record some of your group discussions and analyse them later on). The first activity is to decide on 5 different country walks that could be illustrated by the given graph. For example, one set of labels could be 'distance from home' for the vertical axis and 'time from the start' for the horizontal axis. A second set of labels could be 'anxiety level' against 'hunger', and so on. For each idea, copy the graph as above, label the axes, name the walk and then write a short description of the particular country walk that the graph is illustrating.
207
For example:
The Horse and Hounds
Distance from home
Time We set out from home and walked steadily for quite a while. At last we arrived at The Horse and Hounds, it was good to sit in the garden and enjoy a well-earned rest and a few pints of beer. Time passed and we suddenly realised we would have to hurry home if we wanted to arrive before dark - we were anxious not to be away too long because of the baby.
The Unknown Path
Anxiety
Hunger We had quite a difficult route to follow and it was not easy to pick out the various landmarks. We got more and more worried but after a while Claude noticed that the distant hill must be Beacon's Hang so we hoped we were on the right route. The way became more familiar and we were sure we were on the right path. Unfortunately, we had forgotten to bring our sandwiches.
208
When you have completed
the five descriptions try Activity 2.
Activity 2 Set up a matrix with five
Walk 1
Walk 2
The Horse and Hounds
The Unknown Path
Walk 3
Walk 4
WalkS
Labels on Axes Distance from home against Time
d[[lt dLcit
Anxiety against Hunger
aLclh
0 0 0 *Many other graphs are possible!
209
Activity 3 The final activity involves reporting your ideas and solutions back to the other groups. Keep any tape recordings you were able to make - they may be analysed later as described in Section 3, pages 221-226. Some general questions may however emerge immediately: 1.
Would you have preferred to think about the activities yourself before discussing them with your group?
2.
How did the group get organised ...
3.
i)
to record their decisions?
ii)
to prepare their presentation
for the other groups?
What role did each member of the group play in the discussion? Did anyone ... dominate? work independently
from the others?
ask a lot of questions? offer suggestions? take up or challenge suggestions offered by others? 4.
How was the feedback session organised-did its findings?
210
each group get a chance to explain
2
CHILDREN'S
MISCONCEPTIONS
AND ERRORS
Below we examine some common misconceptions and errors exhibited by children as they work through the Module. Our research evidence* appears to support the view that teaching styles which involve discussing common errors with children are more effective than styles which avoid exposing errors wherever possible. In this Module we have adopted this view and the teaching material is therefore designed to confront rather than avoid the more common areas of difficulty. 1.
Interpreting
a graph as if it were a picture of the situation
Look at the following example of 'Susan's' The Country Walk
This graph shows the progress of a country walk. Describe what happened.
Distance from home (kilometres)
1
2
345
Time (hours)
me.
~e..
were..
Of\
-lhe..
W~J\kJrsup
w\--en ~ top ~€j
~le.e.p
v~
~~
v..:ol\0"3 qU\te u..:ex-e. b.sed.
0(\
1..J..X;\\h{l3
WeR.
COrried
bLt.. ard then ~ Coc..k dCLL.)0 the h\ \ \
other 'Side. 85 ~~
Lh':J
ll.JerIC at
fOr
went
Q
~
hi\\.
PI'O\l:::; gol t.o ~e
~bL.0 Decou S E:.. ~
0..
v..Jo.\\.(
CO-t\\~
0\
me
UJert
qu..:t.-e..
SJlr::5' Q ~
.
*See for example "Teaching Decimal Place Value - a comparative study of 'Conflict' and 'Positive Only' approaches" by Malcolm Swan, Shell Centre, Nottingham University, 1983. ISBN 0 9061216 010.
211
Susan has interpreted the misinterpreted the slope of has become confused with misconception is extremely errors in interpretation.
graph as if it were just a picture of a hill. She has the graph as indicating the 'steepness of the hill' and this her other interpretation involving speed. This kind of common, and accounts for a very large proportion of
Pupils (and even adults) who have become much more sophisticated in interpreting complex graphs can also fall into this kind of error from time to time. The following tasks are taken from AS, "Filling Bottles":
Filling Bottles Choose a graph (from nine alternatives) to show how the height of the liquid in each bottle depends upon the amount of water poured in.
Bottle
Incorrect
response
Graph G
Height of water
Ink bottle
Volume poured in
Graph H
Height of water
Evaporating
flask
Volume poured in
212
In the first of these examples, the pupil has chosen graph G, perhaps assuming that a 'straight' edge on the bottle will always produce a 'straight' line on the graph. It is often difficult to explain why this is not true. In the latter case, the pupil has possibly chosen graph H because he identifies the concave curve on the lower part of the evaporating flask with the concave curve on the lower part of the graph. This Module enables you to consider this kind of misconception in some depth (Worksheet A2 focuses on it in particular). It will undoubtedly recur in many other gUIses. 2.
Answering items which depend on two or more variables
Consider the following item which is taken from the supplementary end of section A (Page 100).
Bags of Sugar ),\
F
• E
•
Cost D
A
• •
C B
•
•
/'
Weight Each point on this graph represents
a bag of sugar.
(e)
Which of F or C would give better value for money? How can you tell?
(f)
Which of B or C would give better value for money? How can you tell?
(g)
Which two bags would give the same value for money? How can you tell?
213
booklets at the
Some pupils find it difficult to consider both variables equally, and often answer the questions as though they depend on just one variable. Leonard
(e)
C.
C
(f)
B.
~o
C
b2co...u.Se... C ·vo h..c.aJ..)~ ~
15
les~
(YlOnej
11- \~
.
)CVoJer i'l-
price.
(g)
Abby
(e)
d.o~'f\t c:.est ~
~oor.
(g)
c,C
b~
~
b~
L.D~
~
5~.
Both Leonard and Abby are aware of both variables, but while Leonard focuses mainly on the price, Abby focuses mainly on the weight. These questions are quite demanding, and pupils need to adopt some kind of proportional reasoning in order to answer them correctly, for example:
Summi
214
The teaching material within the Module offers a number of items which require such reasoning. In the "Telephone Calls" item in Worksheet AI, for example, pupils have to relate the cost and the duration of a call to the distance over which it is made. (One cannot conclude that because a call is expensive, then it must be over a long distance.) Later in the Module, (see "Bridges" in B4), pupils need to determine the relationship between a larger number of variables. Here, they will need to consciously hold some variables constant while they consider relationships between the others. 3.
Interpreting intervals and gradients
Most pupils appear to find the interpretation of intervals and gradients difficult and often confuse them with values at particular points. The following two examples both taken from the Problem Collection on pages 193 and 194, illustrate this.
The Motorway Journey
8 7
r"-.. ~
~
Vl
c.::
.2 C;
OJ)
'-'
~ 6
.....••.•..
5
I-.
"-
~
f""..,
•...••.•...
:-........
C\l
u
>-. 4
0
•... I-.
3
~ ~
E
.::
f' ~
~
'-
....••••...•
,
~
r"-.. ~
...•.....•
Q)
0...
~
2
.........
'" , ...•.....•
I
o
50
150
100
Distance travelled in miles
"At which station did I buy the most petrol?" "At the second because the graph goes higher".
215
200
250
Growth Curves
80 I
I
70
I
I
I
/
Paul Susan----
/
60 ..•.
50 1/
Weight
~
40
in
kgwt.
-/
30 //"
/'
20
/
v
-7 /
L-
/
-~
/
/ I
/
/
./"/
~
/
/
//
.............. v
./
/"
.,;-
./"
10
~
t-V o
--<~
A~
5
10
15
20
Age in years
"Who was growing faster at the age of 14?" "Susan,
because the Susan's graph is higher when she's 14."
These kinds of response are by no means unusual. Other common errors occur because pupils are unable to compare large segments of a graph although they may be successful with smaller segments. Pupils who interpret graphs in a point-wise fashion are particularly vulnerable to these kinds of error and need to be shown how segments can be compared directly on a graph without having to resort to any kind of scale reading. Often, pupils will measure an interval by 'scale reading', by which we mean that they take two readings and find the arithmetic difference between them. An alternative approach which we term 'grid reading' involves measuring the length of an interval using the grid lines and then using the scale along one axis to decide upon the meaning of this length. When a qualitative comparison of two intervals is to be made this last step is of course unnecessary. Many aspects of graphical interpretation are facilitated by 'grid reading'. It enables pupils to read the graph in a 'relative' way and frees them from the need to keep referring back to the axes and assigning absolute values to every reading that is taken. For example, in response to the questions "At which station do I buy the most petrol?", a 'scale reader' would reason: "At the first station the graph rises from 1 gallon to 6 gallons, an increase of 5 gallons. At the second station the graph rises from 3 gallons to 7 gallons, an increase of 4 gallons. So more petrol is bought at the first station. "
216
However, the 'grid reader' would reason: "The first increase is larger than the second increase, as the vertical line is longer". Grid reading thus has powerful advantages, but from our observations pupils don't always adopt this method successfully and spontaneously. 4.
Situations
which are not time dependent
Many graphs involve "time" as the independent or as an implicit variable. When this is not the case, however, the function has to be visualised as the outcome of a great number (or infinite number) of experiments. Here are examples of both categories: 'Time dependent' "Sketch a graph to show the speed of an athlete varies during the course of a 1500 metre race." Although the word 'time' will not appear as one of the labels on the axes (these will be speed and distance covered), one can readily imagine taking measurements of speed and distance at various times during a single race. Time is thus an implicit variable. 'Time independent' "Sketch a graph to show how the time for running a race will depend upon the length of the race." Here, we,need to imagine that a large number of races are performed (in any order), and that the length and time are measured for each race. Each point on the sketch graph will represent a different race, and one cannot imagine time elapsing in the same way as before. In this sense, although the word "Time" appears as a label on the vertical axis, the situation is essentially independent of time. 'Time independent' situations are usually much more difficult to visualise, and often cause pupils considerable difficulty. There are examples of these scattered throughout the module. The first example on Worksheet A3, page 82, is of this type.
217
3
WAYS OF WORKING IN THE CLASSROOM
Establishing a Framework There are three major types of activities to manage in the classroom: i)
Exposition, where the teacher introduces the task to be tackled, explains, sets the scene, organises the structure of the lesson, summarises the results and so on.
ii)
Small group discussion, where pupils work cooperatively, available fOFcounselling and discussion when required.
iii)
Class discussion, where groups report back to the whole class with the teacher acting as the 'chairperson', or where individual groups discuss together, again with the teacher as 'chairperson'.
with the teacher
Before looking at these activities in detail and the demands they make on the teacher, it is useful to consider the different rhythms that emerge with various tasks and different pupils. Observation of the materials in use shows that the length of time spent working in these different ways varies a great deal. You may care to keep a note of the rhythm of your lessons with different worksheets and different classes and compare them with those obtained by other teachers. Here is one record from a teacher working with the A5 worksheet,
'Bottles':
Time
Duration
Comments
11.34
8 mins
Class discussion
Introducing the situation via a problem. (The class is already organised)
11.42
6 mins
Group work
Sketching graphs for cylindrical bottles (page 1)
11.48
8 mins
Class discussion
Group compare sketches.
11.56
18 mins
Group work in pairs
Matching bottles to graphs (pages 2,3)
12.14
7 mins
Class discussion
Groups compare results.
12.21
4 mins
Group work
Sketching graphs for given bottles (page 4)
12.25
5 mins
Class discussion
Groups compare sketches, then homework is set.
Activities
218
In this example, the lesson contained an equal amount of class discussion and small group work, with little or no teacher exposition. (This may be compared with other teachers who preferred a great deal more work in small groups.) What kind of rhythm do you typically adopt?
i)
Teacher Exposition
The teacher may at various stages wish to talk to the whole class. If a new concept is to be introduced it will be necessary to explain the new idea perhaps employing a question/answer technique to involve and interest the children. It is important to recognise that this 'teacher-led' part of the lesson is very different from a class discussion, where the teacher acts as chairperson and facilitates communication between the children. A period of exposition is organise and structure the following flow diagramwas the beginning of worksheet
also often necessary when the teacher is attempting to way in which the children will work. For example, the developed with a class during a 'teacher-led' episode at A2, 'Are graphs just pictures?':
The Golf Shot
,/
".,--
/
"-
/
\
/
\
/
\
I I
\ \
I
\
/
\
/
\
I
\
I
\ \
I "
I
...
I
:
:.
,I.
.\
.'... ' .\ . . ..' .. \ . . . -'. \', . ' :,., ',': ..\,.'
I I
,
I """"1/"\1'
I
, '\
(.l/I.\/lll'·.
/1/
'.
"~
"I
.""
"""""1\/",,,/(;\((\
' .' I
' ..
' \
"
~«A.\~L«.il}M 111. ~, \\l,,"\ll\\ iVJ~\. •
I
•
I
How does the speed of the ball change as it flies through the air in this amazing golf shot?
219
In this lesson, and in several following lessons, the children found that this chart helped them considerably in achieving profitable discussions. 220
ii)
Small group discussion
After the problem has been introduced the children are usually asked to work in pairs or small groups. At the beginning of a new task, it often takes some time to absorb all the information and ideas. The group discussions at the beginning of the task may therefore be fragmentary, using keywords, half sentences, questions and so on. We refer to this as the exploratory discussion stage. Although it often appears somewhat disjointed and poorly articulated, if the group is left to work undisturbed, it is here that organising and reformulation can emerge. If you are able to tape record some small group discussions you may like to analyse them in the following way*:
1.
Divide the discussion possible.
into a number of distinct episodes or subtopics,
as self-contained
as
Identify the initiator of the episode, and discover whether the initiator is a group member or leader (teacher).
2.
Can you find examples of participants: a) b) c) d)
putting forward a tentative or hypothetical idea, and asking for comment? supporting their own assertions with evidence? contributing evidence in favour of someone else's assertion? pointing out flaws in the arguments or questioning 'facts' put forward by others?
Are all members of the group: e) participating? f) supporting the discussion?
3.
What kinds of intellectual process were being used? Count the following, putting doubtful cases into more than one category if necessary: a) b) c)
contributions principally at the level of specific information (data); contributions that focus on ideas or concepts (classes of events, objects or processes); the number of abstractions or principles involving more than one concept.
*Categories 1, 2a, b, c, d and 3 are taken from 'Communicating in the Classroom', chapter 4, by Trevor Kerry, edited by Clive Sutton, and published by Hodder and Stoughton, London 1981,ISBN 0 340 266597
221
Below we give a transcript of three boys working on worksheet AI, annotated with these discussion categories:
Al INTERPRETING POINTS As you work through this booklet, discuss your answers with your neighbours and try to come to some agreement.
1.
Who is represented
Alice
The Bus Stop Queue
by each point on the scattergraph,
Brenda
Dennis
Cathy
below?
Errol
Freda Gavin
1
2
•
Age
•
3.
7
• Height 1.
222
Worksheet Al
1.
The Bus Stop Queue (Three boys: PI, P2, P3)
Transcript
Category and Comment
PI
Right. Obviously the two highest are Alice and Errol.
1 3a
Initiator is PI not the teacher Specific information contributed
P2
Yeah, Numbers 1 and 2 are both the tallest. Yes. Therefore they're Alice and Errol.
2b
P2 makes an assertion, but it is based on the misconception that 'high points' = 'tall people':
Hold on! No! 1 and 2 are both the two oldest. They're Errol And Alice. Yeah. That's what I said.
2d
PI points out a flaw in P2's argument, but then makes a slip himself.
PI
Sorry ... I think it could be Dennis and Alice?
2a
PI puts forward a tentative (correct) idea.
P2
But Dennis is shorter.
2d
P2 questions PI's conclusion.
PI
How do you know that Freda isn't older then? Don't be silly. Use your common sense.
2d
PI seems to be trying to point out a flaw in P2's argument by questioning.
PI
Urn ... so Alice'll be the older one. So Alice'll be number 2. OK?
2a
PI returns to his own approach and asks for comment.
P2
What? She's the oldest and she's the tallest?
2d
P2 implies that there is a flaw in PI's argument.
PI
The other oldest one is short, so that's number 1 isn't it and that's Dennis. Hey up will you two do something? Well it says agree and I'm agreeing!
2b
PI supports his assertion with evidence. PI looks at both variables simultaneously. PI feels that he is doing most of the work! although P3 was silent during the episode, he was supportive and involved.
PI P2
PI
P2
P2
P2
3b 2e 2f
223
You may now like to try analysing the following transcript, same three boys tackled page 3 of worksheet AI.
3.
which shows how the
Telephone Calls
One weekend, five people made telephone calls to various parts of the countryThey recorded both the cost of their calls, and the length of time they were on the telephone, on the graph below:
eBarbara Cost of call
.Clare
• David
• Sanjay
Duration
of call
•
Who was ringing long-distance?
Explain your reasoning carefully.
•
Who was making a local call? Again, explain.
•
Which people were dialling roughly the same distance? Explain.
•
Copy the graph and mark other points which show people making local calls of different durations.
•
If you made a similar graph showing every phone call made in Britain during one particular weekend, what would it look like? Draw a sketch, and clearly state any assumptions you make.
3
224
Worksheet Al
3.
Telephone Calls (same three boys PI, P2, P3) Category and Comment
Transcript
PI P2 PI P2 P3 PI P2 P3
P2 P3
P2 PI P3
P2 PI
P3
P2 PI P2
David and Sanjay were making local calls ... because they were the cheapest weren't they? At the bottom. How would you say at the bottom, silly? At the bottom of the graph. I t could be at the bottom of the pond! Right. If Barbara was phoning long distance, it would cost far more. Oh, yes! Y'es right. See. If the call is short, it's going to cost that much. If he's doing twice as much it's going to cost two times as much. Yeah, right. The longer you're on the phone, the more it costs. I don't think duration means distance. No, it means length of time. Oh, lohn and Barbara have actually had the most expensive calls together, but John ... but John was ringing'long distance. Yes, but you've got to explain it. John was phoning long distance because his call was shor(est and cost the most. David was making the local call ... No, it was Sanjay who was making the local call. How can it be Sanjay? Because he spoke for a long time and it's still very cheap. Oh. Makes sense ... unusually!
225
The three pupils appear to have become involved and interested in these tasks, and they feel confident enough within their group to offer opinions and suggestions. (It is interesting to note here that Pupil 3 was joining in the discussion by the time the group got to the telephone problem.) When children are working in pairs or in groups the balance of communication is extremely sensitive to teacher intervention. When an 'audience' is present, the group may try to supply 'answers' for the teacher rather than reasoned arguments to convince the 'group'. The teacher is also an informed audience who, most children assume, knows and understands the work. Some may therefore see no need to persuade the teacher in a reasoned way because "teacher knows what I mean". Others, however, may decide to present their arguments more formally because of the presence of an authoritative figure. During a full class discussiop., and, to a lesser extent, during a small group discussion with the teacher present, there may be a shift towards the 'distant audience' mode as defined in the tables below:*
<: Size Source of authority Relationships Ordering of thought Speech planning Speech function
Intimate Audience Snlall group The group Intimate Inexplicit 1mpro vised Exploratory
Distant Audience
>
. Full class . The teacher . Public . Explicit . Pre-planned . Final draft
As the nature of the audience has such a profound effect on children's thought processes, the teacher should be careful of the timing and frequency of such 'interventions' or 'interruptions'. Eventually a group will be ready to offer its ideas to the whole class, but it will first need time and space to work out its own ideas within the group.
""From Communication
to Curriculum',
Douglas Barnes, published
226
by Penguin
1976. ISBN 0140803823
(iii)
Class Discussion
A checklist is given on the inside back cover of this book, headed "Classroom Discussion Checklist'. It provides some general guidance both for the running of full class discussions and for encouraging small group discussions. This table is not intended to show that "judging' or "evaluating' a pupil's response is always inappropriate, it rather attempts to recognise that if the teacher operates in this way, then the nature of the discussion will change, either into a period of teacher-led exposition or into a rather inhibited period of "answer guessing' where the emphasis is on externally acceptable performances rather than on exploratory dialogue. Typically, therefore, if judgements are to be made, then they should be made towards the end of a discussion. Barnes* using two categories "Reply' and 'Assess':
to describe distinct teaching styles which he terms
"When a teacher replies to his pupils he is by implication taking their view of the subject seriously, even though he may wish to extend and modify it. This strengthens the learner's confidence in actively interpreting the subject-matter; teacher and learner are in a collaborative relationship. When a teacher assesses what his pupils say he distances himself from their views, and allies himself with external standards which may implicitly devalue what the learner himself has constructed. Both reply and assess are essential parts of teaching; assessment is turned towards the public standards against which pupils must eventually measure themselves, whereas reply is turned towards the pupils as he is, and towards his own attempts, however primitive, to make sense of the world. If a teacher stresses the assessment function at the expense of the reply function, this will urge his pupils towards externally acceptable performances, rather than towards trying to relate new knowledge to old. In this case, the externals of communicationaccepted procedures, the vocabulary and style of the subject, even the standard lay-out for writing-are likely to be given more weight than the learner's attempts to formulate meaning. A classroom dialogue in which sharing predominates over presenting, in which the teacher replies rather than assesses, encourages pupils when they talk and write to bring out existing knowledge to be reshaped by new points of view being presented to them. This is likely to be difficult for teacher and pupil alike."
The presentation of group ideas to the whole class can be organised in various ways. (This is raised as Discussion Pause 2 on the videotape.) Very often it becomes a teacher-led discussion. Adelman, Elliot et al** offer the following hypotheses about teacher-led discussions - they are well worth considering:
* 'From Communication to Curriculum', Douglas Barnes, Penguin 1976. ** 'Implementing the Principles ofInquiry(Discovery Teaching: Some Hypotheses', Centre for Applied Research in Education, University of East Anglia, 1974.
227
Adelman
c., Elliot
J. et ai,
1
Asking many questions of pupils ... may raise too many of the teacher's own ideas and leave no room for those of the pupil. Responding to pupils' questions with many ideas may stifle the expression of their own ideas.
2
Re-formulating problems in the teacher's own words may prevent pupils from clarifying them for themselves.
3
When the teacher changes the direction of enquiry or point of discussion, pupils may fail to contribute their own ideas. They will interpret such actions as attempts to get them to conform with his own line of reasonIng.
4
When the teacher always asks a question following a pupil's response to his previous question, he may prevent pupils from introducing their own ideas.
5
\Vhen the teacher responds to pupils' ideas with utterances like 'good', 'yes', 'right', 'interesting', etc., he may prevent others from expressing alternative ideas. Such utterances may be interpreted as rewards for providing the responses required by the teacher.
\"
Asking children to present work or explain ideas to the whole class needs very sensitive handling. It is essential to try to create an atmosphere in which errors and poorly expressed ideas are welcomed and discussed rather than criticised and ridiculed. Attempts to achieve this kind of atmosphere can take on many practical forms. For example, the teacher may: collect in a few suggestions from pupils, write them on the blackboard and discuss them anonymously - thus avoiding any embarrassment. ask a representative from each group to describe the consensus view obtained by their group. Solutions thus become associated with groups rather than with individuals. It is also possible to rearrange the desks or tables (in a U shape, for example) so that it becomes clear that the activity is discussion rather than exposition. Once the right 228
atmosphere an orderly,
is established, most pupils seem to enjoy and benefit from taking part in well managed class discussion.
What do the children think? The following transcript is the final part of an interview where children were asked to discuss their experiences of class discussion with this module. (There were 9 pupils from a 4th year O-level group - each pupil was chosen by his or her coworkers to represent their views.) (I
=
interviewer,
P
=
one pupil, PP
=
two pupils, etc)
PP P P
Yes it was good .,. it worked well in the class. It's good to have discussion. 1 think we don't normally do any discussion with the groups '" that brought a change. P I'd like more discussion in the maths lessons. P It was good the way ... Mr Twas a bit false with it 'cos he went round talking to people and normally he just sits at the desk and Inarks people's work ... but you were discussing it in your groups ... and then maybe 10 minutes at the end of the lesson discussing the questions as a class and the people would put their points forward. P Yes. 1 What about the class discussion bit then ... was it good or bad? PP Good, good. I OK let's take it through ... what makes a good class discussion then? P Well you're not having everyone shouting out at the same time ... and you listen to other people's ideas ... then you put yours ... 1 Did that happen? PP Yes, yes. P You get people to come forward and like draw their ideas on the blackboard and then people can criticise it and comment on it ... and like you say ... you're in your little groups maybe 3 or 4 ideas put forward and eventually decide on one and in a class maybe 7 or 8 ideas put forward and then you can ... yours lnight be right and you stick with it ... 1 So the class discussion enables one group to conlpare their results with another group. PPP -Yes, yes. 1 There were times when Mr T started the lesson off, for example, with an introduction ... was that useful? PP Yes, yes it reminded you. 1 So it was helpful? P 1 think you should start discussing it yourself; then have 10-15 minutes at the end of the lesson to draw the ideas together ... PP Yes, yes.
229
P
PP P I
When you get into the lesson you don't really want to sit down and listen to somebody at the front talking on a unit ... you want to get down to some work, then discuss it. 'Cos then you can make mistakes ... and learn from your mistakes, can't you? So from the point of view of the lessons you would have rather had a brief start from the teacher, work on your own or in your group and then a 10 minute discussion at the end. Yes, yes. 'Cos Mr T goes on a bit when he starts talking! You can't stop him! So you found that not so good then?
p
Yes he went on for too long when he's talking.
I
OK that's part of life ... every teacher's different, you have to cope with teachers don't you ... He's a good teacher, but he goes on! OK ... so if we were putting down notes for a teacher you'd recommend the short start and so on ... Yes. Are there any other things that you would say or recommend? I think it was good ... you don't need much knowledge ... I think you need experience really and what you do is ... you relate your experiences you see and that I think develops your intelligence more than just knowledge. Yes if you're not very clever then ... people can take it as far as they want if you enjoy the questions you can go all over. You can draw graphs and compare with other people's, but if you're not so interested you can just draw one graph, say "I think that's right" and go on to the next question.
P I
P I PP I P
P
These children appear to have enjoyed this way of working. The last part of the videotape shows another group of children discussing their views on the classroom activities.
230
4
HOW CAN THE MICRO HELP?
The resource pack with this Module book contains four microcomputer programs: SUNFLOWER, BRIDGES, BOTTLES and TRAFFIC. The SUNFLOWER program and the BRIDGES program may be considered together. Below, we give a brief description of each. (Fuller documentation is provided in the accompanying handbook.) SUNFLOWER
BRIDGES
SUNFLOWER is a problem solving exercise which encourages systematic investigation and modelling. You are challenged to grow the world's tallest sunflower. You have three unlabelled jars containing chemicals which you can add in any quantity to the plant's water. The program introduces ideas about scientific method and practises place value in the use of decimals.
BRIDGES allows you to specify the length, width and thickness of a plank which is used to make a bridge. Once the bridge dimensions are defined, the program provides the maximum weight that the bridge can support before collapsing. Simple animation as well as numerical data is shown.
Pupil Activities: observing, exploring, perimenting, interpreting, modelling.
WORLD 6M
exploring,
generalising,
ex-
RECORD
7,380~ AMounts
3M
Pupil Activities: problem solving.
A:
o
B:
60
c:
o
The
sunf
2M gt'ew
to
in
",g/1
lowet'
4 ,763M
L
=
2
B
=
69
1M Again
(y/n)?
Each of these two programs may be viewed as a 'data generator'. The pupils are invited to choose values for the independent variables (the quantities of chemicals administered to the sunflower, or the dimensions of the bridge); the computer then performs an 'experiment'and gives the resulting value of the dependent variable (the height to which the sunflower grows, or the maximum weight the bridge will support). With SUNFLOWER, the objective is to maximise the height of the sunflower that can be grown, whereas with BRIDGES the objective is to discover an underlying 'law' by which the strength of any bridge may be predicted. The BRIDGES program is therefore suitable for older, more able pupils, while SUNFLOWER can be used with pupils of more limited ability (where it will also provide considerable practice in using decimal place value). SUNFLOWER provides a very suitable introduction to BRIDGES. Naturally, these programs are both simplified models of reality, but they provide a powerful way of 'setting the scene' (using cartoon graphics) and by per~orming the technical tasks involved in data generation, they allow pupils to focus on fundamental processes of scientific inquiry: exploring systematically (holding some variables constant while exploring relationships between the others, etc), creating graphs and tables, looking for patterns and making generalisations.
231
The BOTTLES
and TRAFFIC
programs may also be considered together:
BOTTLES
TRAFFIC
BOTTLES encourages pupils to explore the relationship between graphs and events in a realistic context. Animated graphics show a bottle filling steadily with water while a graph shows how the height of liquid varies as the volume in the bottle increases. How does the graph change when the bottle changes in shape or size? Can you work out the shape of the bottle when you only have the graph? Pupil Activities: ob~erving, discussing, graph interpretation, graph sketching.
TRAFFIC develops graph interpretation skills by using animated graphics to help pupils' understanding of distance-time graphs, and by challenging them to match graphs with realistic situations. The program begins by asking you to imagine a man in a helicopter who photographs the road below him every few seconds. When his photographs are pinned up in a row, we get a crude distance-time graph of the traffic. How does the movement of vehicles on the road affect the graph? Can you guess what was happening on the road from the graph? Pupil Activities: observing, discussing, graph interpretation, graph drawing, sketching.
Height
D i 5
t a n c e
UoluMe
TiMe
These programs provide two contexts within which pupils can develop their skills at translating pictures into graphs and graphs into pictures. Again, these are described more fully in the accompanying handbooks. Both programs contain a bank of examples which the teacher or pupil can draw on during class, large group or small group discussions. The programs can generate tasks in several ways. It is possible to show just the animations and ask the pupils to sketch the corresponding graphs or vice versa. This flexibility to control a program so that it leaves out the activity that the pupils should do themselves, we usually refer to as 'omission design'. (.LA..fter pupils have sketched their graphs, the computer animation can be replayed with the graph facility switched on, so that pupils can detect errors and misunderstandings in their work.) Another important idea emerges through the use of these two programs. Sometimes, the computer may be switched off and the children instructed to imitate the same activity in pairs. One pupil writes a story and draws the corresponding graph then passes this graph to her neighbour. The second pupil now has to try to recreate the original story. When the two stories are compared, a great deal of useful discussion is often generated. (Such role imitation offers much more than traditional rule imitation!) 232
To conclude,
the computer
can be used in many ways, for example:
with a whole class it can be used to introduce and explain tasks and provide data or problems for discussion. The teacher can then take on the role of a 'counsellor' or 'fellow pupil', discussing strategies and approaches with the children. (This is made much easier if the computer, rather than the teacher, appears to be setting the tasks). with a small group of children, it can be used as a 'resource' to be called upon, giving feedback or information when needed. The unthreatening 'personality' of the machine enables it to be treated almost as a member of the group. (If only one computer is available, groups could take turns at using the micro while others work on related worksheets.)
233
5
ASSESSING
THE EXAMINATION
QUESTIONS
The examination
questions aim to assess and give credit for the following processes:
1.
Interpreting
mathematical
2.
Translating
words or pictures into mathematical
3.
Translating
between mathematical
representations.
4.
Describing
functional
using words or pictures.
5.
Combining information where appropriate.
6.
Using
mathematical
representations
relationships presented
representations
using words or pictures. representations.
in various ways, and drawing inferences to solve problems
arising from realistic
situations. 7.
Describing
or explaining the methods used and the results obtained.
The headings above all describe processes outlined in the Module. Each problem will involve at least one of these processes and may involve as rnany as five. For example, in "The Vending Machine" (page 38) the candidate is required to translate from words to a mathematical representation (Process number 2), while "The Journey" (page 12) involves the processes of interpreting mathematical representations using words, combining information and drawing inferences and, in part (ii), translating into and between mathematical representations (Process numbers 1, 5, 2 and 3). This section offers a set of activities designed to clarify what is meant by these assessment objectives which obviously cover a broader range than the usual 'method' and 'accuracy' headings used in assessing mathematical technique. These activities aim to help teachers both in understanding better the questions and marking schemes their pupils will face and in assessing informally their work in the classroom.
234
A marking 1)
activity for you to try
Consider the questions "Camping" (page 20), "Going to school" (page 28) and "The hurdles race" (page 42) and try to decide which process is being tested at each stage of the problems. Then fill in the following table: Process being tested (1) Camping
(i) (ii) (iii) (iv)
(2)
(3)
(4)
(5)
(6)
} } --
(v) (vi) Going to school
(7)
-
(i) (ii)
---
(iii) (iv) The hurdles race
---===-
This activity is often a useful strategy for starting to devise a mark scheme. 2)
Now consider the "Camping" problem. Decide allocated to each part. (There are 15 marks altogether.) Discuss this with your colleagues. Do of each part? Try to resolve any discrepancies. school", (which is also worth 15 marks).
how many marks should be available for this question you disagree on the weighting Do the same for "Going to
You may like to compare your allocation with those we gave. The marking schemes for these two questions are given on pages 21 and 30. They also show the more detailed allocation of the marks within the sections. If you have enough time, you may like to look at the pupils' responses provided for these two questions in the 'Specimen Examination Questions' section. Try to mark them using your marking schemes. 3)
Since a marking scheme for "The hurdles race" is more difficult to devise we suggest that you devote the remainder of the rnarking session to this problem. The above strategy is not applicable to this question. Pupil responses can be extremely varied. If you haven't already done so, answer the problem yourself and then discuss which points you consider to be irnportant for the candidate to Inention. Make a list. It may be quite long- and there only 8 marks available for this question, so try to decide which factors you consider to be of greater
ilnportance. 235
Below, six scripts from candidates are provided for this question. (They are also contained within the 'Masters for Photocopying'.) Read them all through once before trying to assess them. On the basis of your overall impression, rank them in order with the best first. (Do not discuss this rank ordering with your colleagues yet.) Record your rank orders in column Ro of the Marking Record Form.
Marking Record Form
Marker 1 Script A
Sharon
B
Sean
Marker 2
Marker 3
Marker 4
Ro RI ~V1IM2 Ro RI MI M2 Ro RI MI M2 Ro RI MI M2
C Simon D David E
Jackie
F
Nicola
Key: Impression rank order Raw mark Mark rank order Revised mark (if any)
Ro MI RI M2
Next, compare the list of the factors that you consider important with the lists obtained by your colleagues and with our mark scheme on page 43. Discuss any discrepancies. Use our mark scheme to mark the 6 scripts and record your marks in column MI. Record also the new rank order implied from your marking in the preceding column, RI. N ow compare your result with your colleagues' , considering each of the 6 scripts in turn. Try to account for any differences that occur and enter any revised marks in column M2 of the Marking Record Form. Finally you may like to compare your assessments with those we have made, on page 240. 236
Script A
Script B
Sharon
Sean
237
Script C
Simon
~ U RO L(:: S
Script D
Ml ~
~
c. ~
\'V.)
~
J:\~
~
L
\n
~
J:~
tif
~ lJ)
~~'t~{\
~
~
~
1,0 ~
~~'
-1\
~ ~
~ )
~
~C~
~
~~ ~
~
~
~~
~,
1;00
?fYO ~
~
f\
\uk~~
\..Q.;,
~ eVtj'l-rt
A-
-fvJ
B~~
~~L~
~
.
David
\~~* ~
f<..ACE
~
~
~. fJ'tj1
~
'N-
y~
hAn
vtt)
~ ~ ~L~~
~~~.
238
~
~ ~
~~
~
~
-~A
L
V>
~
A\J- ~
Jackie
Script E
flr
8th. \e..t€.
s
h.o.. spa.
se.co
W'CLr
I'V\-
A 4-h\e.te.
t\ ~
t
'IS
\ 00
k
p
o....S
S e.. S
Se.c.o~S
~ e. So
~
("""0 V
+h...-e.
300
CAf'V\e
50
Is;'
first
IOOrY'\.<
A +-h. \ ~t~
3~
A
~e. 1'V'.a.. .•..
\IV\.
h.e.
+~€..,.-a.c
'1 u \.c... k -€.--l'\.. c
Ie;
sto
~il-
O-Cjo.lY'-
0"-
~
fS
~
e.cl
A
\$
h~ OS
\00
ex\:'
k
100"", S t- a..~
s:
d
S
D-.Y'\.
Y'Y\.
0...
a.'oc v...t
is:
}h.e..
It"-
v-f
:lr
nt
fV'.
Ot.
cl
Io...st
\A.
o.bov-.t
~.~V'-
A)
~
o-..lco\A.t
a..L-L':1 200W\..
b v.k, 6\A.t
rOt- c e.
Script F
5
V\.e..CL(""
9v\..\cker \ 0 C>
hi(.
I
s
.
fiV'i s ke....S
IS
PaS S' e.-S'
se.co n.d-
s p ee-d S
e.
t-iW'\e...
he
IS
~
C
o..bou...t
~
t'\..
pia..
A€.-xt
i-h.e.
-+h..o...
W'-
d
-t~€.
V"Aa.rK
t
+h~
-+-h...e.-
Or-.
S €..c0 A
IV'\
IOOi'V'\.
s
n. d
+hro \..L'j ~ 300
st
Nicola
239
'} \A. \
C
l:::
.e...AS
'-'e. ~\
IA.f ~h..LS
Suggested
mark scheme appliedJo the six scripts:
Script A
2 marks for 4 of these, or 1 mark for 2 of these
F
1
1
C
1
1
1
1
1
Near end, B overtakes A
1
1
1
1
B wins
1
1
1
1
A and B pass C
j
j
C starts running again
j
At start, C takes lead 1 mark for each of these.
E
B
After a while, estops
1
D
j
1
J
j
C runs at slower pace A slows down or B speeds up
.;
A is second or C is last
.;
j
j
.;
.;
j
J j
Quality of commentary
0
2
1
2
0
1
TOTAL
1
8
6
7
3
4
240
Classroom Discussion Checklist·
' 1 di u ion . Pupil are in ab ut th
ul :-
in .
h
r
n ~ r'
h
ion and rti ipat h r to not
"Li t n to what Jane i a rng "Than' Paul. now \\'hat do you thin u an?" .. How do yOU react to that ndr v.,.T " r th re an other idea ? .. "Could ou rep at that plea 'e Joanne?"
Occasion all be that of a "Questioner" or "Provoker" who:Introduces a new idea when the discussion is flagging Follows up a point of view Plays devil's advocate Focuses in on an important concept Avoids asking 'multiple', 'leading', 'rhetorical' or 'closed' questions, which only require monosyllabic answers
"What would happen if "What can you say about the point where the graph crosses' the axis?"
Never be that of a "Judge" or "Evaluator" who:Assesses every response with a 'yes', 'good' or 'interesting' etc. (This often prevents others from contributing alternative ideas, and encourages externally acceptable performances rather than exploratory dialogue.) Sums up prematurely.
"That's not quite what I had in mind". "You"re nearly there", "Yes, that's right". "No, you should have said ... " "Can anyone see what is wrong with Jane's answer'?"