12178-01a_Elsby_rev4.qxd
8/11/10
12:06 PM
Page 1
MICHAEL W. L. ELSBY University of Michigan
BART HOBIJN Federal Reserve Bank of San Francisco
AYS¸ EGÜL ¸S AHI· N Federal Reserve Bank of New York
The Labor Market in the Great Recession ABSTRACT From the perspective of a wide range of labor market outcomes, the recession that began in 2007 represents the deepest downturn in the postwar era. Early on, the nature of labor market adjustment displayed a notable resemblance to that observed in past severe downturns. During the latter half of 2009, however, the path of adjustment exhibited important departures from that seen during and after prior deep recessions. Recent data point to two warning signs going forward. First, the record rise in long-term unemployment may yield a persistent residue of long-term unemployed workers with weak search effectiveness. Second, conventional estimates suggest that the extension of Emergency Unemployment Compensation may have led to a modest increase in unemployment. Despite these forces, we conclude that the problems facing the U.S. labor market are unlikely to be as severe as the European unemployment problem of the 1980s.
S
ince December 2007, labor market conditions in the United States have deteriorated dramatically. The depth and duration of the decline in economic activity have led many to refer to the downturn as the “Great Recession.” In this paper we document the adjustment of the labor market during the recession and place it in the broader context of previous postwar
1
12178-01a_Elsby_rev4.qxd
2
8/11/10
12:06 PM
Page 2
Brookings Papers on Economic Activity, Spring 2010
downturns. What emerges is a picture of labor market dynamics with three key recurring themes: —From the perspective of a wide range of labor market outcomes, the recession that began in 2007 (hereafter “the 2007 recession”)1 represents the deepest downturn in the postwar era. —Early on, the nature of labor market adjustment in the 2007 recession displayed a notable resemblance to that observed in past severe downturns. —During the latter half of 2009, however, the path of adjustment exhibited important departures from that seen during and after prior deep recessions. These broad conclusions arise from a detailed investigation of the behavior of labor market stocks and flows over the course of the downturn.2 Our point of departure, in section I, is to document patterns over time in key labor market indicators—unemployment, employment, labor force participation, and hours per worker—during the 2007 recession. No matter what indicator of labor market activity we consider, the deterioration of labor market conditions during this recession is the worst on record since the late 1940s. Rates of unemployment among most major subgroups of the labor market reached postwar highs. From the perspective of the labor market, the 2007 recession is truly a Great Recession. As noted above, we nonetheless observe that many dimensions of these key indicators mirror those seen in past recessions. Labor force participation declined, reflecting the modest procyclicality observed in many postwar recessions; the relative contributions of the intensive and the extensive margins (that is, of changes in hours per worker and in the number of workers employed) to the decline in total labor input typify the conventional one-third hours to two-thirds bodies split observed in the past; and the constellation of demographic groups most affected—younger workers, male workers, less educated workers, and workers from ethnic minorities— is reminiscent of previous downturns. 1. We adopt this terminology because although the recession is widely believed to have ended in 2009, as of this writing the Business Cycle Dating Committee of the National Bureau of Economic Research (NBER) has not yet fixed an end date. In some of our figures, specification of an end date is unavoidable and is not intended as a firm judgment as to when the recession ended. 2. A drawback of the real-time nature of our analysis is that a detailed treatment of the cyclical behavior of wages is infeasible. Although timely aggregate compensation data are available, such data are plagued by countercyclical composition biases, as low-skilled workers are more likely to lose their jobs in time of recession. As emphasized by Solon, Barsky, and Parker (1994), obtaining an accurate sense of real-wage cyclicality requires the use of longitudinal microdata that are available in a less timely manner.
12178-01a_Elsby_rev4.qxd
8/11/10
12:06 PM
Page 3
MICHAEL W. L. ELSBY, BART HOBIJN, and AYS¸ EGÜL ¸S AHI· N
3
It is well known that changes in aggregate unemployment in the United States mask substantial variation in underlying worker flows, a point emphasized by Olivier Blanchard and Peter Diamond (1990). Reflecting this fact, in section II we investigate the sources of increased unemployment in the 2007 recession by analyzing the behavior of unemployment flows. This analysis reveals that both increased inflows into unemployment and declines in the rate at which workers flow out of the unemployment pool play crucial roles in accounting for the recent upswing in unemployment. As in previous severe recessions, the initial ramp-up in unemployment was accompanied by a sharp rise in inflows. In contrast to the claims of some recent literature on unemployment flows (Hall 2005, Shimer 2007), elevated rates of inflow in time of recession appear not to be a relic of past downturns, but rather a distinctive feature of severe recessions, both old and modern. The behavior of the outflow rate also mirrors that observed in past deep recessions: as the wave of inflows receded in the latter stages of the 2007 recession, the outflow rate continued to fall. Reflecting the distinctive severity of the downturn, recent data have seen the outflow rate reach a postwar low. Measures of unemployment flows for different labor force groups yield an important message on the sources of the disparate trends in unemployment across those groups: higher levels and greater cyclical sensitivity of joblessness among young, low-skilled, and minority workers, both in this and in previous downturns, are driven predominantly by differences in rates of entry into unemployment between these groups and others. In sharp contrast, a striking feature of unemployment exit rates is a remarkable uniformity in their cyclical behavior across labor force groups—the declines in outflow rates during this and prior recessions are truly an aggregate phenomenon. In the remainder of section II, we take advantage of a unique opportunity to assess the role of labor turnover in the 2007 recession. This is the first full upswing in unemployment covered by the new Job Openings and Labor Turnover Survey (JOLTS), which reveals some stark findings. In contrast to the behavior of unemployment inflows, rates of separation of workers from employers did not rise in the 2007 recession. This suggests support for a hypothesis offered by Robert Hall (2005): increases in unemployment inflows may have little to do with increased rates of job loss, but merely are a symptom of declining rates of job finding among potential job-to-job movers. Our analysis of the JOLTS data points to a different story: increased inflows into unemployment are driven predominantly by a change in the composition of separations toward
12178-01a_Elsby_rev4.qxd
4
8/11/10
12:06 PM
Page 4
Brookings Papers on Economic Activity, Spring 2010
layoffs, which are likely to result in unemployment, and away from quits, which often represent workers flowing to new jobs upon separation. Job loss played a key role in driving increased unemployment in the 2007 recession. We close our analysis in section III by assessing the outlook for the recovery of the labor market in the wake of the current downturn. Motivated by the recent subsidence of inflows into unemployment and the historic decline in the outflow rate from unemployment, we emphasize the importance of a rebound in the latter for future reductions in unemployment and highlight a potential cause for concern in recent data. The postwar U.S. labor market has been characterized by two remarkably stable aggregate relationships: the inverse co-movement of unemployment and vacancies—the Beveridge curve—and the positive association between the outflow rate from unemployment and the vacancy-unemployment ratio, a point noted by Robert Shimer (2005). The latter half of 2009 witnessed a break from these relationships, with unemployment rising higher than implied by the historical Beveridge curve, and the outflow rate from unemployment falling significantly below the path implied by the past relationship with the vacancy-unemployment ratio. These trends resemble those observed in the breakdown in efficiency of matching jobs with workers that accompanied the European unemployment problem of the 1980s, raising the concern of persistent unemployment, or hysteresis, in U.S. unemployment going forward. We consider a range of possible causes of hysteresis, including sectoral mismatch, the extension of the duration of unemployment insurance benefits, the dependence of unemployment outflow rates on the duration of unemployment, and reductions in the rates of worker flows—what Blanchard (2000) has termed “sclerosis.” Recent data point to two warning signs. First, the historic decline in unemployment outflow rates has been accompanied by a record rise in long-term unemployment. We show that this is likely to result in a persistent residue of long-term unemployed workers with relatively weak search effectiveness, depressing the strength of the recovery. Second, conventional estimates of the impact of longer unemployment benefit duration on the length of unemployment spells suggest that the extension of Emergency Unemployment Compensation starting in June 2008 is likely to have led to a modest increase in long-term unemployment. Nonetheless, we conclude that, despite these adverse forces, they have not yet reached a magnitude that would augur a European-style hysteresis problem in the U.S. economy in the long run.
12178-01a_Elsby_rev4.qxd
8/11/10
12:06 PM
Page 5
MICHAEL W. L. ELSBY, BART HOBIJN, and AYS¸ EGÜL ¸S AHI· N
5
I. Basic Facts about the Labor Market in the 2007 Recession The recession that started in December 2007 has been severe according to many measures, not least in terms of its effect on the labor market. In this section we review the recent behavior of some of the main aggregate measures of labor market outcomes and place the recent deterioration in labor market conditions in the broader historical context of previous postwar recessions.
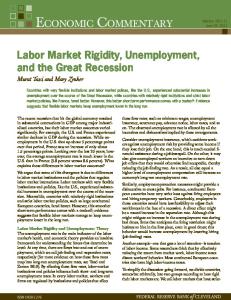
I.A. Unemployment, Employment, Labor Force Participation, and Hours per Worker The main labor market indicator on which much of this paper will focus is the unemployment rate. To set the stage, figure 1 displays the published time series for the civilian unemployment rate from Current Population Survey (CPS) data. The 2007 recession figures prominently in this series. Unemployment rose from a prerecession low of 4.4 percent to reach 10.1 percent in October 2009. This increase—5.7 percentage points—is the largest postwar upswing in the unemployment rate. It dwarfs the rise in joblessness in the two previous recessions, in 1990–91 and 2001, when in each case unemployment rose by approximately 2.5 percentage points. It dominates even the severe recession of 1973–75 (4.4 percentage points) as well as the combined effects of the consecutive recessions of the early 1980s (5.2 percentage points). There is little doubt that the present downturn is the deepest since World War II from the perspective of the labor market.3 In what follows we will closely examine the rise in unemployment in the present downturn. But it is helpful at this point to place the increase in joblessness in the broader context of other, related labor market indicators. We consider two sets of measures: first, the relationship between the rise in unemployment and the decline in employment during the downturn, and second, the role of the decline in employment relative to the decline in hours per worker in accounting for the contraction in total labor input. THE DECLINE IN EMPLOYMENT. The unemployment rate at a given point in time ut can be related to the level of employment Et and the size of the labor force Lt by the simple identity ut = 1 − (Et /Lt). This identity suggests a simple metric for gauging the relative roles of variation in employment 3. Of course, even the current ramp-up in the unemployment rate is overshadowed by that witnessed during the Great Depression. In 1929 the unemployment rate stood at 3.2 percent, rising to 25.2 percent by 1933, a 22-percentage-point rise in 4 years. Indeed, such is the extremity of the Great Depression that adding it to any plot renders the postwar variation in joblessness very difficult to perceive.
12178-01a_Elsby_rev4.qxd
6
8/11/10
12:06 PM
Page 6
Brookings Papers on Economic Activity, Spring 2010
Figure 1. Unemployment Rate, 1948–2010a Percent
10
8
6
4
2
1950 1955 1960 1965 1970 1975 1980 1985 1990 1995 2000 2005 2010 Source: Bureau of Labor Statistics data. a. Monthly data, seasonally adjusted. Shading indicates recessions.
and labor force participation in accounting for the upswing in unemployment, since (1)
dut = (1 − ut )[ d log ( Lt Pt ) − d log ( Et Pt )] ,
where Pt denotes the working-age population. The increase in the unemployment rate over the course of a recession can be decomposed into two parts, accounted for by logarithmic variation in the labor force participation rate and in the employment-population ratio. Figure 2 shows results of such an exercise. It plots the cumulative log deviations from trend of the employment-population ratio and the labor force participation rate, both taken from the CPS, for each of the last six recessions. Figure 2 conveys two related messages. First, the record upswing in the unemployment rate observed in figure 1 is mirrored by a record contraction in employment: employment declined relative to trend by 7 log points from the start to the trough of the 2007 recession, dominating the severe recession of the mid-1970s as well as the joint effects of the consecutive recessions of the early 1980s.
12178-01a_Elsby_rev4.qxd
8/11/10
12:29 PM
Page 7
MICHAEL W. L. ELSBY, BART HOBIJN, and AYS¸ EGÜL ¸S AHI· N
7
Figure 2. Cumulative Deviations from Trend of the Employment-Population Ratio and of Labor Force Participation in Six Recessionsa Log points 1 0 –1 –2 –3 –4
Log change in labor force participation rate
Log change in employmentpopulation ratio
–5 –6
2006Q4 2007Q2 2007Q4 2008Q2 2008Q4 2009Q2 2009Q4
2000Q4 2001Q2 2001Q4 2002Q2 2002Q4 2003Q2
1990Q2 1990Q4 1991Q2 1991Q4
1981Q3 1982Q1 1982Q3
1979Q4 1980Q2
1973Q4 1974Q2 1974Q4 1975Q2
–7
Source: Authors’ calculations using BLS data. a. Trend is estimated using a Hodrick-Prescott filter with a smoothing parameter of 100000.
Second, rather than contributing to the rise in unemployment, a reduction in labor force participation of around 2 log points muted the rise in joblessness in the 2007 recession. Figure 2 also reveals that the 2007 recession is no exception in this respect: almost all of the earlier downturns also exhibit at least a mild procyclicality of labor force participation. An interesting aspect of the response of labor force participation in the 2007 recession is that it seems to have had two stages. Mary Daly, Hobijn, and Joyce Kwok (2009a) note that during the first part of the recession, the labor force participation rate remained unexpectedly high. From May to December 2009, however, the labor force participation rate fell by 1.2 percentage points, its steepest decline since the 1950s. UNEMPLOYMENT AND GDP (OKUN’S LAW). One of the most robust aggregate statistical relationships for the U.S. economy is the inverse co-movement between changes in the unemployment rate and growth in GDP—Okun’s law (Okun 1962). Figure 3 displays a version of the Okun’s law relationship updated to include the 2007 recession. It plots the quarterly deviation
12178-01a_Elsby_rev4.qxd
8/11/10
12:06 PM
8
Page 8
Brookings Papers on Economic Activity, Spring 2010
Figure 3. Okun’s Law, 1949–2009 Unemployment gapa (percentage points) 2009Q4 2009Q3 2009Q2
5 4 3 2
2007 recession Other recessions No recession 2008Q2
2009Q1
2008Q1
2008Q4
1 0 –1
2008Q3
–2 –3 –4 –5 –8
–6
–4 –2 0 2 Output gapb (percentage points)
4
6
Source: Authors’ calculations using BEA, BLS, and CBO data. a. Deviation of the actual unemployment rate from its trend. b. Deviation of actual GDP from its trend, as estimated by the CBO.
from trend of the unemployment rate against the contemporaneous percentage deviation from trend of GDP, using estimates by the Congressional Budget Office (CBO) of the nonaccelerating-inflation rate of unemployment (NAIRU) and potential output up to January 2010.4 The regression line is based on the observations from 1949 through 2007, thus excluding the Great Recession. In the absence of large movements in potential output and the NAIRU, Okun’s law implies that for every 2 percentage points that output falls below trend, the unemployment rate will increase by about 1 percentage point. This rule of thumb performs remarkably well in the first part of the 2007 recession, from 2008Q1 through 2009Q1, as indicated in figure 3. Thus, as we have noted of other dimensions of the 2007 downturn, the adjustment of the labor market until the second quarter of 2009 is by no means an outlier relative to past recessions. The last nine months of 2009, however, wit4. Detrended unemployment and output data based on Hodrick-Prescott-filtered series yield very similar results.
12178-01a_Elsby_rev4.qxd
8/11/10
12:06 PM
Page 9
MICHAEL W. L. ELSBY, BART HOBIJN, and AYS¸ EGÜL ¸S AHI· N
9
nessed an important departure from Okun’s law: even though overall economic activity, as measured by GDP, rebounded in the second half, the unemployment rate continued to rise. This recent divergence between output and the labor market can be traced to high average labor productivity growth during that period,5 resulting in an increase in the unemployment rate in 2009 that surprised policymakers and forecasters alike. The exceptionally strong productivity growth during the early recovery also occurred during the jobless recoveries that followed the previous two recessions. We revisit the implications of this pattern for the current outlook in section III.6 HOURS VERSUS BODIES. The evidence presented thus far has pertained solely to measures of the number of persons in or out of work, and not to the number of hours worked per employed person. Here we summarize the behavior of each of these measures and identify their relative importance in driving the recent contraction in total labor input. Our point of departure is another simple accounting identity, namely, that total labor input Ht is the product of employment Et and hours per worker ht. It follows that the logarithmic decline in total hours worked during the recession may be decomposed into the sum of the respective logarithmic declines in Et and ht. Figure 4 performs this simple accounting exercise using data on employment and weekly hours per worker in the nonfarm business sector from the Labor Productivity and Costs program of the Bureau of Labor Statistics (BLS).7 It plots the cumulative log declines in employment and hours per worker for each of the last six recessions.8 The figure shows that although the 2007 recession is unusual in its severity, the adjustment of the labor market in this recession resembles that observed in prior recessions on two important dimensions. First, the reduction in hours per worker is steeper 5. Mulligan (2009, 2010) argues that the current downturn has been qualitatively different from previous severe recessions in that productivity growth remained normal while labor supply shifted to the left. He concludes that a reduction in labor supply or an increase in labor market distortions, or both, are major factors in the 2007 recession. 6. Nalewaik (this volume) suggests that the deviations from Okun’s law are less severe when one considers gross domestic income, the income-based measure of output, rather than GDP, which is based on the expenditure side of the national accounts. For a detailed analysis of the recent behavior of Okun’s law, see Gordon (2010). 7. The BLS series identifiers used for employment and weekly hours per worker are, respectively, PRS85006013 and PRS85006023. In constructing these series, the BLS combines data from the Current Employment Statistics and the CPS. Employment here includes both payroll employees and self-employed and unpaid family workers. 8. The recession dates used to construct figure 4 differ slightly from the official recession dates established by the Business Cycle Dating Committee of the NBER. They correspond to the quarters around the NBER recession dates over which total hours worked are observed to decline.
12178-01a_Elsby_rev4.qxd
8/11/10
12:06 PM
10
Page 10
Brookings Papers on Economic Activity, Spring 2010
Figure 4. Cumulative Declines in Employment and Weekly Hours per Worker in Six Recessions Log points 1 0 –1 –2 –3 –4
Log change in hours per worker
Log change in employment
–5 –6
2006Q4 2007Q2 2007Q4 2008Q2 2008Q4 2009Q2 2009Q4
2000Q4 2001Q2 2001Q4 2002Q2 2002Q4 2003Q2
1990Q2 1990Q4 1991Q2 1991Q4
1981Q3 1982Q1 1982Q3
1979Q4 1980Q2
1973Q4 1974Q2 1974Q4 1975Q2
–7
Source: Authors’ calculations using BLS data.
than that in employment in the early stage of all six recessions, with the contraction in employment becoming dominant later on. Second, employment in the 2007 recession fell by 7 log points, as figure 2 showed, but hours per worker also contracted, by 3 log points. (Total labor input thus declined by 10 log points, again more than in any other postwar recession.) This 70:30 bodies-hours split is in line with the conventional wisdom since at least Arthur Okun (1962) that the extensive margin (the number employed) accounts for around two-thirds of the cyclical variation in labor input. Reiterating this point, figure 4 also reveals that across the last six recessions, variation in employment accounts for approximately 50 to 80 percent of the decline in total labor input.
I.B. Who Has Been Hit Hardest? Underlying the acute surge in joblessness documented in figures 1 through 4 is a rich heterogeneity in the structure of unemployment across different groups in the labor force. Here we document this heterogeneity in the experience of unemployment across groups, focusing on four dimensions: sex, age, race, and educational attainment.
12178-01a_Elsby_rev4.qxd
8/11/10
12:06 PM
Page 11
MICHAEL W. L. ELSBY, BART HOBIJN, and AYS¸ EGÜL ¸S AHI· N
11
To assess the quantitative importance of these differences, table 1 reports the ratio of the rise in each group’s unemployment rate to the rise in the overall unemployment rate for the last five downturns, using data from the CPS. If the rise in unemployment were spread uniformly across different subgroups of the labor market, the ratios in table 1 would all equal 1. Instead we find that males, younger workers, and less educated workers, as well as members of ethnic minorities, experience steeper rises in joblessness during all recessions, including the 2007 recession.9 One aspect of the results in table 1 is worth highlighting. Although many commentators on the present downturn have emphasized its character as a “mancession,” table 1 reveals that all recessions have affected male workers disproportionately; the mancession is not a new phenomenon. S,ahin, Joseph Song, and Hobijn (2009) show that this pattern can be traced to the fact that industries in which male workers are concentrated, such as construction and durable goods manufacturing, are particularly sensitive to the business cycle.
I.C. Accounting for the Composition of the Labor Force Heterogeneity in the experience of unemployment across labor force groups is an important characteristic of joblessness in the 2007 recession. Recent decades have witnessed dramatic changes in this heterogeneity. We focus here on one particular dimension that has a crucial bearing on historical comparisons of unemployment rates: age structure. The labor force has become older since the 1980s as the baby-boom generation has aged—a point emphasized by Shimer (1998, 2001).10 Accounting for such 9. This finding echoes those of an abundant literature that has documented differences in the cyclical sensitivity of different demographic groups (see Clark and Summers 1981, Gomme and others 2004, Kydland 1984, and Mincer 1991, for example). 10. The online appendix to this paper (available on the Brookings Papers webpage at www.brookings.edu/economics/bpea.aspx, under “Conferences and Papers”) presents compositional adjustments for the full interaction of age, sex, race, and education, as well as for each dimension individually. Although the changing sex composition of the labor force has had very little impact, composition by race and education plays a role. The influx of immigrants since the 1970s has led to a greater fraction of Hispanic workers in the labor force, who in turn are more likely to experience an unemployment spell. On the other hand, increased educational attainment since the 1980s has shifted the structure of the labor force toward better-educated workers, who face lower unemployment rates on average (see Farber and Western 2010 for more on this topic). Shimer (1998) cautions against adjustments for educational composition, however. Workers with higher unobserved ability are likely to face lower unemployment rates conditional on education. As workers become more educated over time, the innate ability of each education group will decline, leading to an increase in that group’s unemployment rate. In addition, if the educational distribution shifts, employers may simply revise the educational requirements of jobs, leading to no real effect on the unemployment rate.
1.60 1.02 0.23 1.30 1.31 0.88 0.18 0.95 1.28 n.a. n.a.
12.6 5.0 3.5 8.8 5.4 4.3 2.6 5.4 12.1 8.8 4.6
2.3
0.90 1.61 1.73 n.a.
1.89 1.01 0.92 0.42
1.58 0.93 0.91
1.13 0.85
1990–91 recession
2.2
0.86 1.72 0.77 1.19
1.20 0.89 1.11 0.73
1.67 0.98 0.60
1.14 0.84
2001 recession
5.5
0.95 1.42 1.36 0.86
1.47 1.19 0.99 0.53
1.62 0.96 0.64
1.19 0.78
2007 recession
Source: Authors’ calculations using BLS data. Note that all calculations are based on quarterly data. a. Data for Hispanics are available only from 1982Q1 to 2009Q4, and for Asians only from 2000Q1 to 2009Q4. n.a. = Not available. b. Periods covered are, respectively, 1979Q2–1980Q3, 1981Q2–1982Q4, 1990Q2–1992Q3, 2000Q4–2003Q3, and 2007Q1–2009Q4. These dates may not correspond exactly to those of recessions as dated by the NBER Business Cycle Dating Committee. c. Measured from trough to peak, except for the 2007 recession, where it is measured from its most recent trough in 2007Q1 to 2009Q4.
3.3
0.90 1.65 n.a. n.a.
1.56 1.23 0.72 0.42
1.27 1.01 0.65
1.19 0.75
1981–82 recession
12:06 PM
1.9
1.42 0.42
6.2 6.3
1979–80 recession
Ratio of the change in the indicated group’s unemployment rate to the change in the overall employment rateb
8/11/10
Memorandum: change in overall unemployment ratec (percentage points)
Sex Male Female Age (years) 16–24 25–54 55 and over Educational attainment Less than high school High school diploma Some college College degree or higher Race or ethnicity White Black Hispanic Asian
Group
Group average unemployment rate, 1976Q1–2009Q4 (percent)
Table 1. Changes in the Unemployment Rates of Selected Demographic Groups Relative to Overall Unemployment in Five Recessions
12178-01a_Elsby_rev4.qxd Page 12
12178-01a_Elsby_rev4.qxd
8/11/10
12:06 PM
Page 13
MICHAEL W. L. ELSBY, BART HOBIJN, and AYS¸ EGÜL ¸S AHI· N
13
Figure 5. Age-Adjusted Unemployment Rate, 1948–2010a Percent
Published rate 10
8
6
4 Age-adjusted rateb 2
1950 1955 1960 1965 1970 1975 1980 1985 1990 1995 2000 2005 2010 Source: Authors’ calculations using BLS data. a. Monthly data. Shading indicates recessions. b. Rate that would prevail if the age structure of the labor force (the shares of workers aged 16-24, 25-34, 35-44, 45-54, and 55 and over) remained constant at its 2009 level.
compositional changes can paint a different picture of aggregate unemployment trends because each of these different labor force groups is systematically more or less likely than others to experience spells of unemployment. We implement a simple method for controlling for the impact of changes in the age composition of the labor force on trends in aggregate unemployment: we fix the labor force shares for each age group to their level at some reference date and then trace out the implied composition-adjusted unemployment series. Figure 5 performs this exercise using the most recent labor force shares and reveals an interesting finding: accounting for changes in age composition leads to a substantial downward revision of past unemployment rates, such that the age-adjusted unemployment rate in the 2007 recession reached its highest level in the postwar period.
II. Labor Market Flows in the 2007 Recession Another defining characteristic of the U.S. labor market is that it is in continual flux. Even when the aggregate economy is tranquil, many
12178-01a_Elsby_rev4.qxd
14
8/11/10
12:06 PM
Page 14
Brookings Papers on Economic Activity, Spring 2010
workers flow in and out of employment and unemployment. In time of recession these flows come into focus as proximate determinants of increases in joblessness: Does unemployment rise as a result of increased inflows as workers lose their jobs? Or does it rise because unemployed workers increasingly fail to find new jobs? Or is it some combination of the two? Based on the shallow downturns of 1990–91 and 2001, recent research has argued that the nature of labor market adjustment in time of recession has radically shifted in recent years. Hall (2005a, p. 397) states that “in the modern U.S. economy, recessions do not begin with a burst of layoffs.” Echoing this, in his study of unemployment flows, Shimer (2007, abstract) concludes that “fluctuations in the employment exit probability are quantitatively irrelevant during the last two decades.”11 Instead, in this view, increased unemployment duration, or a decline in the rate at which workers flow out of the unemployment pool, drives the entirety of contemporary variation in unemployment. In contrast, a long line of research on labor market flows before the last two recessions came to the conclusion that cyclical ramp-ups in unemployment are driven by both margins, inflows and outflows.12 More recent work has revived this conclusion and identified a clear pattern to unemployment flows in recessions: increases in unemployment are preceded by sharp rises in unemployment inflows, followed by more prolonged periods of elevated unemployment duration.13 That literature pointed toward cyclical ramp-ups in unemployment being driven by both margins, with inflows being relatively more dominant early in recessions. The 2007 downturn provides an opportunity to assess these conclusions: is a diminished role of job loss a feature of modern recessions, or of shallow recessions? We explore this question using updated estimates of unemployment transitions from a variety of data sources.
11. Shimer (2007) uses the term “employment exit probability” to refer to the probability of entering unemployment. We do not use this terminology because employment exit can be taken to mean a flow from employment to either unemployment or nonparticipation in the labor force, and may even be taken to mean any separation from employment, which would also include job-to-job flows. 12. See, among others, Perry (1972), Marston (1976), Blanchard and Diamond (1990), and Baker (1992). 13. See Braun, De Bock, and DiCecio (2006), Davis (2006), Elsby, Michaels, and Solon (2009), Fujita and Ramey (2009), Kennan (2006), and Yashiv (2008).
12178-01a_Elsby_rev4.qxd
8/11/10
12:06 PM
Page 15
MICHAEL W. L. ELSBY, BART HOBIJN, and AYS¸ EGÜL ¸S AHI· N
15
II.A. The Ins and Outs of Unemployment in the 2007 Recession A first glimpse of the dynamics of unemployment flows can be obtained from published time series from the CPS.14 Shimer (2007) describes a method that uses monthly series on the number of workers employed, the number unemployed, and the number unemployed for less than 5 weeks to infer the rates at which workers enter unemployment and unemployed workers exit unemployment. His point of departure is the following description of the path of the unemployment stock Ut: (2)
dU dt = st ( Lt − U t ) − ftU t ,
where st and ft are, respectively, the unemployment inflow and outflow rates, Lt is the labor force, and t indexes months. Although some recent literature has referred to st and ft as “separation” and “job-finding” rates, respectively, we instead use the terms “inflow” and “outflow” rates, for two reasons. First, many separations from employers do not result in a flow into unemployment, a point to which we return in section II.C. Second, ft includes flows from unemployment to nonparticipation as well as to employment. The cyclical properties of the outflow rate in the 2007 and prior recessions are almost identical to those of transitions from unemployment to employment in longitudinally linked microdata.15 We focus on the outflow rate because it is the proximate driving force for the changes in the unemployment rate, and because it is much more transparent to compute.16 The goal of the analysis is to relate variation in the unemployment rate ut = Ut /Lt to variation in the flow hazards st and ft. To that end, we first need
14. Throughout the remainder of this section we focus on unemployment flows estimated from CPS time series, rather than the longitudinally matched monthly CPS microdata (the so-called gross flows data). This choice is informed by the fact that important measurement issues accompany the use of the gross flows data, including spurious transitions driven by measurement error in reported labor market states in consecutive monthly surveys, nonrandom attrition from the sample, and discrepancies between published changes in aggregate labor market stocks and those implied by the gross flows. 15. It is difficult to make strong statements on the importance of the distinction as one uses increasingly disaggregated data. The reason is that as one disaggregates the CPS data further, cell sizes start getting smaller and sampling variance worsens, yielding noisy estimates. This problem is aggravated when one uses longitudinally linked microdata, as in practice only a fraction of the CPS sample can be matched across months. 16. An implicit assumption underlying equation 2 is that all inflows into unemployment originate from employment, Lt − Ut. In fact, as we will show in what follows, in the United States a substantial fraction of inflows originate from nonparticipation. We relax this simplifying assumption in section II.C.
12178-01a_Elsby_rev4.qxd
16
8/11/10
12:06 PM
Page 16
Brookings Papers on Economic Activity, Spring 2010
to estimate these flow rates. Following Shimer (2007), we compute the monthly outflow probability, (3)
Ft = 1 − [(U t +1 − U t<+11 ) U t ] ,
<1 is the stock of workers who report having been unemployed for where Ut+1 less than one month.17 Intuitively, the term inside the brackets is the fraction of the unemployed in month t who remain unemployed the next month, the complement of which is the monthly outflow probability. This can then be mapped into a Poisson outflow hazard rate ft = −log(1 − Ft). Obtaining an estimate of the inflow rate is slightly more involved. Assuming that the flow hazards st and ft and the labor force Lt are constant between surveys, one can solve equation 2 forward one month to obtain
(4)
U t +1 = λ tU t* + (1 − λ t )U t .
Here unemployment is a weighted average of the flow steady-state level of unemployment U* t = st Lt /(st + ft ) and last month’s unemployment Ut, with the weight given by the monthly rate of convergence to the steady state, λt = 1 − e−(st+ft). Since we observe the labor force and unemployment stocks in each month, with an estimate of the outflow rate ft in hand, equation 4 becomes a nonlinear equation that can be solved for the inflow rate st. As emphasized by Shimer (2007), this procedure for estimating st implicitly corrects for a time aggregation bias arising from inflows within a given month exiting before the next month’s survey. Figure 6 plots quarterly averages of the estimated monthly time series for the rates of inflow to and outflow from unemployment, using the most recent CPS data up to 2009Q4. The figure highlights a number of interesting properties of the dynamics of unemployment flows in past recessions. First, as emphasized in the entirety of research on unemployment flows, both old and new, the outflow rate from unemployment is markedly procyclical, exhibiting systematic and prolonged downswings in all recessions. Second, the inflow rate into unemployment is countercyclical, exhibiting sharp upswings at the onset of all recessions that tend to subside quickly by the end of the recession. Third, the response of unemployment 17. As noted by Polivka and Miller (1998) and Abraham and Shimer (2001), the published BLS time series on short-term unemployment displays a discontinuous decline following the CPS redesign in 1994, due to a change in the way unemployment duration was recorded. We correct the published postredesign series by rescaling it by a factor of 1.16. See Elsby, Michaels, and Solon (2009) for more details.
12178-01a_Elsby_rev4.qxd
8/11/10
12:06 PM
Page 17
MICHAEL W. L. ELSBY, BART HOBIJN, and AYS¸ EGÜL ¸S AHI· N
17
Figure 6. Unemployment Inflow and Outflow Rates, 1948–2009 a Monthly hazard rate
Monthly hazard rate
1.0
Inflow rate (right scale)
0.05
0.8
0.04
0.6
0.03
0.4
Outflow rate (left scale)
0.2
0.02
0.01
1950 1955 1960 1965 1970 1975 1980 1985 1990 1995 2000 2005 Source: Authors’ calculations using BLS data. a. Quarterly averages of monthly data. Shading indicates recessions.
inflows in the relatively mild recessions that began in 1990 and 2001 appears to be muted in comparison to other episodes, a point that echoes the recent conclusions of Hall (2005b, 2007) and Shimer (2007). At this point we can return to the question that motivated this part of our analysis: to what extent is the cyclical ramp-up in unemployment accounted for by changes in these flow hazard rates? Elsby, Ryan Michaels, and Gary Solon (2009) provide a simple method for answering this question. Their starting point is the observation, noted by many analysts of U.S. unemployment flows, that the U.S. unemployment rate is very closely approximated by its flow steady-state value, that is: (5)
ut ⬅ U t Lt ≈ u*t ⬅ st ( st + ft ) .18
Equation 5 is useful for our purposes because it provides a link between variation in the unemployment stock and variation in the constituent flow 18. To see why this is so, note that the sum of the inflow and outflow rates st + ft typically exceeds 0.5 on a monthly basis in the United States. An implication is that the rate of convergence to flow steady state λt in equation 4 tends to be very high in practice.
12178-01a_Elsby_rev4.qxd
8/11/10
12:06 PM
18
Page 18
Brookings Papers on Economic Activity, Spring 2010
Figure 7. Cumulative Changes in Unemployment Inflow and Outflow Rates in Six Recessionsa Log points
80
60 Log change in outflow rate
Log change in inflow rate
40
20
2007Q1 2007Q3 2008Q1 2008Q3 2009Q1 2009Q3
2000Q4 2001Q2 2001Q4 2002Q2 2002Q4 2003Q2
1990Q2 1990Q4 1991Q2 1991Q4 1992Q2
1981Q3 1982Q1 1982Q3
1979Q3 1980Q1 1980Q3
1973Q4 1974Q2 1974Q4 1975Q2
0
Source: Authors’ calculations using BLS data. a. Quarterly averages of monthly data.
hazard rates. Elsby, Michaels, and Solon (2009) show that simple log differentiation of this approximate relationship implies that (6)
Δ ut ≈ β t −1 [ Δ log st − Δ log ft ] , where β t −1 = ut −1 (1 − ut −1 ) .
Equation 6 has a simple message: to compare changes in inflow and outflow rates on an equal footing with respect to changes in unemployment, all one needs to do is compare the logarithmic variation in each of the flow hazards. Figure 7 depicts the results from applying this decomposition of unemployment variation for each recession since 1973. We identify start and end dates for each recessionary ramp-up in unemployment since 1973 and compute the cumulative logarithmic difference in inflow and outflow rates relative to their values at the start of the recession. In many ways figure 7 confirms the qualitative picture suggested in figure 6. In all recessions, inflows account for a substantial fraction of unemployment variation early
12178-01a_Elsby_rev4.qxd
8/11/10
12:06 PM
Page 19
MICHAEL W. L. ELSBY, BART HOBIJN, and AYS¸ EGÜL ¸S AHI· N
19
on and then subside. In contrast, the contribution of the outflow rate becomes more dominant as each recession progresses. For our current focus, there are two noteworthy aspects of figures 6 and 7. First, mirroring the conclusions of section I on labor market stocks, the behavior of unemployment flows in the initial stages of the current downturn bears a striking resemblance to the dynamics of unemployment flows in past severe recessions. The early quarters of the current ramp-up in unemployment are characterized by a wave of inflows that has since partly receded. The contribution of the inflow rate is almost identical to that observed in the 1974 downturn. Thus, to return to the question that motivated this analysis, sharp spikes in the rate of inflow into unemployment appear to be a feature of severe recessions, rather than only of older ones. Figures 6 and 7 also shed light on what is new about the current downturn. Figure 6 reveals that the unemployment outflow rate fell to a historic low of 24 percent in 2009Q3. This is not just a consequence of the secular trend toward declining outflow hazards shown in figure 6: figure 7 shows that the outflow rate fell by over 80 log points in the current downturn, more than in any of its postwar counterparts, echoing the conclusion of section I that this is the deepest postwar downturn in terms of labor market outcomes. We return to this phenomenon in section III, when we discuss its implications for the recovery.
II.B. Unemployment Flows by Labor Force Group In section I.B we showed that changes in unemployment rates have differed substantially across demographic groups during the 2007 recession, with some groups hit harder than others. We now look into the sources of this heterogeneity by examining unemployment flows across groups. We focus on the same four dimensions of heterogeneity as in section I.B. Estimation of the flow hazards for each labor force group mirrors the aggregate analysis above.19 Figure 8 displays the series for the inflow and outflow hazards for each group. They are calculated as 12-month moving averages to smooth out noise induced by the greater sampling variance that
19. The BLS publishes seasonally unadjusted estimates of unemployment by duration starting from the mid-1970s by sex, age, and race. As in section I.B, for education groups we use the CPS monthly microdata files from January 1976 onward to construct measures of the number unemployed less than 5 weeks, the total number unemployed, and the total number employed, by group. We then seasonally adjust the raw data using the Census’ X12 procedure and compute the monthly outflow and inflow rates using the analogues to equations 3 and 4 that hold for each group. As before, we also correct for discontinuities in the series for short-term unemployment by group induced by the redesign of the CPS in 1994.
12178-01a_Elsby_rev4.qxd
8/11/10
12:06 PM
20
Page 20
Brookings Papers on Economic Activity, Spring 2010
Figure 8. Unemployment Flows by Demographic or Educational Group, 1976–2009a By sex Inflows
Outflows Monthly hazard rate
Monthly hazard rate
Women
Women
0.5
0.04 Men
0.25
Men
0.02
0.13
0.01
1980 1985 1990 1995 2000 2005
1980 1985 1990 1995 2000 2005
By age Outflows
Inflows
Monthly hazard rate
Monthly hazard rate 16–24
0.5
16–24
0.08
25–54
0.04 0.25
55 and over
25–54
0.02
0.13 1980 1985 1990 1995 2000 2005
0.01
55 and over
1980 1985 1990 1995 2000 2005
By race or ethnicity Outflows
Inflows
Monthly hazard rate White
Monthly hazard rate Black
Hispanic
0.06
0.5 Black
0.25
0.03 Asian
0.13
Hispanic White
0.02
Asian
0.01 1980 1985 1990 1995 2000 2005
1980 1985 1990 1995 2000 2005
By educational attainment Outflows
Inflows
Monthly hazard rate 12–15 years
Monthly hazard rate Less than 12 years
0.4
0.04 0.02
16 or more years
0.2
Less than 12 years
12 years
1980 1985 1990 1995 2000 2005
0.01
12 years 12–15 years 16 or more years
1980 1985 1990 1995 2000 2005
Source: Authors’ calculations using BLS data. a. Twelve-month moving averages of monthly data. Shading indicates recessions. Logarithmic scale.
12178-01a_Elsby_rev4.qxd
8/11/10
12:06 PM
Page 21
MICHAEL W. L. ELSBY, BART HOBIJN, and AYS¸ EGÜL ¸S AHI· N
21
accompanies these more disaggregated series. In accordance with the message of equation 6, the flow hazards are plotted on log scales. Figure 8 has a rich set of implications for the structure of joblessness across groups. Perhaps its most prominent feature is the remarkable uniformity in both the levels and the cyclical behavior of outflow rates across groups within each dimension (left-hand panels). Most striking are the series by education group, for which the exit rates are virtually indistinguishable since 1976 (echoing the findings of Mincer 1991). In the 2007 recession the log decline in outflow hazards is almost identical across groups in all dimensions. Reductions in the outflow rate that accompany recessions, from both a qualitative and a quantitative perspective, are truly an aggregate phenomenon. In stark contrast, there are large differences in rates of inflow into unemployment across groups (right-hand panels of figure 8). Comparison of these with the heterogeneity of unemployment across groups in table 1 reveals a close link: the same groups that face high unemployment rates—young workers, less educated workers, and workers from ethnic minorities—also face markedly high rates of entry into unemployment. This comparison indicates that the bulk of the large differences in unemployment across groups observed in table 1 is driven by differences in each group’s propensity to enter unemployment, rather than differences in the duration of their spells. In addition to revealing large differences in the levels of unemployment across groups, table 1 demonstrated that some groups face greater increases in unemployment in time of recession. What can account for this? Recalling equation 6, we can write the change in group j’s unemployment rate as (7)
Δ u j, t ≈ β j, t −1 ⎡⎣ Δ log s j , t − Δ log f j , t ⎤⎦ , where β j, t −1 = u j, t −1 (1 − u j , t −1 ) .
One possibility, then, is that these groups simply faced larger logarithmic changes in their constituent flow hazards. Figure 8 reveals that this is precisely what accounts for the surge in unemployment of men relative to women in the current recession: male and female outflow rates have been essentially identical, but men have faced a much larger increase in inflows—a point emphasized by S,ahin and others (2009).20
20. These authors explore this phenomenon using longitudinally linked monthly CPS microdata to estimate labor market flows among unemployment, employment, and nonparticipation. Consistent with figure 8, they find that for men the employment-to-unemployment transition rate increased more than it did for women, whereas the unemployment-to-employment transition rate declined proportionally across the two groups.
12178-01a_Elsby_rev4.qxd
22
8/11/10
12:06 PM
Page 22
Brookings Papers on Economic Activity, Spring 2010
But this is not the whole story. For age, race, and education groups, there is little difference in the cyclicality of unemployment flows, and what differences exist tend to predict the opposite of the pattern depicted in table 1. For example, in the 2007 recession, outflow rates among young workers aged 16 to 24 fell just as much as for older workers, and their inflow rates have hardly risen. Yet in table 1 the unemployment rate among 16- to 24-year-olds rose substantially more than aggregate unemployment. The answer to this puzzle lies in equation 7: for values of the groupspecific unemployment rates uj,t observed in table 1 (as for all values lying below one-half), βj,t−1 is increasing in uj,t−1. Thus the higher the unemployment rate faced by an individual group, the greater the responsiveness of the group’s unemployment rate to changes in its constituent flow hazards. Intuitively, equation 7 implies that changes in the flow hazards have a logarithmic influence on unemployment: a doubling of, for example, the inflow hazard leads to an almost doubling of the unemployment rate. The higher a group’s unemployment rate, then, the more cyclically sensitive that rate is. Figure 8 reveals that this observation can account entirely for the greater cyclical sensitivity of unemployment among youth, ethnic minorities, and the less educated in the 2007 recession, and indeed in all recessions over the sample period. Combining this with our earlier observation that the bulk of the differences in unemployment levels, and thereby of βj, across groups can be attributed to differences in rates of entry into unemployment yields an interesting implication: the majority of the variation in both the levels and the cyclical sensitivity of group unemployment rates can be accounted for by differences in the level of inflow rates across groups.
II.C. The Role of Job Loss in the 2007 Recession The previous sections have shown that unemployment inflows are a proximate driving force of the increase in unemployment in the 2007 recession, and that they play an important role in accounting for cross-sectional differences in the level and cyclicality of unemployment across groups. It is tempting to conclude that this constitutes evidence that job loss has played a key role in the 2007 recession. In this section we delve into this observation to uncover the mechanisms that can account for these elevated inflow rates. We address two important conceptual distinctions. First, as mentioned above, estimates of the unemployment inflow rate, st based on equation 4,
12178-01a_Elsby_rev4.qxd
8/11/10
12:06 PM
Page 23
MICHAEL W. L. ELSBY, BART HOBIJN, and AYS¸ EGÜL ¸S AHI· N
23
are based on the implicit assumption that all inflows into the unemployment pool originate from employment rather than nonparticipation. In fact, new entrants and reentrants to the labor force account for around 40 percent of the unemployment stock. Consequently, estimates of st conflate two economically distinct driving forces for entry into unemployment: flows from nonparticipation brought about by the process of labor force entry, and flows from employment to unemployment that are associated with elevated rates of job loss. Second, job loss is often taken to mean a separation from an employer rather than an inflow into the unemployment pool. But workers leaving an employer can, and frequently do, line up new jobs without an intervening unemployment spell, a point that has been made since Peter Mattila (1974) and more recently by Bruce Fallick and Charles Fleischman (2004) and E´va Nagypál (2008). In what follows, we bring to bear a range of additional data that speak to these distinctions. UNEMPLOYMENT INFLOWS BY REASON FOR UNEMPLOYMENT. It is possible to distinguish among different sources of unemployment flows using publicly available monthly time series from the CPS on the total number unemployed and the number unemployed for less than 5 weeks by reason for unemployment. We focus on three main reasons for unemployment: job loss (layoffs), job leaving (quits), and labor force entry.21 An important benefit of this breakdown is that the first two categories originate from employment whereas the third originates from nonparticipation, allowing us to distinguish flows from employment to unemployment associated with job loss from the flows from nonparticipation to unemployment that accompany labor force entry.22 21. One can further decompose job losers into those on temporary versus those on permanent layoff, and labor force entrants into new entrants and reentrants. We do not distinguish among these, principally because the redesign of the CPS in 1994 led to substantial changes in the definitions of these subgroups and associated discontinuities in their time series. See Polivka and Miller (1998). 22. A potential concern when distinguishing between job leavers and job losers in the CPS data is that the distinction, much like the unemployment-nonparticipation distinction, can be blurred. Poterba and Summers (1984) find that although few job losers alter their reported reason for unemployment from month to month, around 25 percent of job leavers in May 1976 reported in the next month’s survey that they lost their job. We are less concerned about this for two reasons. First, as shown in figure 9, job leavers make up such a small fraction of unemployment inflows that such response error is unlikely to distort the job loser inflow rate, our primary focus in this section. Second, we will show in figure 11 that the cyclical properties of the job loser inflow rate implied by household responses in the CPS are strikingly similar to those of the layoff separation rate implied by establishment responses in the JOLTS data.
12178-01a_Elsby_rev4.qxd
8/11/10
24
12:06 PM
Page 24
Brookings Papers on Economic Activity, Spring 2010
Figure 9. Unemployment Inflows by Reason for Unemployment, 1968–2009 a Monthly hazard rate
Labor force entrantsb 0.03
Layoffs 0.02
0.01 Quits
1970
1975
1980
1985
1990
1995
2000
2005
2010
Source: Authors’ calculations based on the method of Elsby, Michaels, and Solon (2009) using BLS data. a. Quarterly averages of monthly data. Shading indicates recessions. b. Includes both reentrants and new entrants.
Elsby, Michaels, and Solon (2009) describe how these data can be used to infer estimates of unemployment flows by reason for unemployment.23 Figure 9 shows that, as these authors emphasize, all of the observed countercyclicality in the aggregate inflow rate noted above is driven by a markedly countercyclical layoff inflow rate. The quit inflow rate is comparatively very low and mildly procyclical, thereby dampening the observed countercyclicality of aggregate inflows. In addition, inflows due to labor force entry are essentially acyclical, further moderating the rise in the aggregate inflow rate in time of recession. The impression given by figure 9, and one that is a unifying theme of the present paper, is that the behavior of unemployment inflows by reason 23. There is a slight difference between the method used by Elsby, Michaels, and Solon (2009) to compute inflow rates by reason for unemployment and that used by Shimer (2007) to compute the aggregate inflow rate. Elsby and coauthors use a discrete time correction for time aggregation bias, whereas Shimer uses a continuous time correction. The results reported in Elsby, Michaels, and Solon (2009) suggest that this difference is not quantitatively important.
12178-01a_Elsby_rev4.qxd
8/11/10
12:06 PM
Page 25
MICHAEL W. L. ELSBY, BART HOBIJN, and AYS¸ EGÜL ¸S AHI· N
25
in the current downturn is again very reminiscent of past recessions. The behavior of the layoff inflow rate in particular suggests a simple two-way classification of recessionary episodes: deep recessions, such as that starting in 1974, the Volcker disinflation period of the early 1980s, and the present downturn, are characterized by markedly elevated layoff inflow rates; milder recessions, such as those starting in 1990 and 2001, are typified by a more modest increase in inflows due to layoffs. Again, the message of the 2007 recession is that severe modern recessions share many of the characteristics of deep recessions in the past. EVIDENCE FROM LABOR TURNOVER. The fact that unemployment inflows rose markedly in the 2007 recession, and that layoff inflows dominated that trend, is suggestive of job loss playing a key role in driving cyclical rises in unemployment. But it is not necessarily conclusive. As noted by George Perry (1972) and recently reemphasized by Hall (2005), elevated rates of inflow into unemployment need not be the outcome of elevated rates of separation from employers: increased inflows in time of recession can occur if workers are increasingly unable to line up new jobs immediately upon separation. Under this alternative hypothesis, countercyclical inflows are a symptom of declining rates of job finding among potential job-to-job movers, rather than of elevated rates of job loss. The 2007 recession provides a unique opportunity to assess these competing hypotheses: it is the first recession covered from its onset by the new Job Openings and Labor Turnover Survey (JOLTS).24 This is crucial for our present purpose because it provides a representative measure of the rate at which employed workers separate from their employers in the United States. More formally, denote the separation rate from employers by σt, and the employment-to-unemployment inflow rate by s teu. Note that a measure of the latter is given by the sum of the layoff and quit inflow rates presented above, s teu = sl,t + sq,t. It follows that we can relate σt and s teu simply according to (8)
steu = pt σ t ,
where pt denotes the probability that a worker who separates from her employer in month t subsequently flows into unemployment. Figure 10 plots the published JOLTS time series for the separation rate σt and the employment-to-unemployment transition rate s eu t implied by the CPS data. These series reveal a stark set of facts. First, the two rates differ 24. JOLTS data are available only back to December 2000 and therefore miss part of the ramp-up in unemployment in the 2001 recession.
12178-01a_Elsby_rev4.qxd
8/11/10
26
12:06 PM
Page 26
Brookings Papers on Economic Activity, Spring 2010
Figure 10. Separation Rate and Employment-to-Unemployment Transition Rate, 1998–2009 Percent of employmenta 4.5 4.0
Separation rateb
3.5 3.0 2.5 2.0 1.5 1.0
Employment-to-unemployment transition ratec
0.5 1998 1999 2000 2001 2002 2003 2004 2005 2006 2007 2008 2009 Source: Authors’ calculations using BLS data. a. Monthly data and rates. Shading indicates recessions. b. Includes all separations of workers from employers (job losers and job leavers), whether leading to unemployment or not. c. Includes all transitions from employment to unemployment.
substantially at all points in time, a fact that is suggestive of the abundance of job-to-job transitions in the U.S. economy, as emphasized by Fallick and Fleischman (2004) and Nagypál (2008). Second, whereas the employmentto-unemployment inflow rate has increased in the current downturn, the separation rate has, if anything, fallen slightly. At first blush, then, it would seem that the elevated rate of inflow into unemployment during the 2007 recession is driven wholly by reductions in the rate at which workers line up new jobs. The results presented in figure 10 would seem to provide ample support for Hall’s (2005) hypothesis that in today’s economy, job loss has little to do with increased unemployment in time of recession. We argue that such a conclusion would be premature. It has long been recognized that the relatively modest cyclical behavior of separations masks substantial cyclicality in its constituent elements: quits and layoffs. These tend to display markedly opposite cyclical patterns: the quit rate moves procyclically, whereas the
12178-01a_Elsby_rev4.qxd
8/11/10
12:06 PM
Page 27
MICHAEL W. L. ELSBY, BART HOBIJN, and AYS¸ EGÜL ¸S AHI· N
27
Figure 11. Separations and Unemployment Inflows from Quits and Layoffs, 1998–2009 Percent of employmenta
3.1 Quit separation rateb
Layoff separation ratec
1.6 Layoff inflow rated 0.8
0.4
0.2
Quit inflow ratee
1998 1999 2000 2001 2002 2003 2004 2005 2006 2007 2008 2009 Source: Authors’ calculations using BLS data. a. Monthly data and rates. Shading indicates recessions. Logarithmic scale. b. Includes all voluntary separations, whether transitioning to another job or to unemployment or to nonparticipation. c. Includes all involuntary separations, whether transitioning to another job or to unemployment or to nonparticipation. d. Includes only involuntary separations, leading to unemployment. e. Includes only voluntary separations, leading to unemployment.
layoff rate moves countercyclically.25 Figure 11 plots economy-wide layoff and quit rates from the JOLTS data for the current downturn and reveals that, as with unemployment flows, the behavior of labor turnover is again remarkably consistent with historical trends in these series. Accounting for the difference between quits and layoffs allows a more revealing investigation of the relationship between separations and unemployment inflows than in equation 6. The employment-to-unemployment transition rate can be decomposed as follows: (9)
steu = pl , t σ l, t + pq, t σ q ,t = ⎡⎣ω t pl , t + (1 − ω t ) pq ,t ⎤⎦ σ t , ��������� pt
25. See, for example, Slichter (1919), Woytinsky (1942), Akerlof, Rose, and Yellen (1988), and Anderson and Meyer (1994).
12178-01a_Elsby_rev4.qxd
28
8/11/10
12:06 PM
Page 28
Brookings Papers on Economic Activity, Spring 2010
where subscripts l and q, respectively, denote layoffs and quits, σ = σl + σq is the aggregate separation rate, and ω = σl /σ is the share of layoffs in aggregate separations. Equation 9 therefore highlights an additional channel by which employment-to-unemployment transitions may increase, namely, through changes in the composition of separations (layoffs versus quits) that occur during recessions ω.26 Figure 11 clarifies this point. It depicts the quit separation rate σq from the JOLTS data along with the quit inflow hazard into unemployment sq derived from the CPS data using the method described in the previous section. At all points in time, workers who quit their previous job face a very low probability of subsequently entering unemployment: pq averages just 16 percent over the sample period. Job-to-job flows drive an important wedge between separations and unemployment inflows due to quits. It is for this reason that quits account for only a small fraction of unemployment inflows. In addition, the implied series for pq displays no cyclical pattern: it fell steadily from approximately 20 percent in 2001 to 14 percent in 2009. These two observations—that pq is small, and that it has not risen in the current downturn—account for why the contribution of quits to increased unemployment inflows is not significant in the current downturn. A quite different story holds for layoffs. Figure 11 shows that, at all points in time, laid-off workers face a very high probability of entering unemployment: pl averages 91 percent since 2001. Job-to-job flows do not appear to be prevalent among laid-off workers. Moreover, although the gap between the separation and the inflow rates for layoffs closed in the early part of the current downturn, the rise in pl accounts for only a small fraction of the overall rise in unemployment inflows, and for perhaps onequarter of the overall rise in the layoff inflow rate. Figure 11 therefore provides a unique perspective on the rise in unemployment inflows during the 2007 recession. As suggested by Hall (2005), elevated rates of entry into unemployment are not driven by increases in the overall rate at which workers separate from employers. But in contrast to the claims of recent literature, job loss nonetheless plays a crucial role in accounting for recessionary unemployment: increased inflows into unemployment can be traced to a shift in separations during 26. As with so much of the analysis of unemployment flows, this compositional point was first noted by Perry (1972), who refers to workers flowing into potential unemployment as possessing “lottery tickets” for avoiding entry into unemployment. In his words, “Those who enter the flow because they quit voluntarily have better lottery tickets than those who enter it because they are laid off. Since quits fall and layoffs rise when unemployment rises, the quality of the average lottery ticket of workers in the pool . . . will deteriorate. . . .” (p. 267).
12178-01a_Elsby_rev4.qxd
8/11/10
12:06 PM
Page 29
MICHAEL W. L. ELSBY, BART HOBIJN, and AYS¸ EGÜL ¸S AHI· N
29
the recession toward layoffs, and these laid-off workers are very likely to flow into unemployment. An increase in the layoff rate therefore played a central role in accounting for the increased rate of entry into unemployment in the 2007 recession.
III. Outlook for Recovery in the Labor Market Until now we have concentrated on analyzing the behavior of labor market stocks and flows associated with the rise in unemployment in the 2007 recession. In this section we turn to the prospects for the labor market going forward. Two features of figure 6 provide a first glimpse of the central features that will guide the recovery. First, since the spike in the unemployment inflow rate has largely subsided, the key to any future decline in unemployment is a recovery of the outflow rate. Second, the decline in the outflow rate that has accompanied the 2007 recession has been much more severe than in past recessions, making its recovery all the more salient. One can think of the relative strength of the rebound in the outflow rate as determined by two things. First, how many new job openings will be created? Second, for a given increase in the number of vacancies, how quickly will the pool of unemployed find new jobs?
III.A. Vacancy Creation Job creation reflects the overall health of the economy, and it is expected that as aggregate activity recovers, vacancy creation will also start to increase. However, many factors affect the timing and the level of vacancy creation during recoveries. One positive factor for the recovery from the 2007 recession is the additional strength in vacancy creation due to the alleviation of the credit constraints that resulted from the financial crisis. Moreover, since the resolution of the financial crisis is likely to cause a substantial decline in aggregate and individual uncertainty, firms’ willingness to hire could increase significantly. In particular, the passing of the crisis implies a drastic reduction in the probability of a detrimental aggregate economic outcome. As Ben Bernanke (1983) points out, such a reduction in the probability of “bad news” will increase the likelihood that firms will make the decisions to invest and hire, which are costly to reverse. There are also reasons to imagine that the factors that explain the jobless recoveries of the 1990–91 and 2001 recessions are likely to be absent during the current episode. Tim Willems and Sweder van Wijnbergen
12178-01a_Elsby_rev4.qxd
30
8/11/10
12:06 PM
Page 30
Brookings Papers on Economic Activity, Spring 2010
(2009) argue that labor hoarding can explain the jobless recoveries following the two earlier recessions. Labor hoarding is more likely during shallow recessions but much less likely during a deep recession like that of 2007, which exhibited sharp rises in rates of job loss. Similarly, Thijs van Rens (2004) and Kathryn Koenders and Richard Rogerson (2005) have argued that firms used the previous two recessions as an opportunity to improve their organizational efficiency and productivity. Since the 2001–07 expansion was neither exceptionally long nor very strong, it seems that the forces that might have limited hiring after the 1990–91 and 2001 recessions are much less likely to have a large and persistent effect during this recovery. However, the strength in productivity growth in the second half of 2009 that led to the deviation from Okun’s law depicted in figure 3 may suggest that these forces are still present. On the downside, some firms have considerable unused labor capacity in the form of part-time workers. As of December 2009, part-time workers who would prefer to work full-time made up 6.7 percent of total employment. Daly, Hobijn, and Kwok (2009b), among others, have argued that the pace of hiring relative to output growth during the recovery could be slowed by firms first increasing the hours of those already employed. Finally, there are reasons to suspect that labor market changes over the last two decades will render any sharp reversal in employment less likely. For example, firms’ use of temporary layoffs has declined, and with it the possibility of increasing employment at low cost.27 In addition, the sharp recovery following the 1980s recession may have been aided by the reversal of the disinflationary monetary policy that instigated the recession in the first place, a feature the 2007 recession does not share.
III.B. Match Efficiency and the Beveridge Curve An important concern for the strength of the recovery is that even if firms create new jobs, it may be harder than in the past to match workers with appropriate job openings. Figures 12 and 13 reveal the main reason for this concern.28 Figure 12 illustrates, for the period 1951–2009, the rela27. See Groshen and Potter (2003) for a detailed discussion. 28. Figures 12 and 13 are updated versions of figures 4 and 6 in Shimer (2005). For expositional purposes we plot monthly rather than quarterly data. To account for this change in frequency, we use a value of 2700000 for the smoothing parameter of the HodrickPrescott (HP) filter, which is used to filter the trend in log levels of all variables. This corresponds to the value that Shimer (2005) uses, corrected for the change in frequency using the factor for stock variables derived by Ravn and Uhlig (2002). The vacancy series is based on Barnichon (2010), who builds a vacancy posting index for the years 1951–2009 by combining information from the total print and online help-wanted advertising indexes with the
12178-01a_Elsby_rev4.qxd
8/11/10
12:06 PM
Page 31
MICHAEL W. L. ELSBY, BART HOBIJN, and AYS¸ EGÜL ¸S AHI· N
31
Figure 12. The Beveridge Curve, 1951–2010a Deviation of job vacancies from trend (log points)
20
0
2007 recession Other recessions No recession
Jan-09 Feb-09
–20
Jan-10 Feb-10 Sep-09 Oct-09 Dec-09
–40
Nov-09
–40 –20 0 20 40 Deviation of the unemployment rate from trend (log points) Source: Authors’ calculations using data from BLS and Barnichon (2010). a. Monthly data. Dotted lines are 90 percent confidence intervals around the fitted regression line.
tionship between logarithmic deviations from Hodrick-Prescott-filtered trends of vacancies and of the unemployment rate—the Beveridge curve. The fitted regression line is based on all observations before 2008, and 90 percent confidence intervals are shown. As noted by Shimer (2005), historically there has been a remarkably stable negative association between job openings and the unemployment rate. As the figure shows, during the fall of 2009 the unemployment rate was higher than would be implied by the historical Beveridge curve. Figure 13 investigates the sources of this deviation from past trends. It plots the logarithmic deviations from Hodrick-Prescott-filtered trends of JOLTS data. As discussed in Shimer (2005), the growth of Internet vacancy postings since the mid-1990s, together with newspaper consolidation and the equal opportunities legislation of the 1960s, makes it hard to compare the level of vacancies over time. Shimer uses a low-frequency HP filter to remove these trends. In addition, the series we use from Barnichon (2010) are robust to a range of possible higher-frequency paths for the diffusion of Internet vacancy postings. The cyclical component of the vacancy series that we use moves consistently with economic activity over the business cycle.
12178-01a_Elsby_rev4.qxd
8/11/10
12:06 PM
32
Page 32
Brookings Papers on Economic Activity, Spring 2010
Figure 13. The Matching Function, 1951–2010 a Deviation of the unemployment outflow rate from trend (log points) 2007 recession Other recessions No recession
50 40 30 20 10 0 –10 –20
Dec-09
–30 –40 –50
Jan-09 Nov-09 Oct-09 Jul-09
Jan-10 Sep-09 Feb-10
Feb-09
0 –80 –60 –40 –20 20 40 60 Deviation of the vacancy-unemployment ratio from trend (log points) Source: Authors’ calculations using data from BLS and Barnichon (2010). a. Monthly data. Dotted lines are 90 percent confidence intervals around the fitted regression line.
the outflow rate from unemployment ft, and of the ratio of the number of vacancies to the number of unemployed, a measure of labor market tightness. Shimer (2005) refers to the remarkably stable positive relationship between these measures as the “matching function.” The figure reveals that the recent divergence from the Beveridge curve can be traced to the outflow rate being substantially lower than would be suggested by the matching function relationship observed over much of the postwar period. The substantial decline in the outflow rate witnessed in the latter part of 2009 (figure 6) therefore represents a significant outlier in the context of the historical matching function. The recent breakdown of the Beveridge curve and matching function relationships shown in figures 12 and 13 is evocative of the similar breakdown in match efficiency during the period of high European unemployment in the 1980s and 1990s (see, for example, figure 11 in Layard, Nickell, and Jackman 1991). This raises the concern that the U.S. economy may become plagued by the same persistently high unemployment
12178-01a_Elsby_rev4.qxd
8/11/10
12:06 PM
Page 33
MICHAEL W. L. ELSBY, BART HOBIJN, and AYS¸ EGÜL ¸S AHI· N
33
rates that Europe experienced—the so-called hysteresis effect. In practice, hysteresis can arise through a number of channels. We highlight a few of these possibilities here and attempt to gauge their relevance in the current downturn. MISMATCH BETWEEN WORKERS AND JOBS. One potential reason for a persistent reduction in match efficiency is a mismatch between the skills of workers and the skill requirements of job openings. For example, Erica Groshen and Simon Potter (2003) have argued that the jobless recoveries after the 1990–91 and 2001 recessions were in large part due to structural reallocation of workers across sectors.29 They claim that this reallocation led to a mismatch in the skill mix that resulted in a slower adjustment of the labor market than in previous recessions. More recently, Edmund Phelps (2008) has reiterated this concern with respect to construction and finance workers in the 2007 recession. This reallocation argument suggests that workers formerly employed in sectors in structural decline will have a harder time finding new jobs than other workers. That is, it implies a divergence in outflow rates from unemployment between these two groups of workers. Figure 14 addresses this question by showing unemployment outflow hazard rates conditional on the industry in which a worker was employed at the start of the unemployment spell. If anything, these outflow rates have converged rather than diverged as the structural reallocation argument implies.30 Besides a mismatch in skills, an additional concern is the potential emergence of geographical disparities in the location of workers and of job openings. This issue came into focus in the 2007 recession amid concerns that, given the decline in home prices that accompanied the recession, job applicants are more reluctant to apply for and accept jobs that are not within commuting distance and would require them to sell their home. Fernando Ferreira, Joseph Gyourko, and Joseph Tracy (2008), using data from the American Housing Survey for 1985–2005, find that homeowners with
29. Related to this argument, Aaronson, Rissman, and Sullivan (2004) point out that the need to reallocate labor across sectors in the 1990–91 and 2001 recessions, which were accompanied by jobless recoveries, seemed no greater than in earlier ones. Valletta and Cleary (2009) reach the same conclusion for the 2007 recession. 30. Although this finding is suggestive, it need not imply that skill mismatch is not an issue in the 2007 recession. For example, it may be the case that skill mismatch exists but occurs within industry classifications. In that case, disaggregation by industry would be too broad to detect an increase in skill mismatch. However, estimation of further disaggregated unemployment flows is limited by the increased sampling variance that would accompany additional splitting of the CPS sample.
12178-01a_Elsby_rev4.qxd
8/11/10
12:06 PM
34
Page 34
Brookings Papers on Economic Activity, Spring 2010
Figure 14. Unemployment Outflow Rates in Selected Industries Outflow hazard rate (log scale) 1.00
Construction 0.50 Total
Information
Durable goods
0.25 Financial
0.13
2000
2001
2002
2003
2004
2005
2006
2007
2008
2009
2010
Source: Authors’ calculations using BLS data. a. Twelve-month moving averages of non-seasonally adjusted data. Shading indicates recessions.
negative equity are less likely than other homeowners to move.31 Their results cannot be easily extrapolated to the 2007 recession but still point to a potentially important negative effect of housing-related problems on labor market recovery, since geographic mobility is an important part of adjustment to shocks in the U.S. labor market, as emphasized by Blanchard and Lawrence Katz (1992).32 SCLEROSIS AND DURATION DEPENDENCE. Associated with the record rise in the unemployment rate in the 2007 recession has been a surge in longterm unemployment. The fraction of the labor force unemployed for more than 6 months has increased by a staggering 3.5 percentage points to a postwar high of 4 percent, 1.5 percentage points higher than the previous 31. Some commentators on the 2007 recession have pointed to recent data showing that the rate of domestic migration in the United States has reached a postwar low. However, it is difficult to discern how much of this decline is associated with the recession; rates of internal migration have been falling as a secular phenomenon since the mid-1980s (see, for example, Frey 2009). 32. This implication of Blanchard and Katz (1992) has been the source of some dispute, however. See, for example, Rowthorn and Glyn (2006).
12178-01a_Elsby_rev4.qxd
8/11/10
12:06 PM
Page 35
MICHAEL W. L. ELSBY, BART HOBIJN, and AYS¸ EGÜL ¸S AHI· N
35
high in 1983. Likewise, average unemployment duration has risen to a historic high of more than 30 weeks—the mirror image of the historic low in the unemployment outflow rate noted in section II. Here we explore the effects of these depressed unemployment flows on the likely path of the recovery, what Samuel Bentolila and Giuseppe Bertola (1990) and Blanchard (2000) have referred to as “sclerosis” in the European context.33 A first potential source of sclerosis relates to the effect of reductions in unemployment outflow rates on the speed of adjustment of the unemployment rate. This point can be clarified in terms of equation 4: reductions in the pace of worker reallocation, st + ft, lead to reductions in the responsiveness of unemployment to changes in flow steady-state unemployment, u*t = st /(st + ft). This matters for the recovery of unemployment in the wake of the 2007 recession: a by-product of the historically low outflow rate reached during this recession is that the rate of convergence of unemployment to its flow steady state, λt in equation 4, has also arrived at a postwar low. Thus, even if firms start to hire again, the outflow rate rebounds, and flow steady-state unemployment recovers, the actual unemployment rate may exhibit a delayed reaction. Quantitatively, however, we find that these effects are likely to be small. Although the recent trough in the monthly outflow rate of 24 percent is a record low by historical U.S. standards, it remains very high in comparison with rates in Europe during the 1980s, which fell below 8 percent in many European economies.34 To put this in perspective, the half-life of a deviation of unemployment from flow steady state, which stood at a little over 1 month before the current downturn in the United States, has risen to just under 3 months in recent U.S. data but is not even close to the 9 months to a year experienced in Europe in the 1980s and early 1990s.35 A second source of sclerosis is the persistence in the decline of the outflow rate itself. Previous literature has identified the duration composition of unemployment as a key potential driving force for such persistence (Blanchard 2000). Specifically, a pervasive feature of U.S. unemployment flows 33. We use the term “sclerosis” in the sense of Blanchard (2000, p. 2): “Flows decrease, individual unemployment duration increases, and so does the proportion of long-term unemployed.” 34. Hobijn and S,ahin (2009, table 1) report average duration distributions of unemployment spells, and Elsby, Hobijn, and S,ahin (2009) document the behavior of inflow and outflow rates over time for a broad number of industrialized countries. Even the unemployment-toemployment transition rate for the United States (currently around 20 percent on a monthly basis) substantially exceeds the outflow rate (the sum of the unemployment-to-employment and unemployment-to-nonparticipation flow rates) in many European countries. 35. These figures are computed from estimates in Elsby, Hobijn, and S,ahin (2009, figure 3).
12178-01a_Elsby_rev4.qxd
8/11/10
12:06 PM
36
Page 36
Brookings Papers on Economic Activity, Spring 2010
is that average rates of outflow from unemployment decline as the duration of unemployment spells rises—so-called negative duration dependence—a point noted first by Hyman Kaitz (1970) and more recently by Shimer (2008).36 Several explanations have been proposed for such an outcome, including depreciation of the skills of the unemployed (Pissarides 1992, Ljungqvist and Sargent 1998), employers’ ranking of job applicants by the duration of their unemployment spell (Blanchard and Diamond 1994), and statistical discrimination by employers against the long-term unemployed (Lockwood 1991). Here we highlight some potential reasons why such duration dependence can matter for labor market conditions over the cycle. Noting that the aggregate outflow probability Ft can be expressed as a share-weighted sum of the outflow probabilities faced by each duration group d, Ft = Σd ωdt Fdt, it follows that changes in the aggregate outflow probability over time can be decomposed according to (10)
ΔFt =
∑ (ω d
dt
Δ Fdt + Δω dt Fdt −1 ).
Equation 10 summarizes two potential concerns about the role of duration dependence in the 2007 recession. First, given the surge in long-term unemployment, it is tempting to hypothesize that workers with longer unemployment spells have increasingly become disenfranchised from the labor market, leading to a disproportionate decline in their outflow rates. Such an effect would be captured by the first term in parentheses in equation 10. Figure 15 addresses this question by presenting time series for a range of outflow rates for workers with different unemployment durations. Specifically, we use longitudinally linked monthly CPS microdata from 1976 onward to compute the probability that a worker unemployed for a given duration exits unemployment within a month. Figure 15 plots the associated hazards for durations of less than 1, 1 to 3, 3 to 6, and 6 or more months. Consistent with the literature on negative duration dependence in unemployment exit rates, the hazard for exiting unemployment declines as duration rises. More important for the hypothesis under discussion, however, there is no evidence that exit rates have fallen disproportionately among the high-duration unemployed in the last five recessions. Rather,
36. As noted by Kaitz (1970), this phenomenon may take the form of “spurious” duration dependence that arises from dynamic selection (Salant 1977), or of “true” duration dependence whereby the accumulation of unemployment duration has a causal effect on outflow rates.
12178-01a_Elsby_rev4.qxd
8/11/10
12:06 PM
Page 37
MICHAEL W. L. ELSBY, BART HOBIJN, and AYS¸ EGÜL ¸S AHI· N
37
Figure 15. Unemployment Outflow Probabilities by Duration of Unemployment, 1976–2009 a Percent of unemployed
60
Less than 1 month
50 1–3 months 40 30 3–6 months
More than 6 months
20 10
1980
1985
1990
1995
2000
2005
Source: Authors’ calculations using CPS data. a. Quarterly averages of monthly data. Shading indicates recessions.
just as we showed in section II.B on unemployment flows by group, the cyclicality of outflow rates displays an extraordinary regularity across duration groups. In sum, there appears to be little evidence that elevated rates of joblessness are a symptom of diminished employment opportunities for the long-term unemployed in the 2007 or any other recession.37 However, equation 10 also reveals that duration dependence can affect the cyclicality of the aggregate outflow rate through changes in the duration structure of unemployment, Δωdt. Formally, a simple description of the stock of unemployed workers of duration d over time t is (11)
udt +1 = (1 − Fd −1t ) ud −1t ,
37. Interestingly, this conclusion mirrors the results of Machin and Manning’s (1999, p. 3086) detailed analysis of the long-term unemployment problem in Europe: “While the longterm unemployed do leave unemployment at a slower rate than the shortterm unemployed, this has always been the case and their relative outflow rate has not fallen over time.”
12178-01a_Elsby_rev4.qxd
8/11/10
12:06 PM
38
Page 38
Brookings Papers on Economic Activity, Spring 2010
Figure 16. Simulated Unemployment Outflow Rates, 2010–11a Percent Less than 1 month
50 45 40
Aggregate, counterfactual 2010–11 recovery
Aggregate, indexed to 1983–84 recovery
35 1–3 months 30 3–6 months 25 More than 6 months 20 2010
2011
Source: Authors’ calculations. a. Monthly data. The simulation assumes that outflow rates for each duration group recover at the same rate as in the 1983–84 recovery. For purposes of comparison, the rebound in the aggregate outflow rate in that period is plotted.
with initial condition u0t given by the unemployment inflow derived in section II. It follows that the unemployment share of duration group d is given by (12)
ω dt +1 = (1 − Fd −1t ) ( ut ut +1 ) ω d −1t .
Equation 12 has significant implications for the path of the outflow rate during the recovery. It reveals that the unemployment shares of the highduration unemployed are persistent, and in particular that they depend on the outflow rates faced by the low-duration unemployed that prevailed in the past. Intuitively, even if outflow rates have moved uniformly across duration groups during the 2007 recession, the historic decline in outflow rates as a whole can result in a persistent residue of long-term unemployed workers who exit unemployment slowly, depressing aggregate outflow rates in the future. To illustrate the potential importance of this mechanism, figure 16 simulates the future path of the aggregate outflow rate in the wake of the 2007
12178-01a_Elsby_rev4.qxd
8/11/10
12:06 PM
Page 39
MICHAEL W. L. ELSBY, BART HOBIJN, and AYS¸ EGÜL ¸S AHI· N
39
recession, assuming that outflow rates for each duration group, as well as the aggregate inflow rate, rebound in proportion to what was witnessed in the last recovery from a deep recession, that of 1983–84. For comparison, figure 16 also plots an alternative path for the aggregate outflow rate, indexed to the actual recovery observed in 1983–84. Figure 16 suggests that the accumulation of long-term-unemployed workers in the 2007 recession can indeed have quantitatively important effects on the rebound in the outflow rate during the recovery. Whereas the aggregate outflow rate rebounded by around 30 percent in the 1983–84 recovery, the simulated path for the upcoming recovery augurs a more lackluster 15 percent. The difference between these two paths is largely due to the low outflow rates prevailing at the end of 2009. Hence, even if these rates were to rebound at the same growth rate as in 1983, they would remain at a lower level than in 1983, leading to a higher average duration of unemployment, even in the long run. Although this is definitely a cause for concern, it is unlikely that this mechanism will lead to the degree of persistence in the outflow rate that marked the hysteresis seen in European unemployment in the 1980s and 1990s. The simple reason is that the long-term unemployed in the United States flow out of unemployment at a rate that is four times higher than the aggregate outflow rates in continental Europe reported in Elsby, Hobijn, and S, ahin (2009). THE ROLE OF EMERGENCY UNEMPLOYMENT COMPENSATION. One particularly salient reason for a temporary decline in match efficiency relates to the temporary extension of federal Emergency Unemployment Compensation (EUC) that began in June 2008. In addition to the regular 26 weeks of unemployment insurance (UI), workers may be eligible for 53 additional weeks of EUC as long as Congress continues to extend it.38 Conventional economic theory suggests that this lengthening of the expected duration of unemployment benefits will place downward pressure on the unemployment outflow rate seen in figure 13, as those searching for a job become more selective about which job offers they accept. Existing research on the effects of UI benefits suggests a strong positive relationship between their maximum duration and the average unemployment
38. EUC is divided into four tiers (20 weeks, then 14, then 13, and finally another 6 weeks); recipients must reapply when each tier expires. In addition to these 53 extra weeks, most states offer extended benefits of up to 20 weeks. The number claiming these benefits has been relatively small.
12178-01a_Elsby_rev4.qxd
40
8/11/10
12:07 PM
Page 40
Brookings Papers on Economic Activity, Spring 2010
spell. Estimates suggest that a 1-week increase in potential benefit duration is associated with an increase in the average duration of the unemployment spells of UI recipients of around 0.08 to 0.20 week (see Moffitt 1985, Katz and Meyer 1990, Meyer 1990, Card and Levine 2000, Krueger and Meyer 2002). According to these estimates, then, a 53-week extension in potential benefit duration would be associated with an average 4.2- to 10.6-week increase in unemployment duration among UI recipients.39 Since the fraction of unemployed workers claiming some form of UI benefits has averaged 50 percent in the 2007 recession, this suggests something like a 2.1- to 5.3-week increase in overall unemployment duration. Over the course of the 2007 recession, average unemployment duration surged from 16.5 weeks to 30.2 weeks, a 13.7-week increase. This back-of-the-envelope calculation therefore suggests that EUC can account for as much as 15 to 40 percent of the rise in aggregate unemployment duration. This is a potentially substantial effect, which corresponds to between 0.7 and 1.8 percentage points of the 5.5-percentage-point rise in the unemployment rate. There are reasons to believe, however, that the true effect of extended UI benefits on unemployment duration is likely to be at the lower end of these estimates. Many of the larger estimates of the effect are based on data from the 1970s and 1980s, when temporarily laid-off workers, who are more responsive to the generosity of UI, made up a larger fraction of unemployment. In addition, many of the larger estimates in the literature are based on empirical strategies that identify the effect of UI by exploiting differences in benefit schedules across states and time. As Card and Levine (2000) point out, however, many states extend UI benefits as a response to poor job-finding prospects in recessions, so that this approach may overstate the true disincentive effect of UI. Indeed, Card and Levine’s estimates based on an exogenous policy change lie at the low end of the range of effects, suggesting a more modest impact of EUC. NOT ALL VACANCIES ARE ASSOCIATED WITH JOB CREATION. A final reason for the observed decline in match efficiency could be that the measured stock of vacancies overstates the true number of job openings in the economy. Evidence from microdata on vacancies presented by Steven Davis, Jason Faberman, and John Haltiwanger (2009, figure 5) suggests that establishments whose employment is not growing nevertheless post vacancies. They estimate that these firms have a vacancy rate of about 2 percent of 39. This calculation assumes that, upon entering unemployment, all unemployed workers anticipate that benefit duration will be extended by 53 weeks. In that sense it is an upper bound on the response.
12178-01a_Elsby_rev4.qxd
8/11/10
12:07 PM
Page 41
MICHAEL W. L. ELSBY, BART HOBIJN, and AYS¸ EGÜL ¸S AHI· N
41
employment. Interestingly, this is about equal to the aggregate vacancy rate observed during the second half of 2009. This suggests that a substantial part of the vacancies reported in the latter half of 2009 may be associated not with job creation, but rather with a minimum level of vacancy postings that exists regardless of the level of net job growth. Taken together, our analysis of the decline in match efficiency observed in the latter stages of the 2007 recession points to two potentially important driving forces: the existence of a substantial residue of long-term unemployed workers with relatively weak search effectiveness, and the extension of EUC. Taking these separately, one might imagine that the temporary nature of EUC implies that the labor market will recover as these benefits are withdrawn, whereas the structural nature of the long-term unemployment problem will cause it to endure well into the recovery. However, there are likely to be important interactions between the two factors. A major impetus for the introduction of the EUC program was in fact the rise in long-term unemployment that accompanied the recession. Thus an enduring long-term unemployment problem could mean that the political will to withdraw EUC may take some time to materialize.
IV. Conclusion Our detailed analysis of the adjustment of the labor market in the current downturn reveals it to be the deepest deterioration in labor market outcomes on record in the postwar era. Every indicator of labor market activity suggests that the recession has been unique in both its depth and its duration. Rates of joblessness among all groups in the labor market have reached historic postwar highs. There is little doubt that it is a Great Recession. Nonetheless, our analysis suggests that many of the features of labor market dynamics in the Great Recession through the latter half of 2009 are strikingly similar to those seen in earlier recessions. This is true of the behavior of employment and the labor force participation rate, the use of the intensive versus the extensive margin in the adjustment of labor input, and the differential impact on demographic groups, with young workers, male workers, less educated workers, and workers from ethnic minorities hit harder than others. In terms of the underlying flows, just as in earlier deep recessions, increased joblessness in the current downturn can be traced to both increased rates of inflow into unemployment and increased duration of unemployment spells, with higher inflows relatively more important early on in the downturn. This suggests that the more modest response of unemployment inflows
12178-01a_Elsby_rev4.qxd
42
8/11/10
12:07 PM
Page 42
Brookings Papers on Economic Activity, Spring 2010
in the 1990–91 and 2001 recessions is a feature of mild recessions rather than of modern ones. Further analysis of worker turnover data from the new Job Openings and Labor Turnover Survey provides a unique perspective on the driving forces of job loss in the 2007 recession. Recent literature has emphasized the relatively acyclical behavior of the rate at which workers separate from employers, suggesting that job loss plays only a limited role in driving recessionary unemployment. Combining data from JOLTS and the CPS reveals that increased inflows into unemployment have been driven predominantly by a change in the composition of separations toward layoffs, which are very likely to lead to unemployment, and away from quits, which are very likely to lead to a new job upon separation. Thus, contrary to recent claims, increases in layoffs have played a key role in driving increased unemployment in the recession. Although the labor market response in the early stages of the 2007 recession has resembled that in prior downturns, more recent evidence suggests an important divergence from past trends. Most prominently, rates of exit of unemployed workers from joblessness have slowed to record low levels, drawing into focus the importance of a rebound in outflow rates for the recovery. Recent data point to two key factors. First, the record rise in long-term unemployment associated with the recession is likely to yield a persistent overhang of workers facing long unemployment spells, slowing the recovery. Second, the extension of EUC starting in June 2008 is likely to have led to a modest increase in long-term unemployment in the recession. Despite these unfavorable forces, recent data suggest that the problems facing the U.S. labor market going forward are unlikely to be as severe as the European hysteresis problem of the 1980s. Although the jobless in the United States are exiting unemployment at a historically slow rate, they nonetheless leave unemployment as much as four times faster than their counterparts in continental Europe in the 1980s. Looking ahead, then, a tentative expectation is for a lackluster recovery, but one not nearly as dismal as seen in Europe in the past.40 40. Even after the unemployment rate recovers, labor market disturbances associated with the recession are likely to have important and potentially long-lasting effects on workers. Since Ruhm (1991), and Jacobson, LaLonde, and Sullivan (1993), research has emphasized that the negative effects of displacement go beyond a temporary unemployment spell, as displaced workers often suffer substantial wage losses even after reemployment. Sullivan and von Wachter (2009) argue that job displacement might also have an effect on mortality, with annual death hazards 10 to 15 percent higher for high-seniority displaced male workers
12178-01a_Elsby_rev4.qxd
8/11/10
12:07 PM
Page 43
MICHAEL W. L. ELSBY, BART HOBIJN, and AYS¸ EGÜL ¸S AHI· N
43
ACKNOWLEDGMENTS We are especially grateful to Bruce Fallick, Lawrence Katz, Ryan Michaels, Robert Shimer, Gary Solon, and the editors for particularly detailed comments and suggestions. Thanks also to Mary Daly, Steven Davis, Henry Farber, Robert Hall, John Haltiwanger, Marianna Kudlyak, Simon Potter, and Jonathan Willis for constructive comments. We would like to thank Regis Barnichon for providing us with the Composite Help-Wanted Index data, and Joyce Kwok, Joseph Song, and Theodore Wiles for their outstanding research assistance.
20 years after displacement. The recession might also have negative effects on the careers of new labor market entrants. Oreopoulos, von Wachter, and Heisz (2006) find that students graduating in a recession start work at lower-paying employers, with permanent effects on low-skilled graduates.
12178-01a_Elsby_rev4.qxd
44
8/11/10
12:07 PM
Page 44
Brookings Papers on Economic Activity, Spring 2010
References Aaronson, Daniel, Ellen R. Rissman, and Daniel G. Sullivan. 2004. “Can Sectoral Reallocation Explain the Jobless Recovery?” Federal Reserve Bank of Chicago Economic Perspectives (Second Quarter): 36–49. Abraham, Katharine G., and Robert Shimer. 2001. “Changes in Unemployment Duration and Labor Force Attachment.” In The Roaring Nineties: Can Full Employment Be Sustained? edited by Alan B. Krueger and Robert Solow, pp. 367–420. New York: Russell Sage Foundation and Century Foundation Press. Akerlof, George A., Andrew K. Rose, and Janet L. Yellen. 1988. “Job Switching and Job Satisfaction in the U.S. Labor Market.” BPEA, no. 2: 495–582. Anderson, Patricia M., and Bruce D. Meyer. 1994. “The Extent and Consequences of Job Turnover.” BPEA: Microeconomics 177–236. Baker, Michael. 1992. “Unemployment Duration: Compositional Effects and Cyclical Variability.” American Economic Review 82, no. 1: 313–21. Barnichon, Regis. 2010. “Building a Composite Help-Wanted Index.” Finance and Economics Discussion Series 2009-35. Washington: Board of Governors of the Federal Reserve System. Bentolila, Samuel, and Giuseppe Bertola. 1990. “Firing Costs and Labour Demand: How Bad Is Eurosclerosis?” Review of Economic Studies 57, no. 3: 381–402. Bernanke, Ben S. 1983. “Irreversibility, Uncertainty, and Cyclical Investment.” Quarterly Journal of Economics 98, no. 1: 85–106. Blanchard, Olivier. 2000. “The Economics of Unemployment: Shocks, Institutions, and Interactions.” Lionel Robbins Lectures. London School of Economics. Blanchard, Olivier Jean, and Peter Diamond. 1990. “The Cyclical Behavior of the Gross Flows of U.S. Workers.” BPEA, no. 2: 85–143. ———. 1994. “Ranking, Unemployment Duration, and Wages.” Review of Economic Studies 61(3): 417–34. Blanchard, Olivier Jean, and Lawrence F. Katz. 1992. “Regional Evolutions.” BPEA, no. 1: 1–75. Braun, Helge, Reinout De Bock, and Riccardo DiCecio. 2006. “Aggregate Shocks and Labor Market Fluctuations.” Working Paper no. 2006-004A. Federal Reserve Bank of St. Louis. Card, David, and Phillip B. Levine. 2000. “Extended Benefits and the Duration of UI Spells: Evidence from the New Jersey Extended Benefit Program.” Journal of Public Economics 78, no. 1–2: 107–38. Clark, Kim B., and Lawrence H. Summers. 1981. “Demographic Differences in Cyclical Employment Variation.” Journal of Human Resources 16, no. 1: 61–79. Daly, Mary, Bart Hobijn, and Joyce Kwok. 2009a. “Labor Supply Responses to Changes in Wealth and Credit.” FRBSF Economic Letter 2009-05. Federal Reserve Bank of San Francisco. ———. 2009b. “Jobless Recovery Redux?” FRBSF Economic Letter 2009-18. Federal Reserve Bank of San Francisco.
12178-01a_Elsby_rev4.qxd
8/11/10
12:07 PM
Page 45
MICHAEL W. L. ELSBY, BART HOBIJN, and AYS¸ EGÜL ¸S AHI· N
45
Davis, Steven J. 2006. “Job Loss, Job Finding, and Unemployment in the U.S. Economy over the Past Fifty Years: Comment.” In NBER Macroeconomics Annual 2005, edited by Mark Gertler and Kenneth Rogoff, pp. 139–57. MIT Press. Davis, Steven J., R. Jason Faberman, and John C. Haltiwanger. 2009. “The Establishment-Level Behavior of Vacancies and Hiring.” Working Paper no. WP-09-14. Federal Reserve Bank of Philadelphia Research Department. Elsby, Michael, Bart Hobijn, and Ays,egül S,ahin. 2009. “Unemployment Dynamics in the OECD.” Working Paper no. 14617. Cambridge, Mass.: National Bureau of Economic Research. Elsby, Michael W. L., Ryan Michaels, and Gary Solon. 2009. “The Ins and Outs of Cyclical Unemployment.” American Economic Journal: Macroeconomics 1, no. 1: 84–110. Fallick, Bruce, and Charles A. Fleischman. 2004. “Employer-to-Employer Flows in the U.S. Labor Market: The Complete Picture of Gross Worker Flows.” Finance and Economics Discussion Series 2004-34. Washington: Board of Governors of the Federal Reserve System. Farber, Henry S., and Bruce Western. 2010. “The Distribution of Unemployment, Employment, and Hours in the Current Recession: A Preliminary Look.” Princeton University. Ferreira, Fernando, Joseph Gyourko, and Joseph Tracy. 2008. “Housing Busts and Household Mobility.” Working Paper no. 14310. Cambridge, Mass.: National Bureau of Economic Research. Frey, William H. 2009. “The Great American Migration Slowdown: Regional and Metropolitan Dimensions.” Brookings. Fujita, Shigeru, and Garey Ramey. 2009. “The Cyclicality of Separation and Job Finding Rates.” International Economic Review 50, no. 2: 415–30. Gomme, Paul, Richard Rogerson, Peter Rupert, and Randall Wright. 2004. “The Business Cycle and the Life Cycle.” In NBER Macroeconomics Annual 2004, edited by Mark Gertler and Kenneth Rogoff, pp. 415–461. MIT Press. Gordon, Robert J. 2010. “Okun’s Law, Productivity Innovations, and Conundrums in Business Cycle Dating.” Northwestern University. Groshen, Erica L., and Simon Potter. 2003. “Has Structural Change Contributed to a Jobless Recovery?” Current Issues in Economics and Finance 9, no. 8. Federal Reserve Bank of New York. Hall, Robert E. 2005a. “Employment Efficiency and Sticky Wages: Evidence from Flows in the Labor Market.” Review of Economics and Statistics 87, no. 3: 397–407. ———. 2005b. “Job Loss, Job Finding, and Unemployment in the U.S. Economy over the Past Fifty Years.” In NBER Macroeconomics Annual 2005, edited by Mark Gertler and Kenneth Rogoff, pp. 101–37. MIT Press. ———. 2007. “How Much Do We Understand about the Modern Recession?” BPEA, no. 2: 13–28. Hobijn, Bart, and Ays,egül S,ahin. 2009. “Job-Finding and Separation Rates in the OECD.” Economics Letters 104: 107–11.
12178-01a_Elsby_rev4.qxd
46
8/11/10
12:07 PM
Page 46
Brookings Papers on Economic Activity, Spring 2010
Jacobson, Louis S., Robert J. LaLonde, and Daniel G. Sullivan. 1993. “Earnings Losses of Displaced Workers.” American Economic Review 83, no. 4: 685–709. Kaitz, Hyman B. 1970. “Analyzing the Length of Spells of Unemployment.” Monthly Labor Review 93, no. 11: 11–20. Katz, Lawrence F., and Bruce D. Meyer. 1990. “The Impact of the Potential Duration of Unemployment Benefits on the Duration of Unemployment.” Journal of Public Economics 41: 45–72. Kennan, John. 2006. “Job Loss, Job Finding, and Unemployment in the U.S. Economy over the Past Fifty Years: Comment.” In NBER Macroeconomics Annual 2005, edited by Mark Gertler and Kenneth Rogoff, pp. 159–64. MIT Press. Koenders, Kathryn, and Richard Rogerson. 2005. “Organizational Dynamics over the Business Cycle: A View on Jobless Recoveries.” Federal Reserve Bank of St. Louis Review 87, no. 4: 555–79. Krueger, Alan B., and Bruce D. Meyer. 2002. “Labor Supply Effects of Social Insurance.” In Handbook of Public Economics, vol. 4, edited by Alan J. Auerbach and Martin Feldstein. Amsterdam: North Holland. Kydland, Finn E. 1984. “Labor-Force Heterogeneity and the Business Cycle.” Carnegie-Rochester Conference Series on Public Policy 21: 173–208. Layard, Richard, Stephen Nickell, and Richard Jackman. 1991. Unemployment: Macroeconomic Performance and the Labour Market. Oxford University Press. Ljungqvist, Lars, and Thomas J. Sargent. 1998. “The European Unemployment Dilemma.” Journal of Political Economy 106, no. 3: 514–50. Lockwood, Benjamin. 1991. “Information Externalities in the Labour Market and the Duration of Unemployment.” Review of Economic Studies 58, no. 4: 733–53. Machin, Stephen, and Alan Manning. “The Causes and Consequences of Longterm Unemployment in Europe.” In Handbook of Labor Economics, vol. 3C, edited by Orley C. Ashenfelter and David Card, pp. 3085–3139. Amsterdam: Elsevier. Marston, Stephen T. 1976. “Employment Instability and High Unemployment Rates.” BPEA, no. 1: 169–203. Mattila, J. Peter. 1974. “Job Quitting and Frictional Unemployment.” American Economic Review 64, no. 1: 235–39. Meyer, Bruce D. 1990. “Unemployment Insurance and Unemployment Spells.” Econometrica 58, no. 4: 757–82. Mincer, Jacob. 1991. “Education and Unemployment.” Working Paper no. 3838. Cambridge, Mass.: National Bureau of Economic Research. Moffitt, Robert. 1985. “Unemployment Insurance and the Distribution of Unemployment Spells.” Journal of Econometrics 28, no. 1: 85–101. Mulligan, Casey. 2009. “What Caused the Recession of 2008? Hints from Labor Productivity.” Working Paper no. 14729. Cambridge, Mass.: National Bureau of Economic Research. ———. 2010. “Aggregate Implications of Labor Market Distortions: The Recession of 2008–9 and Beyond.” Working Paper no. 15681. Cambridge, Mass.: National Bureau of Economic Research.
12178-01a_Elsby_rev4.qxd
8/11/10
12:07 PM
Page 47
MICHAEL W. L. ELSBY, BART HOBIJN, and AYS¸ EGÜL ¸S AHI· N
47
Nagypál, Éva. 2008. “Worker Reallocation over the Business Cycle: The Importance of Employer-to-Employer Transitions.” Northwestern University. Okun, Arthur M. 1962. “Potential GNP: Its Measurement and Significance.” In Proceedings of the Business and Economics Statistics Section of the American Statistical Association, pp. 98–104. Alexandria, Va. Oreopoulos, Philip, Till von Wachter, and Andrew Heisz. 2006. “The Short- and Long-Term Career Effects of Graduating in a Recession: Hysteresis and Heterogeneity in the Market for College Graduates.” Working Paper no. 12159. Cambridge, Mass.: National Bureau of Economic Research. Perry, George L. 1972. “Unemployment Flows in the U.S. Labor Market.” BPEA, no, 2: 245–78. Phelps, Edmund S. 2008. “U.S. Monetary Policy and the Prospective Structural Slump.” Speech at the Seventh Annual BIS Conference on Monetary Policy, Lucerne, Switzerland, June 26–27. Pissarides, Christopher A. 1992. “Loss of Skill during Unemployment and the Persistence of Employment Shocks.” Quarterly Journal of Economics 107, no. 4: 1371–91. Polivka, Anne E., and Stephen M. Miller. 1998. “The CPS after the Redesign: Refocusing the Economic Lens.” In Labor Statistics Measurement Issues, edited by John Haltiwanger, Marilyn E. Manser, and Robert Topel, pp. 249–86. University of Chicago Press. Poterba, James M., and Lawrence H. Summers. 1984. “Response Variation in the CPS: Caveats for the Unemployment Analyst.” Monthly Labor Review (March): 37–43. Ravn, Morten O., and Harald Uhlig. 2002. “On Adjusting the Hodrick-Prescott Filter for the Frequency of Observations.” Review of Economics and Statistics 84, no. 2: 371–76. Rowthorn, Robert, and Andrew J. Glyn. 2006. “Convergence and Stability in U.S. Employment Rates.” Contributions to Macroeconomics 6, no. 1: Article 4. Ruhm, Christopher J. 1991. “Are Workers Permanently Scarred by Job Displacements?” American Economic Review 81, no. 1: 319–24. S,ahin, Ays,egül, Joseph Song, and Bart Hobijn. 2010. “The Unemployment Gender Gap during the 2007 Recession.” Current Issues in Economics and Finance 16, no. 2. Federal Reserve Bank of New York. Salant, Stephen W. 1977. “Search Theory and Duration Data: A Theory of Sorts.” Quarterly Journal of Economics 91, no. 1: 39–57. Shimer, Robert. 1998. “Why Is the U.S. Unemployment Rate So Much Lower?” In NBER Macroeconomics Annual, vol. 13, edited by Ben S. Bernanke and Julio J. Rotemberg, pp. 11–61. MIT Press. ———. 2001. “The Impact of Young Workers on the Aggregate Labor Market.” Quarterly Journal of Economics 116, no. 3: 969–1007. ———. 2005. “The Cyclical Behavior of Equilibrium Unemployment and Vacancies.” American Economic Review 95, no. 1: 25–49. ———. 2007 “Reassessing the Ins and Outs of Unemployment.” Working Paper no. 13421. Cambridge, Mass.: National Bureau of Economic Research.
12178-01a_Elsby_rev4.qxd
48
8/11/10
12:07 PM
Page 48
Brookings Papers on Economic Activity, Spring 2010
———. 2008. “The Probability of Finding a Job.” American Economic Review 98, no. 2: 268–73. Slichter, Sumner H. 1919. The Turnover of Factory Labor. New York: Appleton. Solon, Gary, Robert Barsky, and Jonathan A. Parker. 1994. “Measuring the Cyclicality of Real Wages: How Important is Composition Bias?” Quarterly Journal of Economics 109, no. 1: 1–25. Sullivan, Daniel, and Till von Wachter. 2009. “Job Displacement and Mortality: An Analysis Using Administrative Data.” Quarterly Journal of Economics 124, no. 3: 1265–1306. Valletta, Rob, and Aisling Cleary. 2008. “Sectoral Reallocation and Unemployment.” FRBSF Economic Letter 2008-32. Federal Reserve Bank of San Francisco. Van Rens, Thijs. 2004. “Organizational Capital and Employment Fluctuations.” Economics Working Paper 944. Universitat Pompeu Fabra, Barcelona. Willems, Tim, and Sweder van Wijnbergen. 2010. “Imperfect Information, Lagged Labor Adjustment and the Great Moderation.” Discussion Paper 09-063/2. Tinbergen Institute. Woytinsky, W. S. 1942. Three Aspects of Labor Dynamics. Washington: Social Science Research Council. Yashiv, Eran. 2008. “U.S. Labor Market Dynamics Revisited.” Scandinavian Journal of Economics 109, no. 4: 779–806.
12178-01b_Elsby comments_rev1.qxd
8/11/10
12:07 PM
Page 49
Comments and Discussion COMMENT BY
LAWRENCE F. KATZ Michael Elsby, Bart Hobijn, and Ays¸egül S¸ahin have produced a superb descriptive empirical analysis of U.S. labor market stocks (unemployment, employment, and hours of work) and flows (into and out of unemployment) during the 2007 recession. This recession has generated particularly trying times for U.S. workers and their families and clearly merits being denoted as the Great Recession. The authors carefully document that the 2007 recession has been the most severe labor market downturn since World War II as measured by the increase in the unemployment rate, the peak age-adjusted level of the unemployment rate, the rise and level of unemployment durations, and the decline in employment and the employment-population ratio. And they convincingly show that labor market adjustment in this recession has been qualitatively similar to that in past deep downturns along three key dimensions: the demographic composition of the rise in unemployment, with larger increases for males, the less educated, and the young; the split of the contraction in labor input into declines in bodies employed (70 percent) and in hours per worker (30 percent); and the combination of an initial increase in unemployment driven by a sharp rise in unemployment inflows from layoffs followed by continuing increases in unemployment from a large decline in unemployment outflow rates. The authors also find that the deterioration in labor market conditions from late 2007 to early 2009 followed the historical cyclical negative relationship between job openings (vacancies) and unemployment (that is, moving down the Beveridge curve with rising unemployment and falling vacancies). In other words, rising unemployment through the first quarter of 2009 looked like a very severe but normal cyclical phenomenon. But they show that the unemployment rate continued rising in 2009 after the job openings rate stabilized, so that the unemployment rate in late 2009 49
12178-01b_Elsby comments_rev1.qxd
50
8/11/10
12:07 PM
Page 50
Brookings Papers on Economic Activity, Spring 2010
and early 2010 was much higher than would be implied by the historical Beveridge curve. The authors complement this finding with evidence of a downward shift in the job matching function and of deviations from Okun’s law (higher unemployment than justified by the GDP gap) starting in the second quarter of 2009 and continuing into early 2010. These patterns suggest the emergence of structural unemployment problems: mismatches between unemployed workers and potential new jobs and/or the exacerbation of the longer-term structural problems associated with trends of rising wage inequality and declining employment opportunities in traditional middle-class jobs (Goldin and Katz 2007). I find little to disagree with in the paper’s excellent empirical analysis and discussion. I do have some concerns about drawing conclusions about the nature of labor market adjustments using data on labor market quantities alone and not using any information on labor market prices (wages). Robert Shimer flags this issue in his comment, and Jordi Galí (2010) examines the U.S. wage Phillips curve and aggregate wage behavior through 2009Q3. In the remainder of my comment I will briefly discuss two issues. The first is the possible sources of the potential emerging structural unemployment problems suggested by the outward shift in the Beveridge curve since early 2009; the second is the likely longer-term human costs of the sharp rise of unemployment in the Great Recession. Elsby, Hobijn, and S¸ahin argue that the substantial extensions of the potential duration of unemployment benefits (up to 99 weeks) in the current downturn could be contributing to the increased duration of unemployment and the outward shift of the Beveridge curve. They emphasize the traditional disincentive effects on job search effort from unemployment insurance (UI). Shimer in his comment posits that an increase in the duration and availability of UI benefits reduces the pressure on real wages from the unemployed and thereby slows labor market adjustment in a downturn. But the most compelling micro research using discrete policy changes or sharp regression discontinuity strategies suggests only modest impacts of UI extensions on search effort and on the duration of unemployment of UI recipients (Card and Levine 2000; Schmieder, von Wachter, and Bender 2009). Furthermore, previous estimates of larger impacts on unemployment duration for the United States (Katz and Meyer 1990) are based on data from the 1970s and early 1980s, in which much of the responsiveness comes from firms and industries using temporary layoffs and from the sensitivity of recall dates to UI benefits. This layoff-recall process is much less important today than it was in the downturns of that era.
12178-01b_Elsby comments_rev1.qxd
8/11/10
COMMENTS and DISCUSSION
12:07 PM
Page 51
51
UI extensions also have important consumption smoothing benefits for the unemployed (Gruber 1997), and much of the impact on job search effort comes from reducing liquidity (credit constraint) problems rather than traditional job search disincentives (Chetty 2008). Traditional microeconomic estimates of the impact of UI on the unemployment durations of UI recipients further tend to overstate the aggregate impact by ignoring the spillover effects of shorter unemployment spells for unemployed workers not receiving UI benefits (Levine 1993). They also ignore the macroeconomic stimulus arising from increased consumption expenditure by UI recipients, which raises both aggregate demand and demand for labor during a deep recession. UI extensions may also improve longer-run employment levels by keeping more of the long-term unemployed attached to the labor market rather than moving onto disability programs. Thus emergency UI extensions are likely to raise contemporaneous measured unemployment by more than they actually reduce employment, since those receiving benefits are more likely than other jobless workers to indicate in labor force surveys that they are searching for work, leading to a shift in the classification of workers from out of the labor force to unemployed. Regional labor market problems and geographic disparities in the location of job seekers and potential job openings may be an underlying source of structural unemployment problems. Relative to workers in other nations, U.S. workers have always been highly mobile, and their moves in pursuit of new opportunities have enhanced U.S. economic dynamism. High rates of geographic labor mobility have allowed the United States to recover more rapidly from adverse economic shocks and to have smaller regional unemployment differences than European nations with less mobile workforces (Blanchard and Katz 1992). But the geographic mobility of U.S. workers has declined over the last two decades and has fallen sharply in the Great Recession since 2007 (Frey 2009). Three factors may account for this change. First, the housing market crisis and large home price declines in many regions may have generated a geographic lock-in effect: if homeowners with negative equity are hesitant to sell their home at a loss, mobility from distressed areas will be reduced (Ferreira, Gyourko, and Tracy 2009). Second, the subprime crisis has created economic distress in precisely those fast-growing areas, such as California, Florida, and Nevada, that have absorbed workers from declining regions in the past, thus further slowing the movement of labor from declining to expanding regions that ordinarily helps drive U.S. job recoveries. Third, lingering credit market problems, especially for potential new start-ups, hinder job creation even in economically vibrant locales, reducing labor mobility to these areas.
12178-01b_Elsby comments_rev1.qxd
52
8/11/10
12:07 PM
Page 52
Brookings Papers on Economic Activity, Spring 2010
The sharp cyclical downturn of the Great Recession comes on the heels of a three-decade increase in U.S. wage inequality and educational wage differentials. The former has been linked to rapid skill-biased technological change associated with computerization and to a slowdown in the growth of average educational attainment (Goldin and Katz 2008). The finance boom of the 1990s to 2007, some aspects of globalization and offshoring, and weakening U.S. labor market institutions have exacerbated these wage inequality trends. Technological changes and increased offshoring opportunities over the last 20 years have contributed to a polarization of the U.S. labor market, with strong growth in high-end, high-skill jobs and in traditionally lower-wage jobs in the in-person service sector, but particularly weak demand for traditional middle-class jobs such as manufacturing production jobs and middle management positions (Autor, Katz, and Kearney 2006, Autor 2010). The typical high-wage jobs of non-college-educated men, as well as many middle-class jobs for those with college training, have been hard hit. The housing market boom and bubble of 2002–06 obscured some of these trends by buoying demand for non-college-educated men in construction. The Great Recession has reinforced the longer-term jobs polarization and wage inequality trends, with huge declines in construction, manufacturing, and middle management employment. These long-term structural labor market problems suggest that substantial mismatches between the skills and aspirations of job losers (especially the long-term unemployed) and the skill requirements and compensation packages of new job openings are likely to emerge as the economy recovers from the Great Recession. Many job losers from sectors such as construction and manufacturing may face difficulties in making the necessary psychological and financial adjustments, as well as in obtaining the training and education required for the new jobs available in the growing (primarily service) sectors. Elsby, Hobijn, and S¸ahin conclude from similar large declines in unemployment outflow rates across aggregate industries since late 2007 (their figure 14) that increased sectoral shifts and mismatch are unlikely to be a driving force behind the apparent outward shift in the Beveridge curve. But skills mismatch is difficult to measure using such broad industry classifications. And Jinzu Chen, Prakash Loungani, and Bharat Trehan (2010) document a huge shock to the dispersion of stock market returns across industries at the start of the Great Recession and find that this stock market– based measure of sectoral shocks is a strong predictor of the path of longduration unemployment rates. Two particularly worrisome signs suggestive of longer-term structural labor market problems and persistent costs of unemployment from this
12178-01b_Elsby comments_rev1.qxd
8/11/10
COMMENTS and DISCUSSION
12:07 PM
Page 53
53
recession are the concentration of the rise in unemployment among permanent job losers and the huge increase in long-term unemployment. Much research demonstrates that permanently displaced workers and the long-term unemployed face particularly difficult labor market adjustments (Jacobson, LaLonde, and Sullivan 2003, Couch and Placzek 2010). Workers displaced from long-term jobs in the early-1980s recession faced large earnings declines upon reemployment and still had 20 percent earnings losses 15 to 20 years after displacement (von Wachter, Song, and Manchester 2009). The health consequences of permanent loss of a longterm job are also severe, with a 50 to 100 percent increase in mortality the year following displacement, 10 to 15 percent increases in mortality rates 20 years after displacement, and an implied loss of life expectancy for a worker aged 40 at displacement of 1 to 1.5 years (Sullivan and von Wachter 2009). The health problems and mortality increases from job loss are strongly positively associated with larger permanent earnings losses. A substantial number of permanent job losers also end up on the disability insurance rolls as they become discouraged in their search for new jobs, and many have multiple health problems (Autor and Duggan 2003). Parental job loss also appears to have adverse impacts on children, including poorer schooling outcomes and worse labor market outcomes as adults (Oreopoulos, Page, and Stevens 2008, Stevens and Schaller 2009). Policies designed to help displaced workers make the transition to new jobs, gain valuable new skills, and reduce their earnings losses may be necessary to try to combat the potential for large and persistent adverse impacts on well-being arising from today’s high level of long-term unemployment. Permanent job losers often are reluctant to accept new job offers below their pre-separation wage, and they often spend a long time searching for a job like their previous one, even when prospects are much brighter in other sectors and for other types of jobs. This leads to a form of long-term “retrospective wait unemployment,” particularly for long-tenure workers displaced from declining sectors. A potential policy to address these issues and supplement unemployment benefits for likely permanent job losers is wage-loss insurance (also called wage insurance), which (at least temporarily) subsidizes earnings upon reemployment when the wage on the new job is less than that on the old job (Babcock and others 2009). Also, although the economic returns to further education and training at community colleges that lead to degrees and certificates are high for dislocated workers (Jacobson, LaLonde, and Sullivan 2005), the existing employment service programs and job training systems created under the Workforce Investment Act are fragmented and difficult for many
12178-01b_Elsby comments_rev1.qxd
54
8/11/10
12:07 PM
Page 54
Brookings Papers on Economic Activity, Spring 2010
workers to navigate. Improvements in reemployment services and access to training and education for permanently dislocated workers could reduce some of the long-term costs of the current downturn. Sector-focused training programs (also known as sectoral employment programs) have emerged over the last 15 years as a particularly promising approach to workforce development. Sectoral employment programs work closely with local employers to create industry-specific programs that prepare and connect unemployed and underskilled workers to employers seeking to fill skilled vacancies, for example in allied health professions, information technology, and skilled manufacturing jobs. These sectoral employment programs, originally initiated by nonprofit, community-based organizations, have developed strong connections to employers and to the broader community. Early evaluations suggest that well-run versions of these programs can be quite successful in placing workers in highquality jobs and in improving hourly and annual earnings (Maguire and others 2009). Finally, the sharp decline in employment opportunities for teenagers and young adults in the Great Recession raises further longer-run worries. Young workers entering the labor market during a deep recession are likely to see reduced earnings for 10 to 15 years thereafter, relative to those graduating from high school or college in more normal times (Oreopoulos, von Wachter, and Heisz 2008, Kahn 2010). The returns to high school and postsecondary training are quite high in the current labor market, suggesting the need for policies to make it easier for young people to stay in school during a severe downturn. There are some hopeful signs and some worrisome signs in the labor market and enrollment data for youth and young adults in the Great Recession. The employment-population ratio for 16- to 24-year-olds declined sharply (by about 8 percentage points) from the fall of 2007 to the fall of 2009. The decline in employment for this age group has resulted in bifurcated responses, with a rise in enrollment rates and a rise in the share both out of school and out of work (the idleness rate). The school enrollment rate among 20- to 24-year-olds increased by 3 percentage points overall and by 5 percentage points for blacks from the fall of 2007 to the fall of 2009. And the college enrollment rate of new high school graduates reached a record level of 70.1 percent in the fall of 2009 (Bureau of Labor Statistics 2010). The idleness rate among teens and young adults has increased most for males (especially black males). A major open question involves the current activities of and longer-run prospects for these idle males. One worry is that criminal involvement may rise in response to
12178-01b_Elsby comments_rev1.qxd
8/11/10
COMMENTS and DISCUSSION
12:07 PM
Page 55
55
poor legitimate labor market opportunities, leading to longer-run scarring effects in the labor market for those who end up with serious criminal records. But at least through the first half of 2009, property and violent crime rates sharply declined during the Great Recession, suggesting that reduced demand for criminal output has outweighed potential increased criminal activity among more idle youth. Trends in the labor market, educational, and criminal activities of young people will be important to monitor going forward, to contribute to our understanding of the ultimate social consequences of the Great Recession. REFERENCES FOR THE KATZ COMMENT
Autor, David. 2010. “The Polarization of Job Opportunities in the U.S. Labor Market: Implications for Employment and Earnings.” Washington: Center for American Progress and the Hamilton Project (April). Autor, David H., and Mark G. Duggan. 2003. “The Rise in the Disability Rolls and the Decline in Unemployment.” Quarterly Journal of Economics 118, no. 1 (February): 157–205. Autor, David H., Lawrence F. Katz, and Melissa S. Kearney. 2006. “The Polarization of the U.S. Labor Market.” American Economic Review 96, no. 2 (May): 189–94. Babcock, Linda, William Congdon, Lawrence F. Katz, and Sendhil Mullainathan. 2009. “Notes on Behavioral Economics and Labor Market Policy.” Harvard University (December). Blanchard, Olivier Jean, and Lawrence F. Katz. 1992. “Regional Evolutions.” BPEA, no. 1: 1–75. Bureau of Labor Statistics. 2010. “College Enrollment Up among 2009 High School Grads.” TED: The Editor’s Desk (April 28). www.bls.gov/opub/ted/ 2010/ted_20100428.htm. Card, David, and Phillip B. Levine. 2000. “Extended Benefits and the Duration of UI Spells: Evidence from the New Jersey Extended Benefit Program.” Journal of Public Economics 78 (October): 107–38. Chen, Jinzhu, Prakash Loungani, and Bharat Trehan. 2010. “Explaining the Duration of Unemployment: Sectoral vs. Aggregate Shocks.” Washington: International Monetary Fund (March). Chetty, Raj. 2008. “Moral Hazard versus Liquidity and Optimal Unemployment Insurance.” Journal of Political Economy 116, no. 2: 173–234. Couch, Kenneth A., and Dana W. Placzek. 2010. “Earnings Losses of Displaced Workers Revisited.” American Economic Review 100, no. 1 (March): 572–89. Ferreira, Fernando, Joseph Gyourko, and Joseph Tracy. 2010. “Housing Busts and Household Mobility.” Journal of Urban Economics (forthcoming). Frey, William H. 2009. “The Great American Migration Slowdown: Regional and Metropolitan Dimensions.” Washington: Metropolitan Policy Program, Brookings Institution (December).
12178-01b_Elsby comments_rev1.qxd
56
8/11/10
12:07 PM
Page 56
Brookings Papers on Economic Activity, Spring 2010
Galí, Jordi. 2010. “The Return of the Wage Phillips Curve.” Working Paper no. 15758. Cambridge, Mass.: National Bureau of Economic Research (February). Goldin, Claudia, and Lawrence F. Katz. 2007. “Long-Run Changes in the Wage Structure: Narrowing, Widening, Polarizing.” BPEA, no. 2: 135–65. ———. 2008. The Race between Education and Technology. Harvard University Press. Gruber, Jonathan. 1997. “The Consumption Smoothing Benefits of Unemployment Insurance.” American Economic Review 87, no. 1 (March): 192–205. Jacobson, Louis S., Robert J. LaLonde, and Daniel G. Sullivan. 1993. “Earnings Losses of Displaced Workers.” American Economic Review 83, no. 4: 685–709. ———. 2005. “Estimating the Returns to Community College Schooling for Displaced Workers.” Journal of Econometrics 125, nos. 1–2: 271–304. Kahn, Lisa B. 2010. “The Long-Term Labour Market Consequences of Graduating from College in a Bad Economy.” Labour Economics 17, no. 2: 303–16. Katz, Lawrence F., and Bruce D. Meyer. 1990. “The Impact of the Potential Duration of Unemployment Benefits on the Duration of Unemployment.” Journal of Public Economics 41: 45–72. Levine, Phillip B. 1993. “Spillover Effects between the Insured and Uninsured Unemployed.” Industrial and Labor Relations Review 47, no. 1 (October): 73–86. Maguire, Sheila, Joshua Freely, Carol Clymer, and Maureen Conway. 2009. “Job Training That Works: Findings from the Sectoral Employment Impact Study.” P/PV In Brief no. 7. Philadelphia, Pa.: Public/Private Ventures (May). Oreopoulos, Philip, Marianne Page, and Ann Huff Stevens. 2008. “The Intergenerational Effects of Worker Displacement.” Journal of Labor Economics 26, no. 3 (July): 455–83. Oreopoulos, Philip, Till von Wachter, and Andrew Heisz. 2008. “The Short- and Long-Term Career Effects of Graduating in a Recession: Hysteresis and Heterogeneity in the Market for College Graduates.” IZA Discussion Paper no. 3578. Bonn, Germany: Institute for the Study of Labor. Schmieder, Johannes, F., Till von Wachter, and Stefan Bender. 2009. “The Effects of Unemployment Insurance on Labor Supply and Search Outcomes: Regression Discontinuity Estimates from Germany.” Columbia University (November). Stevens, Ann Huff, and Jessamyn Schaller. 2009. “Short-Run Effects of Parental Job Loss on Children’s Academic Achievement.” Working Paper no. 15480. Cambridge, Mass.: National Bureau of Economic Research (November). Sullivan, Daniel, and Till von Wachter. 2009. “Job Displacement and Mortality: An Analysis Using Administrative Data.” Quarterly Journal of Economics 124 (August): 1265–1306. Von Wachter, Till, Jae Song, and Joyce Manchester. 2009. “Long-Term Earnings Losses Due to Mass Layoffs in the 1982 Recession: An Analysis Using U.S. Administrative Data from 1974 to 2004.” Columbia University (April).
12178-01b_Elsby comments_rev1.qxd
8/11/10
COMMENTS and DISCUSSION
12:07 PM
Page 57
57
COMMENT BY
ROBERT SHIMER 1 Michael Elsby, Bart Hobijn, and Ays¸egül S¸ahin offer a thorough and convincing description of some key labor market outcomes during the Great Recession. They focus first on the behavior of traditional stock measures, including employment, unemployment, and hours, and show that by any measure, this has been the deepest labor market contraction during the postwar period. They then turn to the flows in and out of employment, which they show are qualitatively similar to those in previous recessions. In particular, the onset of the recession was accompanied by a sharp spike in layoffs, which pushed many workers into unemployment. This process peaked by the end of 2008, so that by the end of 2009, almost all of the increase in unemployment was accounted for by an unprecedented decline in the unemployment outflow rate. Except for some small anomalies in the relationships among unemployment, vacancies, and the unemployment outflow rate in the latter half of 2009, they conclude that the labor market during the Great Recession behaved just as it did during every previous postwar recession, except for the size of the contraction. I think this story is basically right as far as it goes, and so I do not want to spend too much time on the details of their analysis.2 But it also sidesteps one important question: why did the shock that instigated the recession— the financial crisis, the construction contraction, the loss in housing and financial wealth, or whatever it might have been—result in such a big decline in employment and increase in unemployment duration? To answer that, it seems useful to go back to a basic model of labor supply and demand. As I will show, the model fails spectacularly during this recession, but its failure is instructive. The model I will write down should not be controversial. Most modern theories of employment and hours worked, including the real business
1. I am grateful to Christopher Nekarda of the Federal Reserve for providing me with data in spreadsheet form for figure 3 on the number of workers collecting extended benefits and emergency unemployment compensation. 2. One minor comment: Elsby, Hobijn, and S¸ahin argue that “the measured stock of vacancies overstates the true number of job openings in the economy.” This is based on the observation that even during normal times, many firms list vacancies but do not hire. I think this reflects a misunderstanding of what a vacancy is. A firm has a vacancy if it would like to hire but has not yet done so. In fields where good labor is scarce, vacancies may stay unfilled for months. But there is no reason to think that the desire to hire in these fields should have remained constant during the Great Recession. That is, there is no reason to think that there is a floor on the aggregate vacancy rate.
12178-01b_Elsby comments_rev1.qxd
8/11/10
58
12:07 PM
Page 58
Brookings Papers on Economic Activity, Spring 2010
cycle model (Kydland and Prescott 1982) and the “three equation” New Keynesian model that forms the foundation of Michael Woodford’s (2003) analysis, assume that hours worked are determined by the intersection of individuals’ labor supply curves with firms’ labor demand curves. Even job search models effectively assume that wages and hours are determined by labor supply and demand, but that fluctuations in demand are dampened because search frictions act like an adjustment cost (Shimer 2005, 2010; Rogerson and Shimer 2010). I focus here on the simplest specification of preferences and technology. A representative individual has period-t utility defined over consumption ct and hours ht. Suppose in particular that utility is log ct −
γ ε 1+ε ε h 1+ ε t
where γ > 0 measures the disutility of work and ε > 0 is the Frisch labor supply elasticity. The most important piece of this parametric assumption is that income and substitution effects cancel, so there is no long-run trend in hours worked.3 The individual faces a period budget constraint, bt = at + (1 − τ t ) wt ht − ct . She enters a period with some initial financial wealth at, earns a pretax wage wt per hour of work ht, pays a proportional labor tax τt, and consumes ct , leaving her with financial wealth bt, which is then invested in any available assets. I am deliberately vague about the set of available assets; in particular, markets may be complete or incomplete. Combining the firstorder conditions for consumption and hours gives γct h εt = wt (1 − τ t ) , 1
(1)
which equates the marginal rate of substitution between consumption and hours to the after-tax wage. Note that the key assumption is that a worker is free to increase or decrease both her consumption and her labor supply at a fixed wage. I will return to this assumption later.
3. I have discussed elsewhere the importance of this specification of utility for the general results that I present here; see, for example, Shimer (2010) for more details.
12178-01b_Elsby comments_rev1.qxd
8/11/10
12:07 PM
Page 59
59
COMMENTS and DISCUSSION
Similarly, a representative firm has access to a Cobb-Douglas production technology that uses capital k and labor h to produce output. The firm chooses its inputs to maximize its per-period profits, At ktα ht1− α − rt kt − wt ht , where At is total factor productivity, α is the capital share of income, and rt is the rental rate on capital. Letting yt = At kαt h1−α denote total output, the t first-order condition for the choice of labor is (2)
(1 − α )
yt = wt , ht
which equates the marginal product of labor to the wage. This holds as long as the firm is free to vary its labor at a fixed wage. Introducing adjustment costs on capital, for example, also does not affect this conclusion. Eliminate the wage between equations 1 and 2. Note that ct and ht in equation 1 denote consumption and hours per capita. Letting yt and ht in equation 2 similarly denote output and hours per capita, I obtain (3)
(1 − τ ) t
1 − α ⎛ ct ⎞ 1+ε ε = ⎜ ⎟ht . ⎝ yt ⎠ γ
The left-hand side of equation 3 is the proportion of labor income left after taxes, multiplied by the labor share 1 − α and divided by the disutility of work γ. The right-hand side is the product of the consumption-output ratio ct /yt and hours worked ht raised to an exponent (1 + ε)/ε ≥1. The labor market clearing model predicts some co-movement between the consumptionoutput ratio and hours per capita in response to a shock to any variable not in this equation, such as a financial crisis, a collapse in construction, or a loss of housing and financial wealth. To explore whether this relationship is a good description of the data, I use empirical measures of the consumption-output ratio and hours worked in the United States. I measure c as nominal expenditure on nondurable goods and services, and y as nominal GDP.4 Following Simona
4. Chari, Kehoe, and McGrattan (2007) construct a measure of consumption that includes the flow of services from durables. This does not much affect the results.
12178-01b_Elsby comments_rev1.qxd
60
8/11/10
12:31 PM
Page 60
Brookings Papers on Economic Activity, Spring 2010
Figure 1. Log Labor Wedge, 1951–2009a Log points
20 10 0 –10 –20
1955
1965
1975
1985
1995
2005
Source: Author’s calculations. a. The labor wedge is (1 – τt), implicitly defined by equation 3. Shaded bands indicate recessions.
Cociuba, Edward Prescott, and Alexander Ueberfeldt (2009), I measure hours per capita as the number of people at work times average hours per person at work divided by the population over age 16 (all from the Current Population Survey).5 For simplicity’s sake, I fix the labor supply elasticity at ε = 1 but stress that all comparisons between the latest recession and previous ones are unaffected by this choice of elasticity. Finally, I normalize γ = (1 − α)(1 − τt) at t = 2009Q4, the end of the sample. I plot in figure 1 the logarithm of the right-hand side of equation 3. A few patterns stand out. First, labor market clearing implies significant time variation in labor taxes at low frequencies. Arguably this is consistent with the data; for example, Robert Barro and Charles Redlick (2009) find that the average marginal tax rate increased from 1950 until 1981 and then fell modestly through 2006. More pertinent, the theory implies that taxes must have increased during almost every recession, and in particular shows that 1 − τt fell by 19.0 log points during 2008 and 2009. Like many authors before me (see, for example, Parkin 1988; Rotemberg and Woodford 1991, 1999; Hall 1997; Mulligan 2002; and Chari, Kehoe, and McGrattan 2007), I view this prediction of the theory as implausible and instead call these 5. The labor market variables are available from the BLS since June 1976. Data for earlier years can be downloaded from Cociuba’s website (sites.google.com/site/simonacociuba/ research). I seasonally adjust these monthly data using the Census X11 algorithm and then take quarterly averages.
12178-01b_Elsby comments_rev1.qxd
8/11/10
12:07 PM
Page 61
61
COMMENTS and DISCUSSION
Figure 2. Marginal Rate of Substitution between Consumption and Hours Worked and Marginal Product of Labor, 1951–2009a Log points Marginal rate of substitution 15 10 5 0 Marginal product of labor
–5 –10 –15 1955
1965
1975
1985
1995
2005
Source: Author’s calculations. a. Each series has been reduced by a constant 0.47 percent quarterly growth. Shaded bands indicate recessions.
cyclical movements in 1 − τt the “labor wedge,” that is, the part of labor market fluctuations that a labor market clearing model cannot explain. It is worth emphasizing the magnitude of the current increase in the labor wedge. The peak-to-trough decline in 1 − τt exceeded 10 log points in only three previous postwar recessions: it was 10.9 log points from 1952Q4 to 1954Q3, 11.2 from 1956Q3 to 1958Q1, and 10.3 from 1979Q4 to 1981Q4. The decline from 2008Q1 to 2009Q4 is nearly twice as large, 19.0 log points. If macroeconomists were already concerned before the Great Recession with the empirical validity of imposing labor market clearing, the assumption should be untenable today. By breaking equation 3 back down into its components, the marginal rate of substitution (MRS) in equation 1 and the marginal product of labor (MPL) in equation 2, one can get a better understanding of why this theory failed. I measure the real MPL as the ratio of real GDP to total hours and then infer the real MRS as 1 − τt times the MPL.6 Since both the MRS and the MPL have trended upward over time with general growth in the economy, I remove a constant 0.0047 quarterly growth from both lines for visual convenience. The results, presented in figure 2, are stark. The MRS 6. The Bureau of Economic Analysis does not maintain a measure of real consumption of nondurables or of services before 1995, and so I cannot construct this series directly. Using real total consumption gives similar results.
12178-01b_Elsby comments_rev1.qxd
62
8/11/10
12:07 PM
Page 62
Brookings Papers on Economic Activity, Spring 2010
accounts for virtually all of the cyclical movement in the labor wedge.7 Although there are low-frequency movements in the MPL, business cycle fluctuations are very small. If anything, recessions appear to be periods where the MPL falls. The only exception to this pattern occurs in 2009, when the MPL increased by 4.8 log points (3.4 log points after detrending), an outcome that I will return to shortly. These findings, or at least the pattern before 2009, are consistent with an environment where the real wage is fairly rigid and firms are always on their labor demand curve. That is, the path of the MPL simply reflects movements in the real wage. A recession, then, is a time when labor demand falls without an offsetting decline in the real wage, lowering the equilibrium level of hours worked. On the other hand, the real wage typically exceeds the MRS, so workers are not on their labor supply curve. The decline in firms’ demand for labor during recessions makes this problem particularly acute. Recent work on rigid wages in search models, starting with Robert Hall (2005), offers a theoretical framework in which this possibility can be considered.8 The patterns that Elsby, Hobijn, and S¸ahin highlight, including the spike in layoffs early in a recession and the persistent increase in unemployment duration later on, can be understood through the lens of these models. In closing, I want to consider the unprecedented increase in the MPL, reflecting an unprecedented increase in the real wage, from the first to the fourth quarter of 2009.9 One possible explanation is that the economy has been shedding its least productive, lowest-wage workers. Concern about this type of compositional effect is the justification that Elsby, Hobijn, and S¸ahin give for not discussing real wages in their paper (see their footnote 2). But there are some problems with this story. Why don’t these compositional effects show up in earlier recessions, when the MPL typically fell or at least remained constant? Why don’t they show up earlier in the Great Recession, when total hours were declining at a faster rate? Indeed, it is not even clear
7. See Galí, Gertler, and López-Salido (2007) for a similar conclusion with a different interpretation. 8. Rogerson and Shimer (2010) evaluate the role that search frictions play in macroeconomic models and conclude that the possibility that search may lead to rigid wages is one of its most important roles. 9. This may simply reflect measurement error in GDP, which is subject to numerous revisions. The gap between GDP and gross domestic income might give some support to that hypothesis (Nalewaik, this volume). But even if GDP in the fourth quarter of 2009 is subsequently revised down by a couple of percent, the MPL will still have increased sharply during the year.
12178-01b_Elsby comments_rev1.qxd
8/11/10
COMMENTS and DISCUSSION
12:07 PM
Page 63
63
how compositional effects should work at business cycle frequencies. To the extent that wage rigidities force workers out of high-wage jobs into positions for which they are overqualified, the changing composition of jobs artificially inflates the procyclicality of wages and productivity. This suggests a second possible explanation for the behavior of the MPL. In a low-wage environment with nominal wage rigidities, firms may be unable to reduce wages in response to adverse shocks. This leads to layoffs and raises the real wage and the productivity of surviving workers. But Elsby, Hobijn, and S¸ahin show that the pace of layoffs slowed during 2009. An explanation is still needed for why firms hired relatively few workers during 2009, and the link between that finding and nominal wage rigidities is more tenuous. A third possibility is that firms are not hiring because of credit market frictions. But if the assumption is that credit market frictions reduced capital investment, the MPL should have fallen, not increased. So instead the model must be one in which credit market frictions reduce firms’ ability to hire, either because of difficulties in financing payrolls or because hiring entails upfront recruiting and training costs, with deferred benefits. Since capital purchases may be more easily collateralized than payroll expansions, such a model may be empirically plausible. This hypothesis merits more serious exploration when appropriate data are available. A fourth possibility is that various well-intentioned government interventions have kept unemployed workers from putting downward pressure on wages. One example is extensions in the potential duration of unemployment benefits, which Elsby, Hobijn, and S¸ahin discuss. Current law allows workers to collect unemployment benefits for up to 99 weeks in most states, a duration never before experienced in the United States. As I write this in April 2010, extending benefits by another 13 weeks is being debated. As a result of both the policy change and the depth of the recession, 11.5 million workers were collecting benefits in March 2010, 73 percent of all the unemployed. Only once before, in 1975, was the insured unemployment rate higher, as I show in figure 3. This unprecedented extension of benefits dramatically changes the composition of the unemployed population. For example, whereas the uninsured unemployment rate peaked at 5.8 percent in 1983, it never exceeded 3.8 percent during the current recession and was only 2.7 percent in March 2010. It seems unlikely that real wages will fall without more pressure from the unemployed. Viewed through the lens of the MRS and the MPL, the prognosis for a strong labor market recovery without a large preemptive change in labor market policy is poor.
12178-01b_Elsby comments_rev1.qxd
8/11/10
64
12:07 PM
Page 64
Brookings Papers on Economic Activity, Spring 2010
Figure 3. Share of Unemployed Workers Receiving Unemployment Benefits, 1970–2010a Percent
80 60 40 20
1975
1980
1985
1990
1995
2000
2005
Source: U.S. Department of Labor, Unemployment Insurance Weekly Claims Report. a. Shaded bands indicate recessions.
REFERENCES FOR THE SHIMER COMMENT
Barro, Robert J., and Charles J. Redlick. 2009. “Macroeconomic Effects from Government Purchases and Taxes.” Working Paper no. 15369. Cambridge, Mass.: National Bureau of Economic Research. Chari, V. V., Patrick J. Kehoe, and Ellen R. McGrattan. 2007. “Business Cycle Accounting.” Econometrica 75, no. 3: 781–836. Cociuba, Simona E., Edward C. Prescott, and Alexander Ueberfeldt. 2009. “U.S. Hours and Productivity Behavior Using CPS Hours Worked Data: 1947-III to 2009-II.” Federal Reserve Bank of Dallas. Galí, Jordi, Mark Gertler, and J. David López-Salido. 2007. “Markups, Gaps, and the Welfare Costs of Business Fluctuations.” Review of Economics and Statistics 89, no.1: 44–59. Hall, Robert E. 1997. “Macroeconomic Fluctuations and the Allocation of Time.” Journal of Labor Economics part 2, 15, no. 1: S223–50. ———. 2005. “Employment Fluctuations with Equilibrium Wage Stickiness.” American Economic Review 95, no. 1: 50–65. Kydland, Finn E., and Edward C. Prescott. 1982. “Time to Build and Aggregate Fluctuations.” Econometrica 50, no.6: 1345–70. Mulligan, Casey B. 2002. “A Century of Labor-Leisure Distortions.” Working Paper no. 8774. Cambridge, Mass.: National Bureau of Economic Research. Parkin, Michael. 1988. “A Method for Determining whether Parameters in Aggregative Models Are Structural.” Carnegie-Rochester Conference Series on Public Policy 29: 215–52.
12178-01b_Elsby comments_rev1.qxd
8/11/10
COMMENTS and DISCUSSION
12:07 PM
Page 65
65
Rogerson, Richard, and Robert Shimer. Forthcoming. “Search in Macroeconomic Models of the Labor Market.” Handbook of Labor Economics, vol. 4, edited by Orley Ashenfelter and David Card. Amsterdam: North-Holland. Rotemberg, Julio J., and Michael Woodford. 1991. “Markups and the Business Cycle.” NBER Macroeconomics Annual 6: 63–129. ———. 1999. “The Cyclical Behavior of Prices and Costs.” In Handbook of Macroeconomics, vol. 1B, edited by John B. Taylor and Michael Woodford. Amsterdam: Elsevier. Shimer, Robert. 2005. “The Cyclical Behavior of Equilibrium Unemployment and Vacancies.” American Economic Review 95, no. 1: 25–49. ———. 2010. Labor Markets and Business Cycles. Princeton University Press. Woodford, Michael. 2003. Interest and Prices: Foundations of a Theory of Monetary Policy. Princeton University Press.
GENERAL DISCUSSION Robert Hall suggested dropping the framework for analyzing unemployment based on inflows and outflows in favor of a richer environment where separations and hires are as important as entry and exit from unemployment. The “ins-and-outs” model is limited because a first-order feature of the labor market escapes it completely, namely, cyclical variation in the fraction of separations that are followed by unemployment rather than by new jobs or exit from the labor force. In a strong labor market, the biggest outflow is into other jobs, with little or no intervening time out of the labor force or in unemployment. But in a recession, that fraction declines dramatically, creating a wide gap between separations and unemployment that Arthur Okun called the “Perry pothole,” after George Perry described it in a 1972 Brookings Paper. Hall further noted that the present paper emphasizes a distinction between quits and layoffs, whereas models using bargaining theory do not make that distinction. Whether the worker takes the initiative to leave and the separation is called a quit, or the employer takes the initiative and it is called a layoff, is a detail of governance, not an allocational issue, in those models. It remains a possibility that layoffs differ from quits in a meaningful way, but labor market theory has yet to resolve that question. Hall observed that vacancies in the most recent recession had been high relative to the high level of unemployment. The result is what looks like a shift of the Beveridge curve, but it could also be that the dynamics matter. Job creation as measured by vacancies has accelerated recently, but unemployment has not yet declined by the corresponding amount. When the job finding rate was high, unemployment dynamics were largely disregarded, but now that the job finding rate has dropped
12178-01b_Elsby comments_rev1.qxd
66
8/11/10
12:07 PM
Page 66
Brookings Papers on Economic Activity, Spring 2010
to half its normal level, the dynamics matter. Work by Hal Varian using Google Insight shows a dramatic decline recently in the number of people using the search term “unemployment insurance,” which is a good sign. It was possible that vacancies would remain high and that unemployment would decline relatively rapidly, putting the economy back on the historical Beveridge curve. Hall concluded that the present paper strongly supported the idea that there is no important labor market story for where the recent recession came from. There has been a very large, but directionally normal, response in the labor market, and there is little to suggest that a rapid expansion of demand would not quickly restore full employment. Responding to Hall, Robert Gordon pointed out that the share of the total decline in hours that has taken the form of involuntary part-time work in this recession is unprecedented. Hence, any increase in the rate of output growth will likely be met disproportionately by firms moving part-time workers back to full-time work. Because the slack in the economy is thus concentrated in hours rather than bodies, it will prevent growth in real GDP from appreciably decreasing the unemployment rate. Gordon was reminded of his own forthcoming paper on the demise of Okun’s law, which documented a systematic structural shift. Comparing data from different periods roughly before and after the mid-1980s, that paper showed that the labor market has become much more responsive to changes in the output gap than in Okun’s original formulation, in which two-thirds of any such change was matched by changes in aggregate hours and the remaining one-third by changes in productivity. In the last 25 years the productivity response has all but vanished, so that virtually the entire response now comes from hours. What might explain this shift is the sense that workers have become more disposable. A March 18, 2010, article in the Economist, titled “Slash and Earn,” highlights how the cyclical behavior of the European and the U.S. economies differs on this score. Europe’s typical response to a recession involves more traditional labor hoarding, and thus a collapse in productivity but a smaller decline in jobs for a given change in the output gap. This idea of the disposable American worker might be related to the increase in inequality and the decreased bargaining power of workers in the U.S. economy. Olivier Blanchard suggested that although both quits and layoffs reflect the realization that it is no longer efficient for a worker and an employer to stay together, they differ in the source of the shock that leads to separation. Quits come from a shock to the worker, whereas layoffs occur when something happens to the profitability of the firm. Blanchard also proposed that
12178-01b_Elsby comments_rev1.qxd
8/11/10
COMMENTS and DISCUSSION
12:07 PM
Page 67
67
differences in time spent searching for work might explain the outliers in the matching function that the authors had observed, or the fact that there is more unemployment than expected given the current level of vacancies. In depressed markets, some job losers are still counted as unemployed but in fact are no longer searching for work. If the necessary data are available, it might be worth correcting the matching function for this. Steven Davis regarded the evidence presented by Lawrence Katz on the long-term consequences of job loss and displacement as strongly indicating that many workers are in for a difficult time for many years to come. This is an aspect common to severe cyclical downturns to which macroeconomists have paid too little attention. He noted that when one combines the JOLTS data on hires and vacancies with the CPS measure of unemployment, looking through the lens of the simplest Cobb-Douglas matching function with an exponent of around 0.4 on the unemployment rate, things line up beautifully from 2001 to 2007. Hires per vacancy and the transformed unemployment-to-vacancies ratio follow each other closely, consistent with a standard Beveridge curve relationship. The two measures diverged sharply, however, beginning in early 2008; since then there have been far too few hires per vacancy given the unemployment-tovacancies ratio. Looking at the labor market in this way reveals a more pronounced and earlier departure from the normal pattern, again suggesting that something unusual has happened in the labor market during the Great Recession. Justin Wolfers responded to two points in Katz’s comment. The first was his observation that divorce and job loss are highly correlated. Although this is true in the cross section—people who lose their jobs are indeed more likely to get divorced—the behavior of the divorce rate is in fact completely acyclical. Since the start of the Great Recession, the divorce rate has continued to fall right up until the most recent data. Katz’s second point was that over the past year, inflation does not seem to have been trending either upward or downward. That normally suggests that unemployment is near its natural rate, and if that is the case, there is much less reason for optimism about the near-term path of the unemployment rate. Finally, Wolfers noted that Jeremy Nalewaik’s paper made the case that the measure of GDP based on income rather than expenditure gives a much more accurate reading in real time. Since December 2006 the expenditure-based measure has risen by 33⁄4 points more than the incomebased measure. Thus, by the income-based measure, productivity might very well be falling, not growing, and unemployment is about where one would expect from Okun’s law.
12178-01b_Elsby comments_rev1.qxd
68
8/11/10
12:07 PM
Page 68
Brookings Papers on Economic Activity, Spring 2010
Robert Shimer believed that labor productivity growth would decrease in the near term, but he was not convinced that it would turn negative. He was reminded of a comment he had presented on another paper by Elsby, in which he (Shimer) discussed quits and layoffs as quite distinct things. Before 1994, the CPS used to ask unemployed workers every month why they were not working but did not require that the answers be consistent. In fact, among respondents who were unemployed in two consecutive months, about 30 percent of those who reported in the first month that they were job leavers switched the next month and said they had been fired. In contrast, the switch in the other direction was about 5 percent on average. Moreover, the switches were countercyclical. One would expect to see a boost during a recession, especially a deep recession, in the fraction of people who report themselves as having lost their job rather than quit. So, although the distinction between quits and layoffs is meaningful at some level, there is much spurious measurement of it, and a lot of murky ground in between the two concepts. Steven Davis echoed Elsby and Blanchard on the importance of the quits-versus-layoffs distinction. He granted that the distinction is blurry, but hardly more so than that between being unemployed and being out of the labor force, yet that has not led economists to abandon the study of unemployment. Davis agreed with Hall that economic theory lacks a satisfactory micro foundation, other than a labeling story, for separations that are not jointly wealth maximizing. But by the same token, there was once a time when economics lacked a satisfactory theory of frictional unemployment, yet that did not prevent its recognition as an important phenomenon. In some of his own work with Jason Faberman and John Haltiwanger, Davis had found strong relationships among layoffs, quits, and hires. In the cross section, they are closely related to job creation and destruction. In good times many workers quit establishments that are shrinking moderately, perhaps because they anticipate bad times and layoffs coming. Much less of this kind of preemptive quitting occurs in weak labor markets. A related phenomenon is the well-known and quite pronounced cyclical variation in the ratio of quits to layoffs. This suggests not only that firms are suffering different kinds of shocks in booms than in busts, but also that workers perceive that their opportunities elsewhere are more limited during weak labor markets, leading them to wait until the ship sinks before abandoning it. Richard Cooper argued that there is an intrinsic ambiguity, at least in some parts of the labor market, about the distinction between quits and layoffs. For example, some separations that are technically quits occur
12178-01b_Elsby comments_rev1.qxd
8/11/10
COMMENTS and DISCUSSION
12:07 PM
Page 69
69
under circumstances in which the employer has made it clear that the worker’s performance was not satisfactory and that the worker’s long-term prospects at the firm were poor. Gary Burtless pointed out a simple distinction between quits and layoffs that has real economic significance in the United States: workers who quit are not entitled to unemployment benefits, whereas workers who are laid off are. This has clear implications for how individuals prefer to be labeled when they flow into unemployment. Valerie Ramey noted a dramatic increase, particularly in the West, and particularly in the construction sector, in the fraction of the labor force who are recent immigrants. Much anecdotal evidence suggests that when the recession hit, many of these immigrants returned to their home countries. This may indicate a more elastic labor supply response among some of these marginal workers, which could have an impact on the overall statistics for unemployment and labor force participation.