The influence of private and public greenspace on short-‐term health indicators Nicholas Brunsdon
GEOG420 Dissertation 2013 University of Canterbury
Abstract The contribution of contextual factors such as greenspace exposure and accessibility towards individual health has been subject to an increasing amount of research in the recent years. However, significant results elsewhere have not been widely replicated in New Zealand. This study looked at the time spent undertaking physical activity and mental health symptoms of 2,557 individuals through Auckland, New Zealand, relating it to a range of measures of neighbourhood greenspace. Greenspace exposure and accessibility was calculated for each meshblock in Auckland City using a geographic information system (GIS), indicating accessibility to usable greenspace through network distance; the area of all public greenspaces through a Euclidean buffer, and the area of all greenspaces (including private gardens through a Euclidean buffer, created with a new method from impervious surface data. Regression analysis related these area level variables to individual health variables from the New Zealand Health Survey, controlling for a range of demographic factors. Vigorous physical activity was found to be lowest in neighbourhoods with the highest access to usable greenspace, and a significant relationship was found between private greenspace and nervous symptoms, although with a contradictory direction of association. No significant relationship was found between any measures of greenspace and depressive symptoms. A number of opportunities to investigate the contribution of greenspace and bluespace on health are recommended. Understanding how urban environments influence health is important to inform urban planning.
2
Nicholas Brunsdon
Table of Contents Abstract ……………………………………………………………………………………………………………….2 Table of Contents …………………………………………………………………………………………………3 List of Figures ……………………………………………………………………………………………………….4 List of Tables ………………………………………………………………………………………………………..5 1. Introduction .................................................................................................... 6 2. Background ..................................................................................................... 8 2.1 Theoretical framework .................................................................................... 8 2.2 Prior studies ..................................................................................................... 9 2.3 Health and greenspace methodologies ......................................................... 11 2.3.1 Health Methodologies ............................................................................ 11 2.3.2 Greenspace Methodologies .................................................................... 12 3. Research Objectives ...................................................................................... 15 3.1 Research Questions ....................................................................................... 15 4. Methods ........................................................................................................ 16 4.1 Spatial Analysis .............................................................................................. 17 4.1.1 Public greenspaces ................................................................................. 19 4.1.2 Usable greenspaces ................................................................................ 20 4.1.1 Impervious surfaces ................................................................................ 21 4.2 Health analysis ............................................................................................... 23 5. Results .......................................................................................................... 28 6. Discussion ..................................................................................................... 36 6.1 Greenspace Indicators ................................................................................... 36 6.2 Socioeconomic Deprivation ........................................................................... 37 6.3 Physical Activity ............................................................................................. 37 6.4 Mental Health ................................................................................................ 38 6.5 Future Research ............................................................................................. 39 6.6 Theoretical Pathways .................................................................................... 40 7. Conclusion ..................................................................................................... 42 Acknowledgements …………………………………………………………………………………………… 43 References ………………………………………………………………………………………………………… 44 Appendix A ……………………………………………………………………………………………………….. 53
3
List of Figures Figure 1: -‐ Theoretical overview of linkages between greenspace data, greenspace classifications, theoretical linkages and hypothesised health outcomes ........... 16 Figure 2: -‐ Map of study area in relation to Auckland cities, noting the exclusion of North Shore, Albany and Gulf Harbour islands. Inset: New Zealand, with Auckland region indicated. ................................................................................. 17 Figure 3: -‐ Map of illustrative meshblock showing the relationship between the meshblock area, where NZHS respondents are located, and the PWC representing the meshblock. 500m and 2000m buffers are measured as radii from the PWC ..................................................................................................... 18 Figure 4: -‐ Map of illustrative meshblock showing 0-‐500m and 500-‐2000m (doughnut) buffers from the meshblock PWC and how all public greenspace (usable and non-‐usable) within each buffer is identified from which to be calculated as a proportion of the total buffer size. ............................................ 20 Figure 5: -‐ Map of illustrative meshblock showing usable greenspaces and how their accessibility to the meshblock is appraised – by the average travel time via the road network from the meshblock PWC to the nearest five usable greenspaces ............................................................................................................................ 22 Figure 6: -‐ Map of illustrative meshblock showing impervious surfaces (such as roads, buildings and footpaths) within and beyond a 500m buffer of the meshblock. 23
4
Nicholas Brunsdon
List of Tables Table 1: -‐ Summary information for area-‐level variables of respondents .................. 24 Table 2: -‐ Summary information for 2,557 adult respondents to the 2011/12 NZHS within the Auckland study area, representing a population of 810,159. ........... 26 Table 3: -‐ Correlation matrix of area level greenspace and deprivation variables, indicating correlation coefficient (p-‐value). ....................................................... 28 Table 4: -‐ Logistic regression of the relationship between time spent exercising (dependent variable) and individual and area level variables, each considered separately. .......................................................................................................... 29 Table 5: -‐ Logistic regression of the relationship between time spent exercising (dependent variable) and area level usable greenspace access, controlling for age, sex and area deprivation. ............................................................................ 30 Table 6: -‐ Logistic regression of the relationship between mental illness symptoms (dependent variable) and individual and area level variables, each considered separately. .......................................................................................................... 31 Table 7: -‐ Logistic regression of the relationship between mental illness symptoms (dependent variable) and usable greenspace, controlling for prior doctor diagnosis. ............................................................................................................ 32 Table 8: -‐ Logistic regression of the relationship between mental illness symptoms (dependent variable) and public greenspace, controlling for prior doctor diagnosis. ............................................................................................................ 33 Table 9: -‐ Logistic regression of the relationship between mental illness symptoms (dependent variable) and all greenspaces (derived from impervious surfaces), controlling for doctor diagnosis. ......................................................................... 34 Table A1: -‐ Logistic regression of the relationship between prior doctor diagnosis for mental illness (dependent variable) and individual and area level variables, each considered separately. . ...................................................................................... 56
5
1. Introduction During the preceding century our understanding of health has broadened beyond merely the absence of illness to include the salutogenic influence of environments towards health. For highly urbanised populations, scarce areas of greenspace can have an important contribution towards health. The scarcity and uneven distribution of greenspace throughout urban spaces gives rise to analysis of how the distribution of health relates to that of greenspaces. A theoretical framework established through previous empirical work proposes that greenspace exposure influences health through three key avenues – as a therapeutic landscape, in promoting physical activity and as a venue for informal social interactions (Dillen, Vries, Groenewegen, & Spreeuwenberg, 2012). Quantitative research in many other developed nations has provided evidence of a strong positive association between greenspace exposure and accessibility and positive health outcomes (Lachowycz & Jones, 2011); however this relationship has not been replicated widely in studies of the New Zealand context to date (Richardson, Pearce, Mitchell, Day, & Kingham, 2010). Prior research has tended to estimate population exposure by measuring exposure to public greenspace only, without including private gardens (Lachowycz & Jones, 2011), however this study measures greenspace through several different measures. The distance from the population-‐weighted centroid of each census meshblock 1 to the nearest public usable (able to be visited) greenspace is used as a measure of greenspace accessibility. Similarly, the area of all public greenspace (incorporating usable public greenspace) surrounding the meshblock is used as a measure of greenspace exposure. The proportion of impervious surfaces2 in each meshblock is used as a measure of exposure to all forms of greenspace, including private gardens, which have not been quantified in relation to health in prior studies. 1 Meshblocks are the smallest geographic areas that Statistics New Zealand (SNZ) collects data in, and are designed to include approximately 110 individuals (Statistics New Zealand, 2013). 2 Impervious surfaces are artificial surfaces such as buildings, roads, footpaths and car parks 6
Nicholas Brunsdon Quantification of health in existing work tends to use cross sectional data, looking across society at a single point in time; however this ignores migration, and thus the contribution that a previous neighbourhoods may have had on the present health of an individual. This effect is exacerbated by the use of chronic health conditions, such as cardiovascular disease, to measure health as they tend to be strongly influenced by environmental exposures and lifestyle factors over a lifetime (World Health Organization, World Heart Federation, & World Stroke Organization, 2011). Following a quantitative methodology, this research investigated the greenspace-‐ health relationship through two short-‐term health measures -‐ time spent undertaking physical activity, as a proxy for individuals physical health, and mental illness symptoms; both measures were expected to relate more closely to an individual’s current neighbourhood environment than if measured by a chronic medical state. This is based upon respondents to the 2011/12 NZ Health Survey (NZHS), focused on the area of the Auckland Unitary Authority (‘supercity’) which represents a range of urban environments with varying demographic makeup and population densities. It was anticipated that distinguishing between exposure to usable and all greenspace would yield further insights into the causal pathways of greenspace and health, as the physical activity and social interaction pathways should only be affected by usable greenspace, whereas the therapeutic landscape pathway should be affected by both. Such insights could be useful in the development of policy and urban planning to improve the salutogenic properties of future communities.
7
2. Background The contribution of environmental influences on health was developed notably by Antonovsky (1979) who introduced the notion of salutogenesis, broadening the understanding of health beyond the prevailing pathogenic view to encompass both positive and negative influences on health. This notion has been embraced in the field of health geography, which has taken a closer look at the role of place in influencing the health of individuals, commonly dividing such influences into the compositional or contextual (Macintyre, Maciver, & Sooman, 1993). Compositional effects take account of the selection of individuals in a neighbourhood, for instance neighbourhoods with more affluent individuals; whereas contextual factors include the characteristics of the neighbourhood that have an association with the health of residents, such as the provision of public amenities. Both are often intrinsically related, for instance affluent individuals may be attracted to areas with greater public amenities; thus separating composition from context is an on-‐going challenge to understanding the contribution of place towards health (Vries, Verheij, Groenewegen, & Spreeuwenberg, 2003). Investigation of the spatial relationship between greenspace and health began with the quantitative study of Ulrich (1984) which found significant differences in recovery rates for gall-‐bladder removal surgery patients between those in rooms with a view of a stand of trees and those looking out to a brick wall. A significant body of work has extended this notion to investigate the contribution of greenspace in urban areas on the health of urban inhabitants (Dillen et al., 2012; Lachowycz & Jones, 2011; Vries et al., 2003).
2.1 Theoretical framework The association between urban greenspace and health is underpinned through a set of three theoretical pathways developed in an extensive body of quantitative and qualitative studies. Greenspace is proposed to act as a therapeutic landscape, supporting relaxation and recovery from stressful activities and attention fatigue; it is proposed that this is mediated by visualisation of greenspace (Hartig et al., 2011). As visualisation is derived through passive engagement, it is not dependent on
8
Nicholas Brunsdon physical access, and thus views of inaccessible greenspaces such as neighbouring private gardens may contribute towards this pathway (Dillen et al., 2012). Secondly, greenspace is theorised to promote physical activity by providing a venue for physical activity and to encourage active lifestyles more generally, all of which mitigate mental illnesses and improve physical health with lower risk of heart disease and obesity related conditions (Vries et al., 2011). Thirdly, it is proposed that access to greenspace may provide a venue for social interaction with resultant positive impacts on mental health through group activities and social encounters (Maas, van Dillen, Verheij, & Groenewegen, 2009; Zhou & Rana, 2012). Both the physical activity and social interaction pathways rely on active engagement with greenspaces; consequently such greenspaces should be accessible, publicly accessible and have sufficient size to influence health through these pathways. A number of studies have established the significance of environmental determinants, particularly the accessibility of recreational facilities on physical activity behaviours (Wendel-‐Vos, Droomers, Kremers, Brug, & Van Lenthe, 2007).
2.2 Prior studies The contribution of greenspace to health outcomes has been studied extensively, particularly over the past decade following improvement in computing power and development of geographic information systems (GIS). Of 60 studies investigating greenspace, 68% found positive or weak positive relationships with obesity-‐related measures, and 40% found a positive relationship with self-‐reported physical activity measures (Lachowycz & Jones, 2011). As part of isolating compositional and contextual effects, studies tend to find significant interaction in this relationship with sex and ethnicity (Kerr, Frank, Sallis, & Chapman, 2007; Pate et al., 2008). While gross measures of greenspace availability are common, studies attempting to quantify the quality of greenspace have found that the two are often related, and that the quality of greenspaces can also be positively correlated with health (Dillen et al., 2012).
9
In New Zealand, only a handful of studies attempted to quantify the health impact of exposure to greenspace, and found no relationship between greenspace access and cause-‐specific mortality (Richardson, Pearce, Mitchell, Day, & Kingham, 2010); or BMI, sedentary behaviour or physical activity (Witten, Hiscock, Pearce, & Blakely, 2008). More recently, Richardson, Pearce, Mitchell, & Kingham (2013) found lower risks of mental health and cardiovascular disease in neighbourhoods with greater areas of public greenspace, and slightly higher levels of physical activity. It has been suggested that universally high access to greenspaces, particularly private gardens results in low variation in accessibility or exposure measures, and this explains their poor explanatory power in the New Zealand context. Private gardens in New Zealand tend to be larger than the United Kingdom counterparts (Loram, Tratalos, Warren, & Gaston, 2007; Mathieu, Freeman, & Aryal, 2007); and residents in three out of four New Zealand neighbourhoods are within a 2.4 minute car trip to a park of some form (Witten et al., 2008). Indeed, Pearce, Witten, & Bartie (2006) found that parks were the most accessible of all community facilities in their New Zealand study. Due to significant variation in health states and behaviours across society, differences in age, gender and income must be considered before isolating the contribution of greenspace on health, otherwise compositional factors, such as the demographics of a neighbourhood will be attributed to the contextual factors of greenspace. The prevalence of depression is found to be higher in women than in men, and across both genders is higher at early and later stages of life (Mirowsky, 1996). There is non-‐causal evidence of a higher prevalence amongst individuals of lower incomes (Zimmerman & Katon, 2005). Anxiety disorders are slightly more prevalent amongst women, however age and gender correlates of anxiety disorders are weak due the heterogeneous nature of conditions that comprise anxiety disorders, as there are strong trends within specific anxiety disorders (Anthony & Stein, 2008; Crawford & Henry, 2003). Neighbourhood socioeconomic deprivation (SED) is identified as a correlate of depression and anxiety disorder prevalence in some studies (Kling, Liebman, & Katz, 2007; Lofors, Ramírez-‐León, & Sundquist, 2006; Mair, Roux, & Galea, 2008; Stafford & Marmot, 2003). Ethnicity is often a
10
Nicholas Brunsdon significant correlate of both, although this is often captured within income and SED measures, and is ultimately context dependent (Anthony & Stein, 2008).
2.3 Health and greenspace methodologies Greenspace and health studies tend to take a cross sectional approach – seeking to understand the relationship by looking at a cross section of a society at a single point in time. Studies will often quantify health with long-‐term indicators such as cardiovascular disease or obesity, and attempt to associate their prevalence with an individuals’ residence at that point in time. However, this approach does not account for migration and the effect of previous residences on an individuals’ present health, particularly when measuring an individuals’ health state through the presence of long term health conditions such as obesity and cardiovascular disease. Long term conditions manifest out of lifestyle and environmental factors over a lifetime, thus to accurately understand their prevalence requires an understanding of all of individuals residences and other environmental factors throughout their lifetime (World Health Organization et al., 2011). This would ideally be achieved through a longitudinal study, however these are rare and generally expensive.
2.3.1 Health Methodologies Studies analysing the impact of greenspace on mental health tend to use doctor-‐ diagnosed disorders, however this is subject to the aforementioned limitations of the cross-‐sectional approach -‐ mental illnesses can be persistent (Mann, 2005), thus mental illness can be a function of previous environments. Short-‐term indicators such as depressive or nervous feelings provide an alternative to this, as these are less dependent on prior mental illnesses and more likely to reflect the present environment experienced by an individual, whilst also consistently indicate clinical mental illness (Solomon, Haaga, & Arnow, 2001; Weissman, Sholomskas, Pottenger, Prusoff, & Locke, 1977). Self-‐reported mental illness or symptoms also have lower survey collection costs and are commonly used instead of diagnosis by a medical professional (Dillen et al., 2012; Gove & Geerken, 1977; Spitzer, Kroenke, & Williams,
11
1999). A small number of studies have qualitatively assessed the restorative health benefit of private gardens, particularly for mental health (Stigsdotter & Grahn, 2004; Unruh, 2002), however these often fail to account for the size of the garden or the neighbourhood characteristics such as accessibility to public greenspace. Levels of physical activity are commonly obtained through self-‐reported measures (Lachowycz & Jones, 2011), and have a significant variation by gender and age, with lower activity in woman compared to men, and declining as age increase (Trost, Owen, Bauman, Sallis, & Brown, 2002). There is some evidence of higher levels of physical activity amongst individuals of higher incomes (Craig, Russell, Cameron, & Bauman, 2003). Contextual factors were found to explain physical activity in a study of individuals in Perth, Australia, with those in high SED neighbourhoods less likely to undertake physical activity than those in low SED areas, in spite of higher access to recreational facilities in high SED areas (Giles-‐Corti & Donovan, 2002). Physical activity is also related to mental illness, with significant evidence that physical activity is an effective treatment for depression (Babyak et al., 2000) and anxiety disorders (O’Connor, Raglin, & Martinsen, 2000).
2.3.2 Greenspace Methodologies Greenspace is typically defined to include parks, reserves and other public open spaces within an urban setting (American Planning Association & National Association of County & City Health Officials, 2013; Lee & Maheswaran, 2011); however this has been broadened to include vegetation in a streetscape setting (Vries, Dillen, Groenewegen, & Spreeuwenberg, 2013). This is frequently quantified through accessibility or exposure measures, with some studies delving beyond into the usability or quality of greenspace. Public greenspaces are often studied due to the ease of access to data through public amenity databases, however techniques have been developed with remote sensing to map private greenspaces. Such measures applied to private gardens have been advanced in the field of ecology, but are limited by the availability and cost of high resolution imagery, and have not been widely applied to health (Mathieu et al., 2007). 12
Nicholas Brunsdon Greenspace is commonly sub-‐classified into usable greenspace, that is, public spaces that not only provide visual amenity, but also are functional for the purposes of physical activity or social interaction; and non-‐usable greenspace from which benefit is largely derived through visualisation rather than physical engagement. A range of criteria have been applied for this classification, but the most common criteria for physical activity by adults is that a contiguous area be greater than 2 hectares (Coombes, Jones, & Hillsdon, 2010; Natural England, 2009; Stubbs, 2008). As physical activity in a greenspace requires active engagement, the most appropriate measure of accessibility is based on road network distance or time, as travel time to visit a greenspace will depend on the connectivity of the road network in most cases (Comber, Brunsdon, & Green, 2008; Pearce et al., 2006). Studies typically use the network travel time or distance to the nearest single greenspace, or the number of greenspaces within a specific travel time as an indicator of access, however this fails to take account of other preference factors in the decision making process of individuals selecting a greenspace to exercise in (Lachowycz & Jones, 2011). Indicators of the distribution of greenspaces are most commonly used to predict the health status or physical activity level of individuals in the absence of specific information on greenspace preferences. The visualisation of greenspace for the therapeutic landscape pathway is commonly measured by exposure rather than accessibility of greenspace, as visualisation can be passive. Given that this benefit does not require physically visiting greenspace, a network measure of accessibility is not appropriate; instead a buffer approach is commonly used. A buffer is a circular area cast around a point by a fixed distance, an example of which can be seen later in Figure 3. Greenspace studies tend to derive buffers around points that represent individuals or neighbourhoods, and calculate the area of greenspace contained by the buffer to indicate greenspace exposure for those individual(s) (Lachowycz & Jones, 2011). The influence of greenspace on health been observed with buffers with radii from 500 metres to 3 kilometres, although this does not take into account terrain and other obstructions to the visualisation of greenspace (Barbosa et al., 2007; Dadvand et al., 2012; Dillen et al., 2012; Richardson et al., 2012; Schipperijn, Stigsdotter, Randrup, & Troelsen, 2010; 13
Villeneuve et al., 2012). Similarly, the influence of greenspace on house prices was noted to extend to 2km (Mayor, Lyons, Duffy, & Tol, 2009).
14
Nicholas Brunsdon
3. Research Objectives The contribution of urban greenspace to health outcomes has been studied widely internationally, and to a limited degree in New Zealand. However, significant results overseas have not been widely replicated in New Zealand to date, with private gardens typically ignored. This study sought to adapt existing methodologies to incorporate private greenspace into an assessment of the impact of urban greenspace exposure and accessibility on health. Furthermore, this study will appraise health through short-‐term indicators, instead of the prevailing approach of using long-‐term indicators. The following research questions were devised to further the understanding of the greenspace and health relationship, particularly in the New Zealand context and through the investigation of private greenspace.
3.1 Research Questions Does living near usable greenspace influence the time spent by individuals undertaking physical activities? Does the exposure or accessibility to public greenspace in urban contexts influence short-‐term mental health indicators? Does the exposure to private greenspace in urban contexts influence short-‐term mental health indicators?
15
4. Methods This study follows the conceptual model illustrated in Figure 1 that relates greenspace data sources, theoretical pathways and health outcomes, with analysis structured such that the contribution of each causal pathway can be quantified. Spatial analysis of the greenspace data inputs was conducted in the Spatial and Network analysis extension of ESRI ArcMap, which then fed into health analysis in the statistical analysis package STATA. Health analysis was based upon the 2,557 respondents to the New Zealand Health Survey (NZHS) within the Auckland study area.
Figure 1: -‐ Theoretical overview of linkages between greenspace data, greenspace classifications, theoretical linkages and hypothesised health outcomes
16
Nicholas Brunsdon
4.1 Spatial Analysis Spatial analysis was restricted to the territory of the Auckland Unitary Authority (‘Supercity’). High-‐resolution impervious surface data was sourced from the Auckland Council, however this was not available for meshblocks in the North Shore and Albany wards, and thus these areas were excluded from analysis. Likewise, NZHS data was not collected for meshblocks on populated islands in the Waitemata and Gulf wards, so the study area was reduced further to the extent highlighted in Figure 2.
Figure 2: -‐ Map of study area in relation to Auckland cities, noting the exclusion of North Shore, Albany and Gulf Harbour islands. Inset: New Zealand, with Auckland region indicated.
17
Spatial analysis was conducted with census meshblocks, as data from the NZHS was aggregated to this level to preserve the anonymity of individuals. With no indication of greenspace preferences and aggregation of individual respondents to the meshblock level, the influence of greenspace on individuals’ health was estimated from the exposure of their meshblock to greenspace. Greenspace exposure was assessed from a population-‐weighted centroid (PWC) for each meshblock, a single point that represents a meshblock area with consideration of the population distribution within the meshblock, which is illustrated in Figure 3 for an illustrative meshblock. In this study greenspace was assessed in three senses – all public, public usable and all greenspace (private and public, from impervious surfaces).
Figure 3: -‐ Map of illustrative meshblock showing the relationship between the meshblock area, where NZHS respondents are located, and the PWC representing the meshblock. 500m and 2000m buffers are measured as radii from the PWC
18
Nicholas Brunsdon
4.1.1 Public greenspaces Public greenspaces were located from the dataset developed in Pearce et al. (2006) and Richardson et al. (2010) which augmented the nationwide, low resolution Land Cover Database (LCDB2) with finer, less contiguous datasets from Department of Conservation (DoC) and Land Information New Zealand. This included natural areas such as parks, beaches and fields, although excluded aquatic areas such as lakes and the sea, as these are not considered greenspaces. The dataset classifies greenspaces into two types based on the way in which individuals are theorised to benefit from them. Visual amenity can be derived through passive engagement with all forms of greenspace; usable public greenspaces as a subset of public greenspace include parks where individuals can derive benefit through active engagement, such as through physical activity or social interaction within the space. These greenspaces were dissolved such that areas with common boundaries were joined together, which included of 9,052 distinct greenspaces (134,680 hectares) within the study area. The exposure to all public greenspace (usable and non-‐usable) for the purposes of assessing therapeutic landscape effects was assessed in terms of a Euclidean distance buffer of 0-‐500 metres and 500-‐2000 metres (effectively a doughnut), as the visualisation of greenspace need not depend on access via the road network (Barbosa et al., 2007; Dadvand et al., 2012; Dillen et al., 2012; Richardson et al., 2012; Schipperijn et al., 2010; Villeneuve et al., 2012). Visualisation will be affected by terrain and built environment obstructions, however this was not able be appraised in this study. Euclidean buffers around each meshblock PWC were generated (Figure 4), and the proportion of land within each buffer area (excluding the ocean) that was covered by public greenspace within the buffer derived. For buffers that included bodies of water, the greenspace areas were given as a proportion of the buffer area that comprised land.
19
Figure 4: -‐ Map of illustrative meshblock showing 0-‐500m and 500-‐2000m (doughnut) buffers from the meshblock PWC and how all public greenspace (usable and non-‐usable) within each buffer is identified from which to be calculated as a proportion of the total buffer size.
4.1.2 Usable greenspaces Usable greenspaces are a subset of public greenspaces, defined as being larger than 2 hectares (Coombes et al., 2010; Natural England, 2009) and accessible via the road network as this is the most likely connection between an individuals’ residence and their physical use of greenspace. The spatial resolution of the public greenspace dataset was variable, with resolution as coarse as 15 metres in some instances. To accommodate this, greenspace within 15 metres of the road network was determined to be usable and located on the road network. This usable subset of
20
Nicholas Brunsdon public greenspaces comprised 1,499 usable recreation spaces (38,260 hectares). In the absence of specific information on the entranceways to greenspaces, areas of usable greenspace within 15 metres of roads were assumed to be entrances; this will likely overstate the accessibility, as it does not incorporate terrain or fencing obstructions. Without knowing how respondents decide which greenspace to visit, a typical approach is to assume the nearest park and measure the distance to that; however this approach ignores the broader influence of multiple parks in their vicinity. Measuring accessibility through the average distance to the nearest five usable greenspaces provides a greater indication of this influence, and the mean distance to the nearest five facilities is a common compromise that draws from a slightly wider sphere of influence without being distorted by distant features without influence. The access for each meshblock to the nearest usable greenspace was appraised from the population weighted centroid (PWC) to the nearest five usable greenspaces (Figure 5), measured in terms of the median travel time in minutes along the road network.
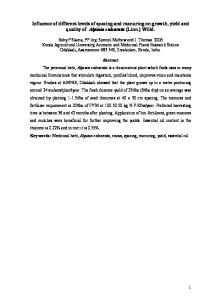
4.1.1 Impervious surfaces Private greenspaces were identified using a novel method that takes impervious surface data to identify spaces that are not greenspace, and inferring that the remainder of spaces are likely to be private or public greenspace of some form. This followed a similar theoretical approach and method as for public greenspace, calculating the proportion of a 0-‐500 metre and 500-‐2000 metre buffer around each meshblock PWC that is covered by impervious surfaces, the inverse of which is proposed as a measure of exposure to private and public greenspaces for individuals residing in the meshblock. Data illustrating impervious surfaces across the Auckland Region (excluding North Shore and Albany) was obtained from the Auckland Council. Figure 6 shows the impervious surface layer illustrating roads, building rooftops, paths and carparks within a 0-‐500 metre buffer. This follows the inherent assumption that areas outside impervious surfaces are some form of greenspace, and that neighbours derive a therapeutic landscape effect from the presence of their neighbours private gardens. Due to the different spatial resolutions of greenspace
21
and impervious surfaces data, it was impractical to remove areas of overlap between these layers without losing significant data. As such, impervious surface data did overlap public greenspaces in some instances, such as sealed carparks within a recreational reserve land parcel. However this overlap was minimal, with an average 7.8% of public greenspaces covered by impervious surfaces, up to a maximum of 15.5%.
Figure 5: -‐ Map of illustrative meshblock showing usable greenspaces and how their accessibility to the meshblock is appraised – by the average travel time via the road network from the meshblock PWC to the nearest five usable greenspaces
22
Nicholas Brunsdon
Figure 6: -‐ Map of illustrative meshblock showing impervious surfaces (such as roads, buildings and footpaths) within and beyond a 500m buffer of the meshblock. It is proposed that the inverse of the impervious surfaces represent greenspaces of some form
4.2 Health analysis Health analysis was based upon responses to the NZHS, which is administered and distributed by the Ministry of Health (MoH). Greenspace characteristics derived for each of the 237 Auckland region census meshblock in which the 2011/12 NZHS sampled were sent to the MoH. As these characteristics were calculated to several decimal places, they may have served as unique identifiers for individual meshblocks, and thus could have potentially been used to locate survey respondents and breach their anonymity. This was addressed by categorising these variables into
23
quintiles prior to sending the data to MoH, which are summarized in Table 1 alongside the New Zealand Index of Deprivation (Salmond, Crampton, & Atkinson, 2007) as an indicator of SED, based on the 2006 national census, which was collapsed from deciles into quintiles for ease of interpretation. MoH then attached the NZHS data of all respondents in these Auckland meshblock to meshblock characteristics before meshblock identifiers were removed to ensure the confidentiality of NZHS respondents, and anonymised data was returned to this researcher. Based on the NZHS sampling methodology, the sample of 2,557 adults is expected to be representative of a population of 810,159 adults. Table 1: -‐ Summary information for area-‐level variables of respondents
n % NZ Index of Deprivation 1 -‐ Low 373 14.6 2 501 19.6 3 382 14.9 4 538 21.0 5 -‐ High 763 39.8 Usable greenspace accessibility 1 -‐ Low 96 3.8 2 384 15.0 3 542 21.2 4 1042 40.8 5 -‐ High 493 19.3 Proportion of all public greenspace within 500m buffer (usable and non-‐usable) 1 -‐ Low 675 26.4 2 663 25.9 3 622 24.3 4 368 14.4 5 -‐ High 229 9.0 Proportion of all public greenspace within 2000m buffer (usable and non-‐usable) 1 -‐ Low 765 29.9 2 808 31.6 3 555 21.7 4 262 10.2 5 -‐ High 167 6.5
24
Nicholas Brunsdon Table 1 (cont.)
n % Proportion of all greenspace (from impervious surfaces) within 0-‐500m buffer 1 -‐ Low 487 19.0 2 499 19.5 3 545 21.3 4 474 18.5 5 -‐ High 552 21.6 Proportion of all greenspace (from impervious surfaces) within 500-‐2000m buffer 1 -‐ Low 475 18.6 2 522 20.4 3 536 21.0 4 527 20.6 5 -‐ High 497 19.4
A series of processing steps was taken with the raw survey data to enable regression analysis. Continuous variables were recoded into categorical form to meet the requirements of logistic regression, and all variables were recoded such that values of 0 represented the reference category – for example the depressive feelings question was recoded such that value 0 represented no symptoms of depression and values 1 to 4 represented increasing frequency of such symptoms. Survey responses indicating the average time spent exercising in hours and minutes and the frequency of such exercise in the past seven days were combined to estimate the total time spent exercising under each measure in the past seven days, and were then recoded into tertiles as this was best suited to their distribution. The recoded variables of individual characteristics of NZHS respondents in the study area are summarised in Table 2.
25
Table 2: -‐ Summary information for 2,557 adult respondents to the 2011/12 NZHS within the Auckland study area, representing a population of 810,159.
n % Sex Female 1537 60.1 Male 1020 39.9 Age (years) 15 – 24 341 13.3 25 – 34 522 20.4 35 – 44 556 21.7 45 – 54 407 15.9 55 – 64 331 12.9 Over 65 400 15.6 Depressive feelings in past 4 weeks Never 2048 80.2 A little of the time 295 11.5 Some of the time 154 6.0 Most of the time 46 1.8 All of the time 12 0.5 Nervous feelings in past 4 weeks Never 1805 70.7 A little of the time 458 17.9 Some of the time 223 8.7 Most of the time 52 2.0 All of the time 15 0.5 Ever been diagnosed by a doctor with depression No 2245 87.9 Yes 308 12.1 Ever been diagnosed by a doctor with an anxiety doctor No 2420 94.8 Yes 133 5.2 Time spent undertaking moderate physical activity in past week (minutes) 0 1023 40.0 10 – 60 914 35.7 61 – 1020 620 24.2 Time spent undertaking vigorous physical activity in past week (minutes) 0 1793 70.1 10 – 55 271 10.6 60 – 1200 493 19.3 Time spent brisk walking in past week (minutes) 0 942 36.8 10 – 30 809 31.6 31 – 1200 806 31.5
26
Nicholas Brunsdon Table 2 (cont.)
n All time spent exercising in past week (minutes) 0 404 10 – 90 1045 91 – 1810 1108
% 15.8 40.9 43.3
An initial correlative analysis was applied to the area level variables to yield correlation coefficients with p-‐values for meshblock greenspace measures and SED (Table 3). The primary analysis was undertaken with logistic regressions in the statistical software package STATA using different measures of time spent exercising and mental illness symptoms as the dependent variables. This produced odds ratios that were relative to the reference category alongside 95% confidence intervals -‐ intervals that included the value 1.00 are statistically insignificant. For each of the dependent variables (time spent undertaking various forms of physical activity and mental illness symptoms) these were regressed separately against each explanatory variable through a logistic regression (Tables 4 and 6). This provided a basic understanding of how these variables related to the dependent variables before constructing a complete model that used the explanatory variables simultaneously (Tables 5, 7, 8 and 9). A model for each dependent variable was built up iteratively by adding demographic and neighbourhood SED explanatory variables, seeking the model with the greatest explanatory power as given by the F statistic. From the selected model for each dependent variable, greenspace variables were then added to assess the explanatory power of neighbourhood greenspace. The NZ Index of Deprivation, of which average meshblock income is a component, was found to be more significant than individual income as a control variable, as not all NZHS respondents reported their income. The NZHS sampling methodology aims to oversample minority groups to improve analysis of small populations; as a result the raw survey data is not representative of the overall population (Ministry of Health, 2012). To overcome this, MoH provided weightings that were incorporated into regression analysis to modify variances, and therefore confidence intervals, such that the actual population distribution is reflected.
27
5. Results The correlation matrix (Table 3) indicates the covariance of each of the area level variables– greenspace and deprivation. The correlation between usable greenspace measures and all public greenspace within 0-‐500 metres was a weak 0.3477, and diminished with the 500-‐2000 metre buffer of all public greenspace with 0.1852. All public greenspace and all greenspace (derived from impervious surfaces) were moderately correlated with a coefficient of 0.5890 within the 0-‐500 metre buffers and 0.5453 in the 500-‐2000 metre buffers. All public greenspace within 0-‐500 metre and 500-‐2000 metre were moderately correlated with a coefficient of 0.4720; similarly the two buffer areas for all greenspace (derived from impervious surfaces) were correlated by a factor of 0.6259. Neighbourhood access or exposure to greenspace was weakly correlated with socioeconomic deprivation, with a coefficient of 0.1354 between deprivation and usable greenspace access and weaker correlations for the all and all-‐public greenspace measures. Table 3: -‐ Correlation matrix of area level greenspace and deprivation variables, indicating correlation coefficient (p-‐value).
28
Usable public greenspace access
All public greenspace 0-‐500m
All public greenspace 500-‐2000m
All greenspace 0-‐500m
All greenspace 500-‐2000m
NZ Index of Deprivation Usable public greenspace access All public greenspace 0-‐500m All public greenspace 500-‐2000m All greenspace 0-‐500m All greenspace 500-‐2000m
NZ Index of Deprivation
1.000
0.1354 (0.0000) -‐0.0154 (0.4374)
1.000
0.3477 (0.0000)
1.000
0.0661 (0.0008)
0.1852 (0.0000)
0.4720 (0.0000)
1.000
-‐0.0495 (-‐.0123) -‐0.0023 (0.9085)
-‐0.0703 (0.0004) -‐0.1261 (0.0000)
0.5890 (0.0000) 0.3102 (0.0000)
0.4020 (0.0000) 0.5453 (0.0000)
1.000
0.6259 (0.0000)
1.000
Nicholas Brunsdon An initial regression of time spent undertaking various forms of physical activity with age, sex and neighbourhood access to usable greenspace is shown in Table 4, indicating the underlying relationship with the physical activity before a model was built to control for each of these factors together. Table 4 indicates that older age groups generally undertake increasingly less physical activity -‐ individuals over 65 are 78% less likely to undertake vigorous physical activity than those aged 15 to 24. Moderate physical activity runs counter to this, with individuals’ aged 25 – 64 equally or more likely to than the reference group. Similarly, males are more likely to undertake all forms of physical activity than females – from 80% more likely to undertake vigorous physical activity to 9% more likely to undertake brisk walking. Table 4: -‐ Logistic regression of the relationship between time spent exercising (dependent variable) and individual and area level variables, each considered separately. Results are given as odds ratios (95% confidence intervals) relative to the reference category (odds ratio=1.00).
Brisk walking
Age 15 – 24 1.00 25 – 34 0.94 (0.61 –1.46) 35 – 44 0.82 (0.54 –1.23) 45 – 54 0.88 (0.58 – 1.34) 55 – 64 0.91 (0.59 – 1.41) Over 65 0.44 (0.28 – 0.69) Sex Female 1.00 Male 1.09 (0.91 –1.32) NZ index of deprivation 1 -‐ Low 1.00 2 0.71 (0.47 – 1.07) 3 0.63 (0.35 – 1.12) 4 0.54 (0.37 – 0.81) 5 -‐ High 0.58 (0.40 – 0.84) Usable greenspace accessibility 1 -‐ Low 1.00 2 1.48 (0.59 –3.72) 3 1.56 (0.73 –3.33) 4 1.39 (0.62 – 3.12) 5 -‐ High 1.57 (0.70 –3.50)
Moderate physical activity
Vigorous physical activity
All physical activity
1.00 1.06 (0.72 – 1.56) 1.00 (0.69 – 1.44) 1.07 (0.71 – 1.62) 1.13 (0.70 – 1.83) 0.61 (0.39 – 0.95)
1.00 0.77 (0.53 – 1.11) 0.67 (0.46 – 0.98) 0.49 (0.31 – 0.78) 0.51 (0.33 – 0.78) 0.22 (0.14 – 0.36)
1.00 1.19 (0.76 – 1.81) 1.10 (0.77 – 1.59) 1.18 (0.82 – 1.69) 1.10 (0.69 – 1.74) 0.50 (0.33 –0.77)
1.00 1.39 (1.13 – 1.72)
1.00 1.80 (1.41 – 2.30)
1.00 1.79 (1.44 – 2.24)
1.00 1.06 (0.69 – 1.62) 1.13 (0.68 – 1.88) 0.79 (0.54 – 1.17) 0.61 (0.42 – 0.86)
1.00 0.61 (0.38 – 0.98) 0.66 (0.44 – 0.99) 0.52 (0.38 – 0.71) 0.52 (0.37 – 0.74)
1.00 0.76 (0.50 – 1.15) 0.52 (0.35 – 0.76) 0.48 (0.36 – 0.64) 0.48 (0.32 –0.67)
1.00 0.49 (0.19 – 1.23) 0.53 (0.22 – 1.24) 0.56 (0.24 – 1.31) 0.55 (0.24 – 1.28)
1.00 0.44 (0.17 – 1.19) 0.59 (0.25 – 1.40) 0.56 (0.22 – 1.41) 0.33 (0.13 – 0.85)
1.00 0.83 (0.30 – 2.32) 1.08 (0.40 – 2.90) 0.86 (0.31 – 2.36) 0.89 (0.32 –2.52)
29
The complete regression models of Table 5 outline the relationship between neighbourhood access to usable greenspace and physical activity, with age, sex and neighbourhood deprivation controlled for when significant. Neighbourhood SED was a significant descriptor of all forms of physical activity, with a clear pattern of lower levels of physical activity in more deprived areas. A significant relationship was found between vigorous physical activity and access to usable greenspace in the quintile with highest access, however this was not significant across other quintiles. Individuals residing in neighbourhoods with the highest accessibility to usable greenspace 61% less likely (odds ratio 0.39) to undertake vigorous physical activity than those in the lowest quintile for accessibility. No significant relationship or discernible trend was found for brisk walking, moderate or all forms of physical activity. Table 5: -‐ Logistic regression of the relationship between time spent exercising (dependent variable) and area level usable greenspace access, controlling for age, sex and area deprivation. Results are given as odds ratios (95% confidence intervals) relative to the reference category (odds ratio=1.00)
Brisk walking
Usable greenspace accessibility 1 -‐ Low 1.00 2 1.56 (0.56 – 4.37) 3 1.66 (0.68 – 4.07) 4 1.50 (0.57 – 3.93) 5 -‐ High 1.80 (0.70 – 4.62)
Moderate physical activity
Vigorous physical activity
All physical activity
1.00 0.51 (0.21 – 1.27) 0.54 (0.23 – 1.31) 0.60 (0.25 – 1.44) 0.62 (0.26 – 1.48)
1.00 0.50 (0.22 – 1.12) 0.65 (0.31 – 1.37) 0.66 (0.30 – 1.47) 0.39 (0.17 – 0.87)
1.00 0.93 (0.31 – 2.74) 1.18 (0.41 – 3.42) 0.98 (0.33 – 2.85) 1.09 (0.36 – 3.27)
An initial regression of depressive feelings and nervous feelings with prior doctor diagnosis, age, sex and various measures of neighbourhood greenspace is shown in Table 6. A strong correlation between depressive feelings and previous doctor diagnosis for depression is evident, as is nervous feelings and previous doctor diagnosis for anxiety disorders, with higher prevalence associated with prior diagnosis. Age, sex and neighbourhood SED added insignificant explanatory power to the mental illness models, however did present some statistically insignificant trends. A higher prevalence of depressive feelings was found in middle age groups and in woman, and in the most deprived neighbourhoods. Nervous feelings were
30
Nicholas Brunsdon more prevalent in younger age groups and in males, and had no discernible relationship with neighbourhood SED. No discernible pattern was found between usable greenspace, all public greenspace or all greenspace (from impervious surfaces) and mental illness when considered alone. Table 6: -‐ Logistic regression of the relationship between mental illness symptoms (dependent variable) and individual and area level variables, each considered separately. Results are given as odds ratios (95% confidence intervals) relative to the reference category (odds ratio=1.00).
Depressive feelings Age 15 – 24 1.00 25 – 34 1.21 (0.76 – 1.93) 35 – 44 1.19 (0.80 – 1.78) 45 – 54 1.20 (0.74 – 1.94) 55 – 64 0.90 (0.56 – 1.46) Over 65 1.04 (0.64 – 1.69) Doctor diagnosis No 1.00 Yes 5.10 (3.48 – 7.46) Sex Female 1.00 Male 0.77 (0.60 – 0.99) NZ index of deprivation 1 -‐ Low 1.00 2 1.94 (1.15 – 3.29) 3 1.44 (0.85 – 2.43) 4 1.82 (1.05 – 3.15) 5 -‐ High 2.04 (1.18 – 3.52) Usable greenspace accessibility 1 -‐ Low 1.00 2 0.76 (0.45 – 1.30) 3 0.71 (0.38 – 1.33) 4 1.01 (0.56 – 1.83) 5 -‐ High 0.98 (0.56 – 1.72) Proportion of all public greenspace within 0-‐500m buffer 1 -‐ Low 1.00 2 1.03 (0.70 – 1.51) 3 0.73 (0.47 – 1.13) 4 0.78 (0.59 – 1.02) 5 -‐ High 1.02 (0.58 – 1.79)
Nervous feelings 1.00 0.85 (0.57 – 1.29) 0.59 (0.43 – 0.82) 0.62 (0.43 – 0.89) 0.34 (0.21 – 0.54) 0.23 (0.15 – 0.37) 1.00 3.81 (2.43 – 5.97) 1.00 1.07 (0.86 – 1.33) 1.00 1.41 (0.95 – 2.10) 1.06 (0.69 – 1.64) 1.19 (0.71 – 2.00) 1.10 (0.70 – 1.72) 1.00 0.80 (0.50 – 1.21) 0.76 (0.40 – 1.41) 1.00 (0.62 – 1.61) 2.23 (0.80 – 6.24) 1.00 0.45 (0.17 – 1.17) 0.34 (0.13 – 0.87) 0.35 (0.13 – 0.94) 0.45 (0.16 – 1.25)
31
Table 6 (cont.)
Depressive feelings Nervous feelings Proportion of all public greenspace within 500-‐2000m buffer 1 -‐ Low 1.00 1.00 2 1.02 (0.64 – 1.64) 0.84 (0.56 – 1.24) 3 1.15 (0.74 – 1.80) 0.86 (0.55 – 1.33) 4 0.96 (0.57 – 1.61) 0.75 (0.38 – 1.47) 5 -‐ High 0.99 (0.37 – 2.64) 0.52 (0.23 – 1.19) Proportion of all greenspace (impervious surfaces) within 0-‐500m buffer 1 -‐ Low 1.00 1.00 2 1.38 (0.84 – 2.29) 1.16 (0.72 – 1.88) 3 1.15 (0.52 – 2.55) 0.71 (0.39 – 1.27) 4 1.13 (0.66 – 1.94) 0.73 (0.42 – 1.28) 5 -‐ High 1.12 (0.70 – 1.81) 1.14 (0.68 – 1.90) Proportion of all greenspace (impervious surfaces) within 500-‐2000m buffer 1 -‐ Low 1.00 1.00 2 1.05 (0.55 – 2.00) 0.78 (0.47 – 1.30) 3 0.69 (0.38 – 1.25) 0.48 (0.28 – 0.81) 4 0.91 (0.57 – 1.47) 0.75 (0.45 – 1.28) 5 -‐ High 0.86 (0.55 – 1.33) 0.74 (0.44 – 1.27) Table 7 outlines the regression of mental illness symptoms with neighbourhood access to usable greenspace while controlling for doctor diagnosis. Individuals living in the third and fourth quintile for usable greenspace access were found to have significantly lower incidence of nervous feelings, 66% less likely (odds ratio 0.34) than those residing in the lowest quintile for access; however there was no significant relationship overall. In the building of the model, individual or area level variables established in other studies did not improve the explanatory power of the model and were excluded. Table 7: -‐ Logistic regression of the relationship between mental illness symptoms (dependent variable) and usable greenspace, controlling for prior doctor diagnosis. Results are given as odds ratios (95% confidence intervals) relative to the reference category (odds ratio=1.00).
Usable greenspace accessibility 1 -‐ Low 2 3 4 5 -‐ High
32
Depressive feelings
Nervous feelings
1.00 1.07 (0.72 – 1.58) 0.82 (0.51 – 1.32) 0.82 (0.57 – 1.18) 1.21 (0.64 – 2.29)
1.00 0.43 (0.17 – 1.09) 0.34 (0.13 – 0.84) 0.34 (0.13 – 0.91) 0.46 (0.16 – 1.28)
Nicholas Brunsdon
Table 8 outlines the regression model of mental illness symptoms and all public greenspace as measured in 0-‐500 metre and 500-‐2000 metre buffer areas. This relationship was found to be insignificant for depressive symptoms with odds ratios higher and lower than 1.00. Nervous feelings were insignificantly correlated with neighbourhood greenspace, but it is noteworthy that odds ratios for greenspace within the 0-‐500 metre buffers were primarily above 1.00, and odds ratios for the 500-‐2000 metre buffers were consistently below 1.00. This could suggest that greenspace within the different buffer areas has a divergent effect on mental health, however no conclusion can be drawn due to the insignificance of these results. Prior doctor diagnosis was a significant predictor of present mental illness symptoms. Table 8: -‐ Logistic regression of the relationship between mental illness symptoms (dependent variable) and public greenspace, controlling for prior doctor diagnosis. Results are given as odds ratios (95% confidence intervals) relative to the reference category (odds ratio=1.00).
Depressive feelings Proportion of all public greenspace within 0-‐500m buffer 1 -‐ Low 1.00 2 0.84 (0.55 – 1.28) 3 1.07 (0.74 – 1.56) 4 1.06 (0.43 – 2.59) 5 -‐ High 0.93 (0.39 – 2.22) Proportion of all public greenspace within 500-‐2000m buffer 1 -‐ Low 1.00 2 1.08 (0.65 – 1.79) 3 1.17 (0.72 – 1.89) 4 1.06 (0.64 – 1.75) 5 -‐ High 1.00 (0.35 – 2.85)
Nervous feelings 1.00 1.02 (0.65 – 1.60) 1.07 (0.67 – 1.70) 0.68 (0.32 – 1.42) 1.40 (0.68 – 2.89) 1.00 0.87 (0.58 – 1.29) 0.87 (0.54 – 1.39) 0.75 (0.38 – 1.48) 0.49 (0.21 – 1.15)
Table 9 outlines the regression model of mental illness symptoms and the all greenspace measure derived from impervious surfaces within a 0-‐500 metre and 500-‐2000 metre buffer. This greenspace measure was statistically insignificant predictor of depressive symptoms. Nervous feelings were significantly correlated with the greenspace measure overall, but became insignificant when analysed separately by quintile (Table 9). The statistically insignificant trend throughout these quintiles was consistent with the statistically significant result for greenspace overall
33
(with greenspace quintiles collapsed). The only statistically significant results for nervous feelings and all greenspace were found in the quintile for the highest proportion of greenspace. Individuals in the highest quintile for greenspace within the 0-‐500 metre buffer were 1.62 times more likely to have experienced nervous feelings in the past four weeks than those in the lowest quintile; inversely those in the highest quintile for greenspace within the 500-‐2000 metre buffer had only 0.55 time the odds of experiencing nervous feelings than those in the lowest quintile. Although no other quintiles reported a statistically significant result and thus are inconclusive, it is worthwhile to note that the insignificant quintiles suggested a relationship consistent with the significant quintiles -‐ a high proportion of greenspace within the 0-‐500 metre buffer is associated with higher prevalence of nervous feelings, but a high proportion within the 0-‐2000 metre buffer is associated with a lower prevalence of nervous feelings. Prior doctor diagnosis remained a significant and strong predictor of current mental illness symptoms. Table 9: -‐ Logistic regression of the relationship between mental illness symptoms (dependent variable) and all greenspaces (derived from impervious surfaces), controlling for doctor diagnosis. Results are given as odds ratios (95% confidence intervals) relative to the reference category (odds ratio=1.00).
Depressive feelings Nervous feelings Proportion of all greenspace (from impervious surfaces) within 0-‐500m buffer 1 -‐ Low 1.00 1.00 2 1.64 (1.00 – 2.67) 1.37 (0.83 – 2.25) 3 1.49 (0.81 – 2.73) 0.92 (0.57 – 1.48) 4 1.57 (0.90 – 2.75) 1.01 (0.57 – 1.80) 5 -‐ High 1.34 (0.74 – 2.46) 1.62 (1.04 – 2.55) Proportion of all greenspace (from impervious surfaces) within 500-‐2000m buffer 1 -‐ Low 1.00 1.00 2 0.99 (0.50 – 1.95) 0.80 (0.50 – 1.29) 3 0.60 (0.35 – 1.05) 0.51 (0.30 – 0.88) 4 0.79 (0.49 – 1.29) 0.75 (0.45 – 1.25) 5 -‐ High 0.71 (0.42 – 1.22) 0.55 (0.32 – 0.94) As the study focused on short term health indicators, regression analysis with doctor diagnosed depression and anxiety disorders was beyond the research questions. However, this analysis was conducted to compare the short-‐term indicators with
34
Nicholas Brunsdon doctor diagnosis and to validate the study relative to existing works that tend to use doctor diagnosed depression. Models of usable greenspace, all public greenspaces and all greenspaces are applied to doctor diagnosed depression and anxiety disorder in Table A1 in Appendix A. In these models, sex was a significant predictor of mental illness, and the insignificance of greenspace measures in predicting mental illness was replicated.
35
6. Discussion 6.1 Greenspace Indicators The three different measures of neighbourhood greenspace overlapped each other by definition. Because of this, it was important to understand the relationship between these indicators before comparing their relationship with health indicators. A degree of correlation is expected due to the definitional overlap, however too strong a correlation would suggest that indicators are too similar and thus not adding value. This was especially important for the different buffer areas, as these were analysed together in the same regression model, and a strong correlation between variables (multicolinearity) can distort the estimation of odds ratios. The correlation matrix (Table 3) describes these relationships, none of which were particularly strong, thus the problem of multicolinearity could be discounted. Usable greenspace is a derived from all public greenspace, which is a subset of all greenspace, with lower values representing lower travel times, better access, and therefore more greenspace. Accordingly there was a weak correlation between usable greenspace and all public greenspaces within 0-‐500 metre buffer (0.3477), and an even weaker in the 500-‐2000 metre buffer (0.1852), reflecting that as the usable greenspace measure is based on the nearest five usable public greenspaces, and these are more likely to be located within the area of the 0-‐500 metre buffer rather than the 500-‐2000 metre buffer. Similarly, the impervious surfaces measure will include both private greenspace and the public greenspace areas included in the public greenspace measure, thus impervious surfaces and greenspace are strongly related: 0.5890 in the 0-‐500 metre buffer and 0.5453 in the 500-‐2000 metre buffer. The fact that the correlation is not perfect affirms that the impervious surfaces layer is measuring the distribution of not just public greenspace, but also private gardens not captured by the traditional public greenspace measure. Conjoining neighbourhoods are likely share similar characteristics, and thus the 0-‐500 metre and 500-‐2000 metre buffers, while measuring distinct areas, are strongly correlated reflecting the similarity of adjacent areas. This is shown in the correlation of 0.4720 between the public greenspace buffers and 0.6259 in the impervious surface buffers.
36
Nicholas Brunsdon
6.2 Socioeconomic Deprivation The correlation between neighbourhood greenspace measures and SED can provide an insight to the environmental justice implications for greenspace, as an unequal distribution of greenspace could contribute towards health inequalities. However, in this case the correlations were weak and or statistically insignificant, and thus no inferences can be made about the access or exposure of greenspace relative to socioeconomic status. Universally high access to greenspace in New Zealand (Witten et al., 2008) may serve to obfuscate this relationship, however Field, Witten, Robinson, & Pledger (2004) did note higher access to community facilities in more deprived neighbourhoods in the North Shore and Waitakere areas of Auckland City. The socioeconomic gradient of greenspace exposure could be analysed further by a measure of greenspace quality, and measuring how this varies in relation to neighbourhood SED.
6.3 Physical Activity A key premise of this study was the use of short-‐term health indicators as an alternative to the prevailing use of longer term indicators, with time spent undertaking physical activity as a short term measure of physical health. Regression models including age or sex provided results consistent with prior studies, indicating that physical activity levels are highest amongst males and young age groups (Trost et al., 2002). Statistically significant lower levels of physical activity by individuals residing in socioeconomically deprived areas are also consistent with prior studies, however with no socioeconomic gradient for greenspace access, it is difficult to explain (Giles-‐Corti & Donovan, 2002). Contextual differences in physical activity may warrant future investigation, perhaps incorporating the distribution of a broader range of physical activity facilities than greenspace generally, such as gyms. The relationship between usable greenspace and physical activity was insignificant and indeterminate for brisk walking, moderate and all physical activity; however a significant and strong relationship between usable greenspace and vigorous physical
37
activity is difficult to reconcile. It is difficult to assess the utility of physical activity as a short term physical health from these results, given that its insignificance with usable greenspace is consistent with existing studies in New Zealand regressing long term physical health (e.g. cardiovascular disease) with greenspace. Future studies could investigate the use of physical activity further, potentially relating it to self-‐ reported health status or against long-‐term physical health measures.
6.4 Mental Health The use of short term mental health measures as opposed to formally diagnosed mental health disorders was a key premise of this study, and doctor diagnosed mental disorders were used as a control variable taking into account the persistence of mental illnesses (Mann, 2005). It was expected that prior diagnosis would increase the odds of experiencing mental disorder symptoms, and this was affirmed with prior doctor diagnosis of depression and anxiety disorders as a significant and strong explanatory variable in all models of depressive and nervous feelings respectively. The correlation for depression was much stronger than with nervous feelings, reflecting that nervous feelings are only a component of the suite of anxiety disorders. For completeness and comparison with existing studies that use clinical mental illness instead of short term indicators, Table A1 in Appendix A indicates that the greenspace indicators derived in this study are also generally poor indicators of clinical depression and anxiety disorders. Some established demographic trends were replicated, with a statistically significant higher prevalence of depressive symptoms amongst those in residing in more deprived neighbourhoods (Kling et al., 2007; Lofors et al., 2006; Mair et al., 2008; Stafford & Marmot, 2003), and amongst women (Mirowsky, 1996). Anxiety disorders tend not to have discernable aged trends due to the heterogeneous group of sub-‐conditions (Anthony & Stein, 2008; Crawford & Henry, 2003). However, a clear trend of lower prevalence of nervous feelings amongst older age groups was found, reflecting that nervous feelings are a specific sub-‐condition of anxiety disorders and may have a more distinct demographic trend than the group as a whole. None of the greenspace measures had a significant explanatory power for the prevalence of depressive symptoms, with 38
Nicholas Brunsdon prior diagnosis for depression controlled for. This result is consistent with existing studies of public greenspace and depression in New Zealand, and the replication of this with the more inclusive greenspace measure derived from impervious surfaces provides further evidence that there may be no connection in the New Zealand context (Richardson et al., 2013; Richardson et al., 2010; Witten et al., 2008). It had been expected that usable greenspace would explain variations in not only exercise levels, but depressive symptoms, as physical activity is established as an effective treatment for depression (Babyak et al., 2000), however both were insignificant.
6.5 Future Research The usable greenspace and all public greenspace measures had no significant explanatory power for the prevalence of nervous feelings. The measure of all greenspace derived from impervious surfaces had a significant explanatory power for the prevalence of nervous feelings, however with in opposite directions for the two buffer areas. This suggested that greater areas of greenspace within 500 metres of an individual’s meshblock reduced their odds of experiencing nervous feelings, but greenspace within 500-‐2000 metres increased these odds. It is difficult to reconcile the implications of this for mental health, and this points towards the need for comprehensive sensitivity analysis of the buffer size, as the relationship is clearly sensitive to the size of the buffer. This is a significant area warranting further investigation, both for the impervious surfaces measure and the traditional public greenspace measure. Existing studies have used buffer sizes ranging from 500 metres to 3000 metres, so finer analysis within and even beyond these bounds may be insightful. This simple proximity-‐based analysis does not take into consideration the visualisation of greenspace and the influence of terrain and the built environment upon it, so developments in the field of visualisation may prove useful. A unique characteristic of the New Zealand urban environment is the ubiquity of bluespace, however no research has quantified the salutogenic contribution of bluespace in New Zealand to date (Richardson et al., 2010); investigation of the association between health and the visualisation of greenspace and bluespace may prove worthwhile. The health benefits of private gardens have been established 39
qualitatively (Stigsdotter & Grahn, 2004; Unruh, 2002), thus further development of greenspace measures including public and private greenspace separately is warranted. The impervious surfaces method could be developed further with the addition of residential property data to enable identification of the subset of all greenspaces that are private gardens, and thus build a quantitative understanding of the health benefits associated with private gardens. The usable greenspace measure was based primarily on the access and size of greenspaces, rather than quality or facilities present. There is potential for a more comprehensive usable greenspace indicator, weighted for the quality and quantity of exercise facilities including both indoor and outdoor sporting facilities, and may provide for a greater understanding for the influence of accessibility of greenspace and exercise facilities more generally on physical activity levels. The social interaction pathway between greenspace and mental health could be informed similarly through weighting of greenspace by patronage. Linear features such as waterfronts, beaches and walkways and cycleways are poorly captured in analysis focused on greenspace as an area, so these areas may form an important role in the exercise facility accessibility relationship. A similar study by (Field et al., 2004) analysed the distribution of such facilities and community facilities more broadly, but this distribution had not been related to utilisation or physical activity levels to date. Established size thresholds for greenspaces to be considered usable are based on the requirements of adults, however children may be able undertake vigorous physical activity in far smaller areas; future studies could incorporate the physical activity levels of children in relation to a smaller threshold for usable greenspace.
6.6 Theoretical Pathways With few statistically significant results, no conclusions can be drawn for the theoretical pathways identified earlier. Correlations between mental illness symptoms and usable greenspace could have validated the physical activity and social interaction pathway in relation to mental health. The physical activity pathway could have been validated in terms of physical health through a correlation of usable 40
Nicholas Brunsdon greenspace and physical activity. The therapeutic landscape pathway could have been validated through the correlation of mental illness symptoms and public greenspace; similarly a correlation between mental illness symptoms and all greenspace but not all public greenspace could suggest the importance of private gardens. As above, further investigation is needed to establish these pathways in the New Zealand context.
41
7. Conclusion This study found no widespread conclusive evidence of greenspace exposure or accessibility influencing short-‐term physical activity or mental health indicators. The significance of impervious surfaces as an indicator for private greenspace, and its significant relationship with nervous feelings suggests promise for future studies of private gardens, although no conclusions can be drawn from these results. Conflicting relationships from greenspace in adjacent buffer areas calls for further sensitivity analysis of buffer size and its influence on the greenspace and health relationship. Neighbourhood accessibility to usable greenspace was found to be a significant determinant of vigorous physical activity, however no relationship was found for other forms of physical activity and thus no wider conclusions can be drawn. The application of coarse greenspace measures has not been successful in the New Zealand context; further refinement and development of more detailed greenspace measures reflecting visualisation and quality may provide useful insight into contribution of greenspace to health locally and internationally. The contribution of bluespace on health has not been assessed locally, however this would be readily achieved through an adaption of greenspace methods.
42
Nicholas Brunsdon
Acknowledgements Special thanks are due to my supervisor Professor Simon Kingham and associates in the GeoHealth laboratory -‐ Chris Bowie, Edward Griffin, Niamh Donnellan and Daniel Nutsford -‐ for their support throughout this project, from inception to completion. I’m looking forward to working with you all again in 2014. I also wish to thank my GEOG420 colleagues for their support and positivity throughout the year, and I wish them all the best in their promising futures.
43
References American Planning Association, & National Association of County & City Health Officials. (2013). Public health terms for planners and planning terms for public health professionals. Washington, D.C: Centers for Disease Control and Prevention. Anthony, M., & Stein, M. (2008). Oxford Handbook of Anxiety and Related Disorders. Oxford University Press. Antonovsky, A. (1979). Health, stress, and coping. Jossey-‐Bass. Babyak, M., Blumenthal, J. A., Herman, S., Khatri, P., Doraiswamy, M., Moore, K., … Krishnan, K. R. (2000). Exercise Treatment for Major Depression: Maintenance of Therapeutic Benefit at 10 Months. Psychosomatic Medicine, 62(5), 633–638. Barbosa, O., Tratalos, J. A., Armsworth, P. R., Davies, R. G., Fuller, R. A., Johnson, P., & Gaston, K. J. (2007). Who benefits from access to green space? A case study from Sheffield, UK. Landscape and Urban Planning, 83(2), 187–195. Comber, A., Brunsdon, C., & Green, E. (2008). Using a GIS-‐based network analysis to determine urban greenspace accessibility for different ethnic and religious groups. Landscape and Urban Planning, 86(1), 103–114. doi:10.1016/j.landurbplan.2008.01.002 Coombes, E., Jones, A. P., & Hillsdon, M. (2010). The relationship of physical activity and overweight to objectively measured green space accessibility and use. Social Science & Medicine, 70(6), 816–822. doi:10.1016/j.socscimed.2009.11.020 44
Nicholas Brunsdon Craig, C., Russell, S. J., Cameron, C., & Bauman, A. (2003). Twenty-‐year trends in physical activity among Canadian adults. Canadian journal of public health = Revue canadienne de sante publique, 95(1), 59–63. Crawford, J. R., & Henry, J. D. (2003). The Depression Anxiety Stress Scales (DASS): Normative data and latent structure in a large non-‐clinical sample. British Journal of Clinical Psychology, 42(2), 111–131. doi:10.1348/014466503321903544 Dadvand, P., de Nazelle, A., Figueras, F., Basagaña, X., Su, J., Amoly, E., … Nieuwenhuijsen, M. J. (2012). Green space, health inequality and pregnancy. Environment International, 40, 110–115. doi:10.1016/j.envint.2011.07.004 Dillen, S. M. E. van, Vries, S. de, Groenewegen, P. P., & Spreeuwenberg, P. (2012). Greenspace in urban neighbourhoods and residents’ health: adding quality to quantity. Journal of Epidemiology and Community Health, 66(6), e8–e8. doi:10.1136/jech.2009.104695 Field, A., Witten, K., Robinson, E., & Pledger, M. (2004). Who gets to what? Access to community resources in two New Zealand cities. Urban Policy and Research, 22(2), 189–205. doi:10.1080/0811114042000229645 Giles-‐Corti, B., & Donovan, R. J. (2002). Socioeconomic Status Differences in Recreational Physical Activity Levels and Real and Perceived Access to a Supportive Physical Environment. Preventive Medicine, 35(6), 601–611. doi:10.1006/pmed.2002.1115 Gove, W. R., & Geerken, M. R. (1977). Response Bias in Surveys of Mental Health: An Empirical Investigation. American Journal of Sociology, 82(6), 1289–1317. doi:10.2307/2777936
45
Hartig, T., Berg, A. E. van den, Hagerhall, C. M., Tomalak, M., Bauer, N., Hansmann, R., … Waaseth, G. (2011). Health Benefits of Nature Experience: Psychological, Social and Cultural Processes. In K. Nilsson, M. Sangster, C. Gallis, T. Hartig, S. de Vries, K. Seeland, & J. Schipperijn (Eds.), Forests, Trees and Human Health (pp. 127–168). Springer Netherlands. Retrieved from http://link.springer.com.ezproxy.canterbury.ac.nz/chapter/10.1007/978-‐90-‐ 481-‐9806-‐1_5 Kerr, J., Frank, L., Sallis, J. F., & Chapman, J. (2007). Urban form correlates of pedestrian travel in youth: Differences by gender, race-‐ethnicity and household attributes. Transportation Research Part D: Transport and Environment, 12(3), 177–182. doi:10.1016/j.trd.2007.01.006 Kling, J. R., Liebman, J. B., & Katz, L. F. (2007). Experimental Analysis of Neighborhood Effects. Econometrica, 75(1), 83–119. doi:10.1111/j.1468-‐ 0262.2007.00733.x Lachowycz, K., & Jones, A. P. (2011). Greenspace and obesity: a systematic review of the evidence. Obesity Reviews, 12(5), e183–e189. doi:10.1111/j.1467-‐ 789X.2010.00827.x Lee, A. C. K., & Maheswaran, R. (2011). The health benefits of urban green spaces: a review of the evidence. Journal of Public Health, 33(2), 212–222. doi:10.1093/pubmed/fdq068 Lofors, J., Ramírez-‐León, V., & Sundquist, K. (2006). Neighbourhood income and anxiety: a study based on random samples of the Swedish population. The European Journal of Public Health, 16(6), 633–639. doi:10.1093/eurpub/ckl026
46
Nicholas Brunsdon Loram, A., Tratalos, J., Warren, P. H., & Gaston, K. J. (2007). Urban domestic gardens (X): the extent & structure of the resource in five major cities. Landscape Ecology, 22(4), 601–615. doi:10.1007/s10980-‐006-‐9051-‐9 Maas, J., van Dillen, S. M. E., Verheij, R. A., & Groenewegen, P. P. (2009). Social contacts as a possible mechanism behind the relation between green space and health. Health & Place, 15(2), 586–595. doi:10.1016/j.healthplace.2008.09.006 Macintyre, S., Maciver, S., & Sooman, A. (1993). Area, Class and Health: Should we be Focusing on Places or People? Journal of Social Policy, 22(02), 213–234. doi:10.1017/S0047279400019310 Mair, C., Roux, A. V. D., & Galea, S. (2008). Are neighbourhood characteristics associated with depressive symptoms? A review of evidence. Journal of Epidemiology and Community Health, 62(11), 940–946. doi:10.1136/jech.2007.066605 Mann, J. J. (2005). The Medical Management of Depression. New England Journal of Medicine, 353(17), 1819–1834. doi:10.1056/NEJMra050730 Mathieu, R., Freeman, C., & Aryal, J. (2007). Mapping private gardens in urban areas using object-‐oriented techniques and very high-‐resolution satellite imagery. Landscape and Urban Planning, 81(3), 179–192. doi:10.1016/j.landurbplan.2006.11.009 Mayor, K., Lyons, S., Duffy, D., & Tol, R. S. J. (2009). A hedonic analysis of the value of parks and green spaces in the Dublin area (No. 331). ESRI working paper. Retrieved from http://www.econstor.eu/handle/10419/50078
47
Ministry of Health. (2012). New Zealand health survey methodology report 2012. Wellington, N.Z.: Ministry of Health. Retrieved from https://www.health.govt.nz/system/files/documents/publications/new-‐ zealand-‐health-‐survey-‐methodology-‐report.pdf Mirowsky, J. (1996). Age and the Gender Gap in Depression. Journal of Health and Social Behavior, 37(4), 362–380. doi:10.2307/2137263 Natural England. (2009). Our Natural Health Service The role of the natural environment in maintaining healthy lives. Natural England. O’Connor, P. J., Raglin, J. S., & Martinsen, E. W. (2000). Physical activity, anxiety and anxiety disorders. International Journal of Sport Psychology, 31(2), 136–155. Pate, R. R., Colabianchi, N., Porter, D., Almeida, M. J., Lobelo, F., & Dowda, M. (2008). Physical Activity and Neighborhood Resources in High School Girls. American Journal of Preventive Medicine, 34(5), 413–419. doi:10.1016/j.amepre.2007.12.026 Pearce, J., Witten, K., & Bartie, P. (2006). Neighbourhoods and health: a GIS approach to measuring community resource accessibility. Journal of Epidemiology and Community Health, 60(5), 389–395. doi:10.1136/jech.2005.043281 Richardson, E., Mitchell, R., Hartig, T., Vries, S., Astell-‐Burt, T., & Frumkin, H. (2012). Green cities and health: a question of scale? Journal of Epidemiology and Community Health, 66(2), 160–165. doi:10.1136/jech.2011.137240 Richardson, E., Pearce, J., Mitchell, R., Day, P., & Kingham, S. (2010). The association between green space and cause-‐specific mortality in urban New Zealand: an
48
Nicholas Brunsdon ecological analysis of green space utility. BMC Public Health, 10(1), 240. doi:10.1186/1471-‐2458-‐10-‐240 Richardson, E., Pearce, J., Mitchell, R., & Kingham, S. (2013). Role of physical activity in the relationship between urban green space and health. Public health, 127(4), 318–324. doi:10.1016/j.puhe.2013.01.004 Salmond, C. E., Crampton, P. R., & Atkinson, J. (2007). NZDep2006 Index of Deprivation User’s Manual. Wellington: Department of Public Health University of Otago Wellington. Schipperijn, J., Stigsdotter, U. K., Randrup, T. B., & Troelsen, J. (2010). Influences on the use of urban green space – A case study in Odense, Denmark. Urban Forestry & Urban Greening, 9(1), 25–32. doi:10.1016/j.ufug.2009.09.002 Solomon, A., Haaga, D., & Arnow, B. (2001). Is Clinical Depression Distinct from Subthreshold Depressive Symptoms? A Review of the Continuity Issue in Depression Research. The Journal of Nervous and Mental Disease, 189(8). Retrieved from http://journals.lww.com/jonmd/Fulltext/2001/08000/Is_Clinical_Depression _Distinct_from_Subthreshold.2.aspx Spitzer, R., Kroenke, K., & Williams, J. (1999). Validation and utility of a self-‐report version of prime-‐md: The phq primary care study. JAMA, 282(18), 1737– 1744. doi:10.1001/jama.282.18.1737 Stafford, M., & Marmot, M. (2003). Neighbourhood deprivation and health: does it affect us all equally? International Journal of Epidemiology, 32(3), 357–366. doi:10.1093/ije/dyg084
49
Statistics New Zealand. (2013). Geographic hierarchy. Retrieved September 4, 2013, from http://www.stats.govt.nz/surveys_and_methods/methods/classifications-‐ and-‐standards/geographic-‐hierarchy.aspx Stigsdotter, U. A., & Grahn, P. (2004). A garden at your doorstep may reduce stress – Private gardens as restorative environments in the city. In International Conference on Inclusive Environments “Open space: people space”. Edinburgh (Scotland) (pp. 27–29). Retrieved from http://friskinaturen.org/media/terapihaven_a_garden_at_your_doorstep.pdf Stubbs, M. (2008). Natural green space and planning policy: devising a model for its delivery in regional spatial strategies. Landscape research, 33(1), 119–139. Trost, S. G., Owen, N., Bauman, A. E., Sallis, J. F., & Brown, W. (2002). Correlates of adults’ participation in physical activity: review and update. Medicine & Science in Sports & Exercise, 34(12), 1996–2001. doi:10.1097/00005768-‐ 200212000-‐00020 Ulrich, R. S. (1984). View through a Window May Influence Recovery from Surgery. Science, 224(4647), 420–421. doi:10.2307/1692984 Unruh, A. M. (2002). The meaning of gardens and gardening in daily life: a comparison between gardeners with serious health problems and healthy participants. In XXVI International Horticultural Congress: Expanding Roles for Horticulture in Improving Human Well-‐Being and Life Quality 639 (pp. 67–73). Retrieved from http://www.actahort.org/books/639/639_7.htm Villeneuve, P. J., Jerrett, M., G. Su, J., Burnett, R. T., Chen, H., Wheeler, A. J., & Goldberg, M. S. (2012). A cohort study relating urban green space with
50
Nicholas Brunsdon mortality in Ontario, Canada. Environmental Research, 115, 51–58. doi:10.1016/j.envres.2012.03.003 Vries, S. de, Claßen, T., Eigenheer-‐Hug, S.-‐M., Korpela, K., Maas, J., Mitchell, R., & Schantz, P. (2011). Contributions of Natural Environments to Physical Activity. In K. Nilsson, M. Sangster, C. Gallis, T. Hartig, S. de Vries, K. Seeland, & J. Schipperijn (Eds.), Forests, Trees and Human Health (pp. 205–243). Springer Netherlands. Retrieved from http://link.springer.com.ezproxy.canterbury.ac.nz/chapter/10.1007/978-‐90-‐ 481-‐9806-‐1_8 Vries, S. de, Dillen, S. M. van, Groenewegen, P. P., & Spreeuwenberg, P. (2013). Streetscape greenery and health: Stress, social cohesion and physical activity as mediators. Social Science & Medicine, 94, 26. Vries, S. de, Verheij, R. A., Groenewegen, P. P., & Spreeuwenberg, P. (2003). Natural environments -‐-‐ healthy environments? An exploratory analysis of the relationship between greenspace and health. Environment and Planning A, 35(10), 1717 – 1731. doi:10.1068/a35111 Weissman, M., Sholomskas, D., Pottenger, M., Prusoff, B., & Locke, B. (1977). Assessing depressive symptoms in five psychiatric populations: A validation study. American Journal of Epidemiology, 106(3), 203–214. Wendel-‐Vos, W., Droomers, M., Kremers, S., Brug, J., & Van Lenthe, F. (2007). Potential environmental determinants of physical activity in adults: a systematic review. Obesity Reviews, 8(5), 425–440. doi:10.1111/j.1467-‐ 789X.2007.00370.x
51
Witten, K., Hiscock, R., Pearce, J., & Blakely, T. (2008). Neighbourhood access to open spaces and the physical activity of residents: A national study. Preventive Medicine, 47(3), 299–303. doi:10.1016/j.ypmed.2008.04.010 World Health Organization, World Heart Federation, & World Stroke Organization. (2011). Global atlas on cardiovascular disease prevention and control. Geneva: World Health Organization in collaboration with the World Heart Federation and the World Stroke Organization. Zhou, X., & Rana, M. M. P. (2012). Social benefits of urban green space: A conceptual framework of valuation and accessibility measurements. Management of Environmental Quality: An International Journal, 23(2), 173–189. doi:10.1108/14777831211204921 Zimmerman, F. J., & Katon, W. (2005). Socioeconomic status, depression disparities, and financial strain: what lies behind the income-‐depression relationship? Health Economics, 14(12), 1197–1215. doi:10.1002/hec.1011
52
Nicholas Brunsdon
Appendix A Table A1: -‐ Logistic regression of the relationship between prior doctor diagnosis for mental illness (dependent variable) and individual and area level variables, each considered separately. Results are given as odds ratios (95% confidence intervals) relative to the reference category (odds ratio=1.0).
Depression Anxiety disorders Age 15 – 24 1.00 1.00 25 – 34 3.96 (1.93 – 8.14) 4.63 (1.90 – 11.26) 35 – 44 4.71 (2.40 – 9.25) 4.24 (1.63 – 11.07) 45 – 54 5.31 (2.63 – 10.71) 2.28 (0.83 – 6.25) 55 – 64 5.51 (2.74 – 11.11) 2.25 (0.73 – 6.97) Over 65 4.46 (2.30 – 8.67) 1.94 (0.68 – 5.53) Sex Female 1.00 1.00 Male 0.54 (0.41 – 0.70) 0.76 (0.46 – 1.26) NZ index of deprivation 1 – Least deprived 1.00 1.00 2 1.23 (0.76 – 1.99) 1.67 (0.77 – 3.65) 3 0.79 (0.38 – 1.64) 1.15 (0.54 – 2.44) 4 0.88 (0.51 – 1.52) 0.79 (0.33 – 1.89) 5 – Most deprived 0.80 (0.45 – 1.42) 0.88 (0.35 – 2.26) Usable greenspace accessibility 1 – Low 1.00 1.00 2 0.73 (0.35 – 1.53) 0.89 (0.29 – 2.74) 3 0.57 (0.30 – 1.06) 0.81 (0.27 – 2.44) 4 0.75 (0.40 – 1.40) 0.98 (0.38 – 2.56) 5 -‐ High 0.47 (0.24 – 0.91) 0.51 (0.16 – 1.66) Proportion of all public greenspace within 0-‐500m buffer 1 – Low 1.00 1.00 2 0.90 (0.55 – 1.46) 0.60 (0.29 – 1.26) 3 0.85 (0.55 – 1.31) 0.58 (0.33 – 1.02) 4 0.98 (0.46 – 2.08) 0.46 (0.23 – 0.91) 5 – High 1.53 (0.92 – 2.55) 0.96 (0.39 – 2.38) Proportion of all public greenspace within 500-‐2000m buffer 1 – Low 1.00 1.00 2 0.88 (0.55 – 1.41) 0.54 (0.29 – 1.02) 3 1.03 (0.46 – 2.33) 0.65 (0.23 – 1.83) 4 0.60 (0.27 – 1.30) 0.64 (0.23 – 1.77) 5 – High 1.40 (0.75 – 2.61) 1.48 (0.70 – 3.12)
53
Table A1 (cont.)
Depression Anxiety disorders Proportion of all greenspace (from impervious surfaces) within 0-‐500m buffer 1 – Low 1.00 1.00 2 0.92 (0.50 – 1.71) 0.88 (0.49 – 1.57) 3 0.73 (0.38 – 1.38) 0.47 (0.22 – 0.97) 4 0.70 (0.38 – 1.29) 0.39 (0.16 – 1.00) 5 – High 1.35 (0.72 – 2.53) 1.05 (0.55 – 2.01) Proportion of all greenspace (from impervious surfaces) within 500-‐2000m buffer 1 – Low 1.00 1.00 2 0.79 (0.45 – 1.38) 0.60 (0.29 – 1.25) 3 0.72 (0.39 – 1.33) 0.34 (0.14 – 0.80) 4 0.66 (0.38 – 1.15) 0.64 (0.32 – 1.28) 5 – High 1.35 (0.74 – 2.47) 1.10 (0.54 – 2.12)
54