The Incremental Reach and Cost Efficiency of Online Video Ads over TV Ads Yuxue Jin, Sheethal Shobowale, Jim Koehler, Harry Case Google Inc.
Abstract As people spend more time online, an increasing number of brand marketers are including video ads in their advertising campaigns. These advertisers would like to know the incremental reach and cost efficiency of their video and display ads compared to their TV ads. In this paper, we measure the incremental reach to a target demographic and estimate the cost per incremental reach point of YouTube (YT) and the Google Display Network (GDN) compared to TV ad campaigns. We consider two media planning scenarios: what it would have cost for the TV ad campaign to have delivered the equivalent of the online incremental reach, and what saving could have been achieved by having spent less on TV ads and complementing them with online ads for a given reach goal.
1
Introduction
In recent years digital media has transformed the world and presented brand marketers with unique opportunities to connect with their consumers in new and innovative ways. As such, marketers are often faced with the question of whether they should complement their TV campaign with online ads and whether a cross-media campaign would be more cost-efficient for reaching their target audience. Viewership data helps us understand the importance of including online video in these campaigns. TV remains the dominant medium, but online media is growing fast. According to Nielsen, in Q2 2011, 48% of Americans now watch video online and the average time spent watching video online increased 14.7% compared to a year ago [1]. TV ads can reach a large portion of the population, but certain segments of the population are difficult to reach. Google and Nielsen found that consumers in the lightest TV quintile1 watched an average of 38 minutes of TV per day, accounting for only 3% of the total TV watching time [2]. The lightest TV quintile is a very valuable demographic for many advertisers. We found that the lightest TV viewer is more likely to be younger, wealthier, and more educated. These viewers spend 58% more time watching video online than the general population [1]. This may explain the growth in online video ad spend. eMarketer reported video ad spend in the US has increased 43%, from $1.4 billions in 2010 to $2.0 billions in 2011, while ad spend on TV remained constant at $60 billion [3, 4]. 1
The TV quintiles are defined by grouping people (aged 2 and older) who watch TV into five equally-sized segments, according to the amount of TV watched per day. This definition is different from what is used in our case studies. See Section 2.1 for more details.
1
2
METHODOLOGY
As a result, we hypothesize that online video ads provide additional reach beyond a TV campaign and are more efficient than TV for reaching the lightest TV viewers. The incremental reach of online video ads can be measured directly from a cross-media data set, but established methods do not exist for evaluating the cost efficiency of that reach. In this paper, we propose statistical methods to answer the following media planning questions after a cross-media campaign was executed: 1. How much additional TV budget would have been required to attain the equivalent reach of the cross-media campaign? 2. How much would it have cost if the TV budget had been reduced so the cross-media campaign achieved the reach of the TV campaign? In Section 2, we describe the statistical methods for answering these questions. In Section 3, we provide three case studies to illustrate the methods. In Section 4, we discuss how the analysis can be improved with more detailed data.
2
Methodology
2.1
Overview
Questions 1 and 2 differ by the reach that the advertiser is trying to achieve. In question 1, the advertiser aims at getting the reach of the cross-media campaign, which is beyong the TV reach curve. We use an extrapolation method to estimate the cost of a TV campaign that would have delivered the equivalent reach of the cross-media campaign. In question 2, the advertiser aims at getting the reach of the TV campaign, which is the tail of the reach curve. We use an interpolation method to estimate the cost of a cross-media campaign that would deliver the equivalent reach of the TV campaign. To answer question 1 with the extraplation method, we estimate the incremental TV GRPs2 needed to attain the cross-media campaign reach by fitting a nonlinear functional form to the cumulative reach curve and extrapolating the fitted curve. The incremental GRPs are then multiplied by the cost per GRP of the TV campaign to estimate the cost of delivering the equivalent incremental reach from online ads. We describe the statistical model used to fit the reach curve and its assumptions in Section 2.2. A naive way to estimate the incremental GRPs is to linearly extrapolate the curve. Since the curve is usually concave, linear extrapolation will underestimate the true incremental GRPs. To answer question 2 with the interpolation method, we go backwards on the reach curve from the tail to find the amount of TV GRPs required to deliver reach points equivalent to the online incremental reach. If the TV budget had been reduced by this amount of TV GRPs, the crossmedia campaign would have delivered at least the reach of the TV campaign. We discuss this method further in Section 2.3. For each campaign, we measure the incremental reach of the online ads to TV ads for the target audiences and determine the breakdown by TV viewing quintiles. Since the target demographics of our case studies include only people between age 18 and 49, we split this group into five equallysized quintiles according to the amount of TV watched. We measure reach for 1+, 3+, and 5+ 2
GRP is short for Gross Rating Point. It is often used interchangeably with Target Rating Point (TRP). In this paper, GRPs are calculated as the number of impressions delivered to the target divided by the number of people in the target, multiplied by 100.
2
Google Inc.
2
METHODOLOGY
2.2
Extrapolation Method
frequency of exposures. The extrapolation method is applied to 1+ reach, but as explained in Section 2.2.2, should not be applied to 3+ or 5+ reach in our case studies because these reach curves are very flat. On the other hand, the interpolation method is applied to both 1+ reach and 3+, 5+ reach.
2.2 2.2.1
Extrapolation Method Statistical Model to Fit the Reach Curve
Here we describe the statistical model used to fit a nonlinear functional form to the cumulative TV reach curves. The nonlinear functional form we use is R=a−
b , G + b/a
(1)
where R denotes reach, G denotes GRP, a and b are two parameters estimated from the reach curve and may vary depending on the campaign and the minimum frequency at which reach is measured. This functional form guarantees that zero GRP corresponds to zero reach, and for positive b reach is increasing in GRP. a is the limit of the reach curve, which is the theoretical reach of the TV plan if an infinite amount of GRPs are bought. The parameters of the functional form are estimated with nonlinear regression, by minimizing the sum of squared errors of the fitted curve from the actual curve. To minimize the error in predicting GRPs given reach, we use GRP as the dependent variable in the regression model and re-express GRP as a function of reach, bR G= . (2) a(a − R) To achieve the same reach attained by a combination of TV and online ads with a TV-only plan, we need to increase TV GRPs by δ=
bRc bRt − , a(a − Rc ) a(a − Rt )
(3)
where Rc is the combined reach of TV and online, and Rt is the TV total reach. Once we obtain estimates of a and b, denoted with a ˆ and ˆb, we can plug them into (3) to get an estimate of δ, ˆ denoted with δ. The confidence interval of δˆ depends on the randomness of a ˆ and ˆb. In linear regression models, due to the linear structure, the estimated coefficients can always be approximated with normal distribution after applying the Central Limit Theorem. This general rule of thumb, however, cannot be readily applied to our model because of nonlinearity. Clarke [7] proposed a profile likelihood method to calculate the confidence interval of estimated coefficients in nonlinear regression. This method does not assume the estimates are normally distributed. On the other hand, the usual method to derive the confidence interval, Wald’s method (see [6]), requires that the estimates are normally distributed. Comparing the confidence interval from the profile likelihood method with that from Wald’s method gives us an idea how close the distribution of the estimates is to normal distribution. In both our case studies and simulated examples, the confidence intervals from the two methods are almost the same. This shows that the distribution of a ˆ and ˆb can be approximated with normal distribution. Google Inc.
3
2.2
Extrapolation Method
2
METHODOLOGY
ˆ The first approach is through There are two approaches to obtain the confidence interval of δ. re-parametrization using δ and a. The original functional form (2) is re-expressed as G=
δ(a − Rc )(a − Rt ) R . a(Rc − Rt ) a−R
(4)
Detailed derivation of this step can be found in Appendix A. Most statistical software that implements nonlinear regression, such as the R package nls, can conveniently output the confidence interval of the estimated parameters using Wald’s method. This approach takes advantage of this feature and obtains the confidence interval of δˆ directly. The other approach is based on simulations. Using the functional form (2), let Σ denote the covariance matrix of a ˆ and ˆb, the distribution of a ˆ and ˆb can be approximated using bivariate normal distribution with mean (ˆ a, ˆb) and covariance Σ. For each simulated sample from this bivariate normal distribution, we can plug them into (3)to obtain an estimate of δ. The quantiles of ˆ This simulation these simulated values of δˆ are good approximations of the confidence interval of δ. approach usually produces very similar results to the reparametrization approach. Both approaches to obtain the confidence interval depend heavily on the assumption that the residuals are uncorrelated. Suppose there are n data points on the curve, let Gi denotes the ˆ i denotes the model fitted value, the observed GRP for the ith data point, i = 1, . . . , n, and G ˆ residual for the ith data point is ri = Gi − Gi . In most of our case studies, the residuals are highly positively correlated. Usually they are found to follow a lag-1 autoregressive process AR(1), ri = ρri−1 + ui , i = 2, . . . , n, where ρ is the autocorrelation coefficient, and ui , i = 2, . . . , n are independent and identically distributed and have mean zero. Details on AR(1) processes can be found in [8]. We apply a technique from Chapter 12 in [8] to remove the autocorrelation. We define a new set of response variables Zi , i = 2, . . . , n, Zi = Gi − ρGi−1 .
(5)
The original functional form (2), using Zi as the dependent variable, now becomes Zi =
bRi bRi−1 −ρ , i = 2, . . . , n. a(a − Ri ) a(a − Ri−1 )
(6)
a and b are estimated by minimizing the sum of squared errors of the model predicted Zi ’s from the observed Zi ’s. After this adjustment, the residuals are uncorrelated, ˆ i − ρG ˆ i−1 − Gi + ρGi−1 = ri − ρri−1 = ui . rei = Zˆi − Zi ≈ G
(7)
Therefore, we can use either of the two approaches previously described to obtain the confidence ˆ If we use the reparametrization approach, the functional form we fit is interval of δ. δ(a − Rc )(a − Rt ) Zi = a(Rc − Rt )
�
Ri Ri−1 −ρ a − Ri a − Ri−1
� .
(8)
If we use the simulation approach the functional form used is given in (6). 4
Google Inc.
2
METHODOLOGY
2.2.2
2.3
Interpolation Method
Implementation Details and Model Assumption
The cumulative reach curves in our case studies are updated at each TV ad spot. For example, for a two-month long campaign, the curve usually has over a thousand data points. These over-crowded data points are not all needed to get a good fit of the model; instead, they result in highly correlated residuals even after performing the adjustment with Zi ’s. Hence we select some data points that are evenly spaced in terms of GRPs from the curve. The number of data points selected is roughly equal to the number of campaign days. In our implementation, we use the simulation approach to obtain the confidence interval because the reparametrization approach sometimes fails due to the singular Fisher information matrix. We first fit the functional form (2) to GRPs, get the residuals of the fit and estimate the autocorrelation coefficient ρ using AR(1) regression on these residuals. After obtaining an estimate of ρ, we generate a new set of response variables Zi ’s. The functional form in (6) is used to fit these Zi ’s and estimate a and b. The estimated a and b are plugged into (3)to estimate the incremental GRPs. For each case study, we fit the model to the 1+ reach curves of the total target and the lightest TV quintile. The lightest-quintile reach curve consists of reach in the lightest quintile vs GRPs of the entire target demographic. We tested the model on ten case studies in US, although most of the case studies are not reported in this paper due to advertiser confidentiality agreements. This simple functional form with two parameters fits the 1+ reach curves very well in all of our case studies. In our case studies, most of the 3+ and 5+ curves are very flat towards the tail. Although we could still fit these reach curves by introducing a cubic spline term into the functional form (2), details of which can be found in Appendix B, we would rather not extrapolate these flat reach curves. Extrapolating the curve assumes that the TV plan stays the same. An already flattened reach curve suggests that the TV plan has little or no potential to improve reach. If a virtually flat curve is extrapolated to the combined reach, it will take thousands of TV GRPs, compared to a much smaller quantity of GRPs for 1+ reach. With such a huge increase in GRPs, the TV media plan will almost certainly change and the new reach curve will not follow the shape of the original curve. Hence, we do not reccommend using the extrapolation method for flat reach curves.
2.3
Interpolation Method
To estimate the cost of a cross-media campaign that would deliver the equivalent TV-only reach, we want to build the TV and online combined reach curve associated with reducing the TV budget and assuming the online budget stays the same. Based on this curve, we can find the reduced TV budget that corresponds to a combined reach equivalent to the reach of the TV-only campaign. In the case of data per user and per TV ad spot, this curve can be built by calculating the online incremental reach at diffent reduced TV budget or GRPs and adding it to the TV reach curve. Unfortunately we only have aggregated data in our case studies and are not able to perform this analysis. Instead, we assume that the online incremental reach is constant at reduced TV budget and equals the incremental reach to the original TV plan. Adding this constant to the TV reach curve yields an approximation of the combined reach curve. Based on the approximated combined reach curve, anwering question 2 is equivalent to finding the TV budget that corresponds to a TV reach equal to the original TV-only reach minus the online incremental reach. Thus in order for the cross-media campaign to deliver the equivalent TV-only reach, the TV budget should be reduced by the amount of GRPs required to deliver reach points equivalent to the online incremental reach Google Inc.
5
3
CASE STUDIES
at the tail of the TV reach curve. For small to moderate TV budget cut, the approximated combined reach is close to the actual combined reach. Furthermore, for 1+ reach, it is obvious that the incremental reach will either remain the same or increase if the TV budget is reduced; for 3+ and 5+ reach, we have the same findings in our simulated scenarios, although there is no straightforward argument for it. Hence we believe that the approximated combined reach curve and the TV budget cut required are conservative estimates. Unlike the extrapolation method, the interpolation method can be applied to reach curves regardless of whether they have flattened or not. For both the interpolation and the extrapolation methods, the TV reach curves used in our case studies depend on the order in which the ads are aired. When the advertiser reduces or increases TV budget, he may not necessarily cut or buy more of the programs that are aired close to the end of the campaign. Ideally, the TV reach curves used for the two methods should not depend on the order of the ad spots. In the case of data per user and per ad spot, we could permute the order of the programs, generate a new reach curve for each permutation and use the average of these reach curves. Again, we are not able to do this due to limitations in our data; we assume the order effect is small within the same TV plan.
3
Case Studies
3.1
Data Sources
The case studies we present are based on data from the Nielsen National People Meter TV panel and Nielsen Online’s Random Digit Dial/Online panel. The TV panel consists of approximately 17,000 homes reporting TV viewing for each set, person and visitor in the home. The online panel measures home Internet use for 250,000 people at least two years old and work Internet use for 10,000 people 18 and older. These two datasets are fused together to simulate a single source dataset, by matching common characteristics on the respondent level; the details of the fusion methodology can be found in [5]. The TV ad schedule tracked by the Nielsen Monitor-Plus3 service is compared with agency data to confirm that all advertisement buys were taken into consideration. For the online campaign data, we use Nielsen pixels and visitation to the YouTube homepage to track online ad exposure. The cost of TV campaigns is based on data from Nielsen Monitor-Plus, while the cost of online campaigns is pulled from the YouTube and GDN databases.
3.2
Case Study I: Campaign of A Large Automobile Company
This campaign, run by a large automobile company on TV and YT/GDN, targeted adults 30 to 39 years old. Due to the large size of the TV campaign, which consisted of 1441 GRPs, YT/GDN’s incremental reach is very small. We apply both the extrapolation and the interpolation methods and provide two metrics for each method to compare the cost efficiency of the cross-media campaign with the TV-only campaign that delivers an equivalent reach. In Table 1, the second column from the right compares the average cost per incremental reach point on TV with that on YT/GDN and is calculated by Equivalent TV GRPs × TV Cost Per GRP/Incremental Reach Points . YT/GDN budget/Incremental Reach Points 3
Monitor-Plus is a syndicated research tool from Nielsen that contains an aggregation of aired ads and an estimate of how much they cost per advertiser.
6
Google Inc.
3
CASE STUDIES
3.3
Case Study II: TMobile Campaign
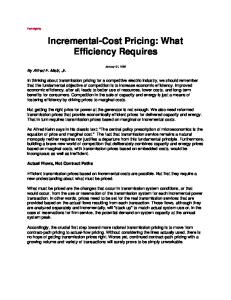
The first column from the right shows the cost savings of switching from a TV-only campaign to a cross-media campaign as percentage of TV budget and is calculated by Equivalent TV GRPs × TV Cost Per GRP − YT/GDN budget . TV budget For the extrapolation method, the metrics are also calculated using the upper and lower bounds of the 95% confidence interval of the estimated incremental TV GRPs, as shown with the numbers in the brackets in Table 1(a). Figure 1 shows the cumulative TV 1+, 3+ and 5+ reach curves, which are used to find the amount of TV GRPs equivalent to YT/GDN’s incremental reach. For the extrapolation method, we fit a functional form to the curve, shown in red, and extrapolate the fitted curve to the TV and online combined reach. The increment in GRPs from TV reach to the combined reach is the necessary increase in TV budget if the advertiser wants to attain the cross-media reach by advertising on TV alone. Although we fit the statistical model to both 1+ reach and 3+, 5+ reach curves, we do not use the extrapolation method to compare the cost efficiency for 3+ and 5+ reach because the reach curves have flattened. As shown in Table 1(a), the cost per incremental reach point to the total target demographic on TV is 2.88 times that on YT/GDN, and 3.86 times to the target demographic in the lightest TV quintile. Even if we use the lower bound of the 95% confidence interval of the estimated cost per incremental reach point, TV is still more expensive than YT/GDN. The interpolation method is applied to both 1+ reach and 3+, 5+ reach, the results of which are shown in Table 1(b). For example, on the 3+ reach curve of the total target, it takes 372.9 GRPs for TV reach to increase from 74.30% to 74.77%. If this amount of GRPs were cut from the TV plan, YT/GDN would deliver an incremental reach of at least 0.47%. With the same budget on YT/GDN and a reduced budget on TV, the cross-media campaign would deliver at least the same reach as the current TV plan, and likely even higher reach. If the advertiser replaces the current TV plan with a cross-media plan that delivers an equivalent 3+ reach, the budget savings are 24.5% of the TV budget, and the cost per incremental 3+ reach point on TV is 18.8 times that on YT/GDN. To gain insight into why YT/GDN is more efficient than TV at delivering incremental reach, we compare the distribution of GRPs on TV and on YT/GDN. As shown in Figure 2, TV GRPs are heavily skewed towards heavy TV viewers, while YT/GDN GRPs are more evenly distributed across TV quintiles. This gives YT/GDN an advantage in reaching and delivering exposures to light TV viewers. 38.3% of people uniquely reached on YT/GDN are in the lightest TV quintile. The cost per GRP to the lightest TV quintile on YT/GDN is 66.5% of that on TV, and the cost per reach point in the lightest quintile is 26.6% of that on TV.
3.3
Case Study II: TMobile Campaign
This campaign by TMobile targeted adults 18 to 49 years old. The TV campaign was of moderate size and consisted of 257 GRPs; as a result, the incremental reach on YT/GDN was much higher than the incremental reach we saw in case study I. 32% of people reached on YT/GDN were not reached on TV, and 70.6% of the lightest TV viewers reached on YT/GDN were not reached on TV. Figure 3 shows the reach curves and Table 2 shows the results of the extrapolation and the interpolation methods. Using the extrapolation method, if the current cross-media campaign is replaced with a TV-only campaign that delivers the same 1+ reach, the advertiser can save 18.3% of the current TV budget, and the cost per incremental 1+ reach point on TV is 3.7 times that on YT/GDN. Using the interpolation method, if the advertiser replaces the current TV plan with a Google Inc.
7
3.3
Case Study II: TMobile Campaign
3
CASE STUDIES
Table 1: YT/GDN’s incremental reach and cost comparison of the cross-media campaign with the TV-only campaign in Case Study I. (a)
Extrapolation Method
TV Reach
YT/GDN YT/GDN Reach Incremental Reach
Equivalent Ratio of Cost per Incremental TV Reach Point: TV GRPs over YT/GDN
Cost Savings as Percentage of TV Budget
1+, total target
86.04%
4.9%
0.32%
56.97
1+, lightest quintile
69.35%
3.59%
0.64%
76.49
2.58% (2.36%, 2.83%) 3.93% (3.62%, 4.29%)
2.88 (2.72, 3.06) 3.86 (3.63, 4.12)
The numbers in the brackets are the lower and upper bounds of the 95% confidence intervals. (b)
1+, 1+, 3+, 5+,
8
total target lightest quintile total target total target
Interpolation Method
TV Reach
YT/GDN YT/GDN Reach Incremental Reach
Equivalent Ratio of Cost per Incremental TV Reach Point: TV GRPs over YT/GDN
86.04% 69.35% 74.77% 65.76%
4.9% 3.59% 1.60% 0.55%
56.88 60.94 372.9 505.9
0.32% 0.64% 0.47% 0.41%
2.87 3.08 18.82 25.53
Cost Savings as Percentage of TV Budget 2.57% 2.85% 24.50% 33.72%
Google Inc.
3
CASE STUDIES
3.3
Case Study II: TMobile Campaign
Figure 1: TV Reach vs GRP Curves in Case Study I. (a) 1+: Total Target
70 40
50
60
●● ●●●●●●●● ●●●● ●●●●● ●●●●●●●● ●●●●●●●●● ●●●●●● ●●●● ●●●●●●● ●●●●● ●●●● ●●●●●●●●●● ● ● ●● ●●●● ●●● ●● ●●●●● ●●●● ●●●● ●● ●●●● ●●●●●●● ● ●●● ●●●● ●● ● ●● ● ● ● ●●● ●● ●●●●● ● ●● ● ● ● ● ●● ● ● ● ● ● ● ●●● ● ● ● ●
Reach
60
80
●● ●●●●●●●●●●● ●●●●●●● ●●●●●●●●●●●● ●●●●●●●●●●● ●●●●●● ●●●●●●●●● ●●●●●● ●●●●●● ●●●● ●●●●●● ●●● ●●● ●●●●●●● ●●●● ●● ● ● ● ●●● ●●●●●●● ●●● ●●●● ●●● ●● ●● ●●●● ●●● ●●● ● ● ●●● ● ●● ●● ● ● ● ●● ●● ●● ● ● ● ● ● ● ● ● ● ● ● ●● ● ● ● ● ● ● ● ● ● ● ● ● ● ●
40
●
● ● ●● ● ● ●● ● ● ● ●
30
Reach
(b) 1+: Lightest Quintile
● ●
● ● ● ●
●
● ● ● ● ● ● ● ● ● ● ●
● ●
20
●
20
●
●
●
●
●● ●
10
●
● ● ●
●
● ●
0
0
●
●
0
500
1000
1500
●
0
500
TRP
(c) 3+: Total Target
50
60
●●●●●●●●●●●●●●●●●●●●●●●●●●●●●●●●●●●●●●●●●●●●●●●●●●●●●●●●●●●● ●●●●●●●●●●●●●●●●●●●●● ●●●●●●●●● ●●●●●●●●●● ●●●●●●●●● ●●●● ●●●●●● ●●●● ●●●●●● ●●●● ●●● ●● ●●● ● ●● ●● ● ●● ● ●● ●● ●● ● ● ● ●● ● ● ● ● ● ●● ● ● ● ● ● ● ● ● ● ● ●
40
60
●●●●●●●●●●●●●●●●●●●●●●●●●●●●●●●●●●●●●●●● ●●●●●●●●●●●●●●●● ●●●●●●●●●●●●●●●● ●●●●●●●● ●●●●● ●●●●●●● ●●●●●● ●●●● ●●●●●●●●● ●●● ●●●●● ●●● ●●● ●●●●● ●●● ●●● ● ● ●●● ● ●● ●● ● ●● ● ●● ●● ●● ● ● ● ● ● ● ● ● ● ● ●● ● ● ● ● ● ● ● ● ● ● ●
● ● ● ●
Reach
● ● ●
● ●
30
● ●
40
1500
(d) 5+: Total Target
●
Reach
1000 TRP
● ●
● ●
●
● ● ●
20
●
20
●
●
● ● ● ●
10
●
● ●
●
0
0
●
●
0
500
1000 TRP
1500
●
0
500
1000
1500
TRP
The black lines are the actual reach curves; the red lines are the fitted curves; the green dashed lines are the TV and online combined reach.
Google Inc.
9
3.4
Case Study III: Reebok Campaign
4
CONCLUDING REMARKS
Figure 2: Distribution of TV and YT/GDN GRPs across TV viewing quintiles in Case Study I.
37.2%
TV YT/GDN
30
29.6%
22.9% 20
Percentage of TRPs
26.3%
18.5%
18.8%
18.6%
12.1% 10
10.4%
0
5.67%
Heavy
Med−heavy
Medium
Med−light
Lightest
cross-media plan that delivers an equivalent 3+ reach, the budget savings are 36.6% of the current TV budget, and the cost per incremental 3+ reach point on TV is 6.4 times that on YT/GDN. Similar to case study I, TV GRPs are heavily skewed towards heavy viewers, as shown in Figure 4. The cost per GRP on YT/GDN is 37.3% of that on TV, and the cost per GRP to the lightest TV viewers on YT/GDN is only 10.73% of that on TV. Furthermore, the cost per reach point to the lightest TV viewers on YT/GDN is 17.9% of that on TV.
3.4
Case Study III: Reebok Campaign
This campaign targeted males 18 to 24 years old. This target demographic is more skewed towards light TV viewers; the lightest TV quintile accounts for 42% of the target. However, as shown in Figure 6, only 6.78% of TV GRPs are distributed to the lightest TV quintile, compared with 29.5% of YT/GDN GRPs. The cost per GRP on YT/GDN to the lightest TV viewers is 21.6% of that on TV, and the cost per reach point on YT/GDN to the lightest TV viewers is 56.1% of that on TV. Figure 5 shows the reach curves and Table 3 shows the cost comparison between a TV-only campaign and a cross-media campaign that delivers an equivalent reach.
4
Concluding Remarks
We proposed two methods to assist advertisers in evaluating the cost effectiveness of their online campaigns compared to TV in reaching target demographics, and illustrated the methods in three case studies. The extrapolation method estimates the amount of additional TV GRPs required for the TV campaign to attain the equivalent reach of the cross-media campaign. It is based on fitting and extrapolating the TV reach curve. We do not recommend using this method on flattened reach curves because extrapolating a flattened curve will lead to a huge increase in GRPs and will likely violate the assumption that the TV plan stays the same. The interpolation method estimates the amount of GRPs to be cut from the current TV plan so the cross-media campaign would deliver an equivalent reach of the TV-only campaign. It assumes that the online plan 10
Google Inc.
4
CONCLUDING REMARKS
Table 2: YT/GDN’s incremental reach and cost comparison of the cross-media campaign with the TV-only campaign in Case Study II. (a)
1+ total target 1+ lightest quintile
Extrapolation Method
TV Reach
YT/GDN YT/GDN Reach Incremental Reach
Equivalent Ratio of Cost per Incremental TV Reach Point: TV GRPs over YT/GDN
Cost Savings as Percentage of TV Budget
57.32%
13.82%
4.42%
64.19
19.58%
7.38%
5.21%
136.27
18.25% (15.69%, 21.54%) 46.32% (42.68%, 50.13%)
3.70 (3.32, 4.19) 7.86 (7.32, 8.43)
The numbers in the brackets are the lower and upper bounds of the 95% confidence intervals. (b)
1+, 1+, 3+, 5+,
total target lightest quintile total target total target
Google Inc.
Interpolation Method
TV Reach
YT/GDN YT/GDN Reach Incremental Reach
Equivalent Ratio of Cost per Incremental TV Reach Point: TV GRPs over YT/GDN
57.32% 19.58% 32.32% 18.94%
13.82% 7.38% 4.84% 2.66%
62.01 95.12 111.2 116.2
4.42% 5.21% 4.49% 3.51%
3.58 5.49 6.42 6.71
Cost Savings as Percentage of TV Budget 17.40% 30.30% 36.56% 38.51%
11
4
CONCLUDING REMARKS
Figure 3: TV Reach vs GRP Curves in Case Study II. (b) 1+: Lightest Quintile
60
25
(a) 1+: Total Target
●●
● ●
●
●
●
●
●●
● ● ●●
●●●
●
20
50
● ●
●
● ●
●
● ●
●
● ●
40
●
●
●
15
● ●
●
●
●
●
●●
●
●
●
●
Reach
●
● ● ●
30
●
●
●
● ● ● ●
Reach
●
●●
●
●
● ● ●
● ●
● ●
●
●
●
●
● ●
10
● ●
●
● ● ●
● ●
20
●●
●
●
●
●
● ●
●
●
● ● ●
● ● ●
5
●
10
●
●
●
● ●
● ●
●
●
●
●
● ●
0
0
● ●
0
100
200
300
400
●
0
100
200
TRP
30
● ●● ● ●
●
●●
●●
●
●● ●●
(d) 5+: Total Target
●●● ● ●● ●
● ● ●●
● ●
●
●
●
●
●
●
●
●
● ●
●
● ●● ●
●● ● ●● ● ●
●
●
●
●
●
●
●
●
● ● ● ●● ●●
●
● ● ● ● ● ●
●
●
● ● ● ●
10
Reach
●
20
●●
●
●
●
Reach
●
●●
●
●
●
●●
15
● ● ●
400
20
(c) 3+: Total Target
●
300
TRP
● ●
● ●
●
●
●
●
10
●
●
5
● ● ● ●
●
0
0
●
●
0
100
200 TRP
300
400
●
0
100
200
300
400
TRP
The black lines are the actual reach curves; the red lines are the fitted curves; the green dashed lines are the TV and online combined reach.
12
Google Inc.
4
CONCLUDING REMARKS
Figure 4: Distribution of TV and YT/GDN GRPs across TV viewing quintiles in Case Study II.
42.6%
26% 23.6%
24.8%
20
20.6%
20.4%
17.9%
10.6%
10.6%
10
Percentage of TRPs
30
40
TV YT/GDN
0
2.93%
Heavy
Med−heavy
Medium
Med−light
Lightest
Table 3: YT/GDN’s incremental reach and cost comparison of the cross-media campaign with the TV-only campaign in Case Study III. (a)
1+ total target 1+ lightest quintile
Extrapolation Method
TV Reach
YT/GDN YT/GDN Reach Incremental Reach
Equivalent Ratio of Cost TV per Incremental GRPs Reach Point: TV over YT/GDN
Cost Savings as Percentage of TV Budget
54.24%
8.69%
2.05%
78.38
26.3%
5.32%
3.17%
81.18
8.56% (7.09%, 10.37%) 9.27% (5.84%, 12.21%)
1.75 (1.63, 1.91) 1.82 (1.52, 2.08)
The numbers in the brackets are the lower and upper bounds of the 95% confidence intervals. (b)
1+, 1+, 3+, 5+,
total target lightest quintile total target total target
Google Inc.
Interpolation Method
TV Reach
YT/GDN YT/GDN Reach Incremental Reach
Equivalent Ratio of Cost TV per Incremental GRPs Reach Point: TV over YT/GDN
54.24% 26.3% 36.89% 26.7%
8.69% 5.32% 3.83% 2.46%
61.92 65.80 185.9 218.5
2.05% 3.17% 2.69% 1.78%
1.39 1.47 4.16 4.89
Cost Savings as Percentage of TV Budget 4.38% 5.36% 35.84% 44.12%
13
4
CONCLUDING REMARKS
Figure 5: TV Reach vs GRP Curves in Case Study III. (b) 1+: Lightest Quintile
30
(a) 1+: Total Target
● ●
●
●
●
●
●
50
● ● ● ●
● ●
●
● ●
● ●
● ● ●
40
●
●
● ●
● ●
20
●
●
● ● ●
●
●
●
● ●
● ●
● ●
●
● ●
15
Reach
●
30
●
●
●
Reach
●
●
25
●
●
●
●
●
●
10
20
●
●
●
● ● ● ●
10
●
5
●
●
●
● ●
0
0
●
●
0
100
200
300
400
500
●
0
100
200
300
TRP
400
500
TRP
(d) 5+: Total Target
40
(c) 3+: Total Target
●
●
●
●
●
●
●
●
●
●
● ●
●
●
●
25
● ● ● ●
●
●
●
●
30
●
●
●
●
●
●
●
●
●
●
●
●
●
●
●
●
● ●
●
●
●
●
● ● ●
● ●
● ●
● ●
20
● ●
●
●
●
● ●
●
15
Reach
20
Reach
● ●
●
10
●
●
10
●
5
●
0
0
●
●
0
100
200
300 TRP
400
500
●
0
100
200
300
400
500
TRP
The black lines are the actual reach curves; the red lines are the fitted curves; the green dashed lines are the TV and online combined reach.
14
Google Inc.
4
CONCLUDING REMARKS
Figure 6: Distribution of TV and YT/GDN GRPs across TV viewing quintiles in Case Study III.
30
35
TV YT/GDN 29.9%
29.5%
25
21.5% 20
20.1%
20%
15
16.3% 14.7%
14.2%
10
Percentage of TRPs
27.2%
0
5
6.78%
Heavy
Med−heavy
Medium
Med−light
Lightest
stays the same and can be applied to TV reach curves regardless of whether they have flattend or not. Both methods have been implemented in R, and the R package can be downloaded from http://code.google.com/p/incremental-reach/. Each of the two methods compares a cross-media campaign with a TV-only campaign that delivers an equivalent reach. Based on the estimated amount of TV GRPs equivalent to the online incremental reach from the two methods and the cost per GRP of the TV campaign, we can calculate the cost per incremental reach point on TV and on YT/GDN, and the budget change of switching from a TV-only campaign to a cross-media campaign. The cost per GRP on TV in our case studies is calculated by dividing the cost of the TV campaign by the total amount of TV GRPs delivered, and it varys from campaign to campaign. The costs of TV campaigns are based on data from Nielsen Monitor-Plus, which are typically higher than what advertisers actually pay on TV. Agencies are given various discounts on their TV media buys. Because we do not have access to the size of these discounts, we cannot factor it into our analysis. Nonetheless, the advertiser or agency can apply their individual discount to the numbers used in our analysis to get more realistic results. Our case studies are based on Nielsen’s fused TV and web panels. We did not investigate their data fusion methodology or the quality of their fused data. The incremental reach measured in our case studies would be more reliable if it were based on a single-source panel. In our case studies, we find that online campaigns are more efficient than TV in delivering incremental reach, especially to light TV viewers. However, additional studies based on more reliable data sources need to be conducted before we can make a generalizable conclusion. The interpolation method assumes that the online budget stays the same. The cross-media mix may be more efficient if some of the budget cut from TV is shifted to online. For a given reach, the cost savings are maximized if the advertiser uses the optimal budget allocation between TV and online. Future work is needed to develop methodologies that address optimal budget allocation. Google Inc.
15
REFERENCES
REFERENCES
Acknowledgment We would like to thank Tony Fagan, Penny Chu and Jeffrey Graham for their encouragement and support, Nicolas Remy for his work on the interface that implements the statistical model described here, Jim Dravillas, Elissa Lee and Taylan Yildiz for their insightful discussion and constructive feedback, Lizzy Van Alstine for editorial support.
Appendix A With a little algebra, (3) is equivalent to δ=
b(Rc − Rt ) . (a − Rc )(a − Rt )
(9)
b=
δ(a − Rc )(a − Rt ) . Rc − Rt
(10)
Thus
Plugging (10) into (2), we get the re-parameterized functional form (4), G=
δ(a − Rc )(a − Rt ) R . a(Rc − Rt ) a−R
(11)
Appendix B In order to fit a flat curve well, we modify the functional form in (2) into G=
b b − , a − R − c max(0, (R − k)3 ) a
(12)
where k is a pre-chosen knot. The term max(0, (R−k)3 ) is a cubic spline and forces GRP to increase much more rapidly as reach approaches the limit, causing the curve to be very flat. According to [9], the cubic spline and the functional form are continuous up to second order derivatives, and smooth to human eyes. The knot is chosen by trying several different values and picking the one that has the smallest residual sum of squares. We can use the same technique in Section 2.2 to remove the autocorrelation. We fit the following functional form to the new response variables Zi ’s, Zi =
b b b −ρ − (1 − ρ) , 3 3 a − Ri − c max(0, (Ri − k) ) a − Ri−1 − c max(0, (Ri−1 − k) ) a
where the autocorrelation coefficient ρ is estimated using AR(1) regression on the residuals of fitting functional form (12) to GRPs. The confidence interval of δˆ can be obtained through either reparametrization or simulations.
References [1] Nielsen. The Cross-Platform Report, Quarter 2, 2011 US 16
Google Inc.
REFERENCES
REFERENCES
[2] S. Shobowale. Light TV Viewers in 2012: a Major Shift to Online from TV. http://www.thinkwithgoogle.com/insights/library/studies/light-tv-viewers-2012/ [3] US TV Ad Spending(2009-2015), eMarketer, March 2011. [4] US Online Ad Spending, by Format (2011-2016), eMarketer, Jan 2012 [5] Nielsen. Data Integration in Practice: Connecting currency and proprietary data to understand media use. New York, ARF AMS, New York, 2010 [6] E. L. Lehmann, and G. Casella. Theory of Point Estimation. Springer, 1998 [7] G. P. Y. Clarke. Approximate Confidence Limits for a Parameter Function in Nonlinear Regression. Journal of the American Statistical Association, 82:221-230, 1987 [8] M. Kutner, C. Nachtsheim, J. Neter, and W. Li Applied Linear Statistical Models, 5th edition. McGraw-Hill/Irwin, 2004 [9] T. Hastie, R. Tibshirani, and J. Friedman. The Elements of Statistical Learning: Data Mining, Inference, and Prediction, Second Edition. Springer-Verlag, 2008
Google Inc.
17