The Impact of Delays in Chinese Approvals of Biotech Crops
Prepared by:
May 2018
The Impact of Delays in Chinese Approvals of Biotech Crops
Table of Contents I. EXECUTIVE SUMMARY ........................................................................................................ 9 A. INTRODUCTION ........................................................................................................................... 9 B. KEY FINDINGS ............................................................................................................................. 9 II. INTRODUCTION ............................................................................................................... 14 III. OVERVIEW OF BIOTECH EVENT APPROVAL SYSTEMS IN CHINA AND OTHER IMPORTING COUNTRIES.......................................................................................................................... 15 IV. PHASE I: BIOTECH EVENTS SUBJECT TO DELAYS IN CHINESE APPROVALS OVER THE LAST SIX YEARS ................................................................................................................................. 20 A. APPROVAL TIMELINES................................................................................................................. 20 B. ADOPTION OF BIOTECH CROPS INCORPORATING EVENTS APPROVED BY CHINA ...................................... 22 C. BENEFITS OF APPROVED BIOTECH EVENTS ...................................................................................... 24 V. PHASE I: IMPACTS ON AGRICULTURE AND THE ECONOMY FROM DELAYS OVER THE LAST SIX YEARS ................................................................................................................................. 25 A. REVIEW OF COMMODITY MARKET DEVELOPMENTS IN RECENT YEARS .................................................. 25 B. THE COUNTERFACTUAL CASE: IF CHINESE APPROVALS HAD BEEN TIMELY ............................................. 30 1. Impact on the Commodity Corn Market ........................................................................... 31 (a) United States ............................................................................................................................ 31 (b) Other Key Producers and Exporters ......................................................................................... 33 (c) China ......................................................................................................................................... 36
2. Impact on the Commodity Soybean Market ..................................................................... 38 (a) United States ............................................................................................................................ 38 (b) Other Key Producers and Exporters ......................................................................................... 38 (c) China ......................................................................................................................................... 42
3. Impact of Specialty Varieties of Corn and Soybeans ......................................................... 45 C. SUMMARY OF IMPACTS ON THE VALUE OF CROP PRODUCTION ........................................................... 46 D. IMPACTS OF CHINESE DELAYS TO THE BROADER ECONOMY ................................................................ 47 1. Input-Output Modeling ..................................................................................................... 47 2. Impacts to the US Economy .............................................................................................. 49 3. Impacts to the Canadian Economy ................................................................................... 53 4. Impacts to the Brazilian Economy ..................................................................................... 54 5. Impacts to the Argentine Economy ................................................................................... 56 VI. PHASE II: BIOTECH EVENTS SUBJECT TO DELAYS IN CHINESE APPROVALS OVER THE NEXT 35 YEARS ............................................................................................................................... 58 A. TIMELINES FOR CHINESE APPROVAL AND EVENT COMMERCIALIZATION ................................................ 59
1
The Impact of Delays in Chinese Approvals of Biotech Crops
B. ASSUMED ADOPTION RATES FOR BIOTECH CROPS ............................................................................ 61 C. BENEFITS OF APPROVED BIOTECH EVENTS ...................................................................................... 63 VII. PHASE II: IMPACTS ON AGRICULTURE AND THE ECONOMY FROM FUTURE DELAYS ........ 65 A. BASELINE OUTLOOK OF COMMODITY MARKETS FOR THE NEXT FIVE YEARS ........................................... 65 B. THE COUNTERFACTUAL SCENARIO: IF CHINESE APPROVALS OCCUR IN A TIMELIER MANNER MOVING FORWARD ................................................................................................................................................... 74 1. Impact on the Corn Market ............................................................................................... 74 (a) United States ............................................................................................................................ 74 (b) Other Key Producers and Exporters ......................................................................................... 76 (c) China ......................................................................................................................................... 80
2. Impact on the Soybean Market ......................................................................................... 81 (a) United States ............................................................................................................................ 81 (b) Other Key Producers and Exporters ......................................................................................... 82 (c) China ......................................................................................................................................... 86
3. Impact on Canola Markets ................................................................................................ 89 (a) Canada ...................................................................................................................................... 89 (b) China ......................................................................................................................................... 90
C. SUMMARY OF IMPACTS ON THE VALUE OF CROP PRODUCTION ........................................................... 91 D. IMPACTS OF CHINESE DELAYS ON THE BROADER ECONOMY ............................................................... 93 1. Impacts to the US Economy .............................................................................................. 93 2. Impacts to the Canadian Economy ................................................................................... 97 3. Impacts to the Brazilian Economy ..................................................................................... 98 4. Impacts to the Argentine Economy ................................................................................... 99
2
The Impact of Delays in Chinese Approvals of Biotech Crops
List of Exhibits Exhibit 1: Overview of China Biotech Event/Product Import Approval Application Process ...... 17 Exhibit 2: Biotech Events Approved by China within the Last 6 Years ......................................... 20 Exhibit 3: Actual vs. Counterfactual Production Start Year for Corn Events ................................ 21 Exhibit 4: Actual vs. Counterfactual Production Start Year for Soybean Events .......................... 22 Exhibit 5: US Penetration Rates of Biotech Events with Small-Scale Adoption............................ 23 Exhibit 6: Penetration Rates of Intacta and Genuity Soybean Events .......................................... 23 Exhibit 7: Corn Supply/Demand and Price in Major Producing Countries and China .................. 26 Exhibit 8: Soybean Supply/Demand and Price in Major Producing Countries, and China Soybean Complex Fundamentals ................................................................................................................ 28 Exhibit 9: Counterfactual Case: US Corn Supply/Demand and Price, and Difference from Actual Market Conditions ........................................................................................................................ 32 Exhibit 10: Counterfactual Case: Argentina Corn Supply/Demand and Price, and Difference from Actual Market Conditions ............................................................................................................. 34 Exhibit 11: Counterfactual Case: Brazil Corn Supply/Demand and Price, and Difference from Actual Market Conditions ............................................................................................................. 35 Exhibit 12: Counterfactual Case: China Corn Supply/Demand and Price, and Difference from Actual Market Conditions ............................................................................................................. 36 Exhibit 13: Counterfactual Case: US Soybean Supply/Demand and Price, and Difference from Actual Market Conditions ............................................................................................................. 39 Exhibit 14: Counterfactual Case: Argentina Soybean Supply/Demand and Price, and Difference from Actual Market Conditions .................................................................................................... 40 Exhibit 15: Counterfactual Case: Brazil Soybean Supply/Demand and Price, and Difference from Actual Market Conditions ............................................................................................................. 41 Exhibit 16: Counterfactual Case: China Soybean Complex Fundamentals, and Difference from Actual Market Conditions ............................................................................................................. 43 Exhibit 17: Value of Specialty Varieties of Corn and Soybeans Foregone due to Delays in Chinese Biotech Approvals ($ Million) ....................................................................................................... 46 Exhibit 18: Impacts of Chinese Delays on the Value of Corn Production in Key Countries .......... 46 Exhibit 19: Impacts of Chinese Delays on the Value of Soybean Production in Key Countries.... 47 Exhibit 20: Example of Backward Linkages/Upstream Industries Applied to the Grain-Farming Industry ......................................................................................................................................... 49 Exhibit 21: Cumulative Impact to US Output Over Five Years, by Type of Effect ......................... 50 Exhibit 22: Cumulative Impacts to the US Economy over Five Years (Mil $) ................................ 50 Exhibit 23: US Annual Impacts to Employment ............................................................................ 51 Exhibit 24: US Annual Impacts to Labor Income (Mil $) ............................................................... 51 Exhibit 25: US Annual Impacts to GDP (Mil $) .............................................................................. 51 Exhibit 26: US Annual Impacts to Business Sales (Mil $) .............................................................. 51
3
The Impact of Delays in Chinese Approvals of Biotech Crops
Exhibit 27: Top 15 US Industries Ranked by 5-Year Cumulative Employment Impact (Indirect and Induced Effects Only) .................................................................................................................... 52 Exhibit 28: Top 15 US Industries Ranked by 5-Year Cumulative GDP Impact (Indirect and Induced Effects Only) (Mil $) ...................................................................................................................... 52 Exhibit 29: Top 15 US Industries Ranked by 5-Year Cumulative Sales Impact (Indirect and Induced Effects Only) (Mil $) ...................................................................................................................... 53 Exhibit 30: Cumulative Impact to Canadian Output Over Five Years, by Type of Effect .............. 54 Exhibit 31: Cumulative Impacts to the Canadian Economy over Five Years (Mil $) ..................... 54 Exhibit 32: Canada Annual Impact to GDP (Mil $) ........................................................................ 54 Exhibit 33: Canada Annual Impact to Business Sales (Mil $) ....................................................... 54 Exhibit 34: Cumulative Impact to Brazilian Output Over Five Years, by Type of Effect ............... 55 Exhibit 35: Cumulative Impacts to the Brazilian Economy over Five Years (Mil $) ...................... 55 Exhibit 36: Annual Impacts to Brazil (Mil $) ................................................................................. 56 Exhibit 37: Cumulative Impact to Argentine Output Over Five Years, by Type of Effect ............. 56 Exhibit 38: Cumulative Impacts to the Argentine Economy over Five Years (Mil $) ................... 56 Exhibit 39: Annual Impacts to Argentina (Mil $) .......................................................................... 57 Exhibit 40: Argentine Export Tax Impacts (Mil $) ......................................................................... 57 Exhibit 41: Biotech Events Addressed in Phase II ......................................................................... 59 Exhibit 42: Timeline for Commercialization of Soybean Events ................................................... 60 Exhibit 43: Timeline for Commercialization of Corn Events ......................................................... 61 Exhibit 44: Timeline for Commercialization of Canola Events ...................................................... 61 Exhibit 45: Assumed Penetration Rates for Phase II Biotech Events in the US, 2016-2021 ......... 62 Exhibit 46: Assumed Penetration Rates for Phase II Biotech Events in Canada, 2016-2021 ....... 62 Exhibit 47: Assumed Penetration Rates for Phase II Biotech Events in Argentina and Brazil, 20162021 .............................................................................................................................................. 64 Exhibit 48: Corn Supply/Demand Baseline Outlook in Major Producing Countries and China .... 66 Exhibit 49: Soybean Supply/Demand Baseline Outlook in Major Producing Countries, and China Soybean Complex Fundamentals.................................................................................................. 70 Exhibit 50: Canola Supply/Demand Baseline Outlook in Canada and China ................................ 73 Exhibit 51: Counterfactual Scenario: US Corn Supply/Demand, and Difference from Baseline Outlook ......................................................................................................................................... 75 Exhibit 52: Counterfactual Scenario: Argentina Corn Supply/Demand and Difference from Baseline Outlook ........................................................................................................................... 77 Exhibit 53: Counterfactual Scenario: Brazil Corn Supply/Demand, and Difference from Baseline Outlook ......................................................................................................................................... 78 Exhibit 54: Counterfactual Scenario: Canada Corn Supply/Demand, and Difference from Baseline Outlook ......................................................................................................................................... 79
4
The Impact of Delays in Chinese Approvals of Biotech Crops
Exhibit 55: Counterfactual Scenario: China Corn Supply/Demand, and Difference from Baseline Outlook ......................................................................................................................................... 80 Exhibit 56: Counterfactual Scenario: US Soybean Supply/Demand, and Difference from Baseline Outlook ......................................................................................................................................... 82 Exhibit 57: Counterfactual Scenario: Argentina Soybean Supply/Demand, and Difference from Baseline Outlook ........................................................................................................................... 83 Exhibit 58: Counterfactual Scenario: Brazil Soybean Supply/Demand, and Difference from Baseline Outlook ........................................................................................................................... 84 Exhibit 59: Counterfactual Scenario: Canada Soybean Supply/Demand, and Difference from Baseline Outlook ........................................................................................................................... 85 Exhibit 60: Counterfactual Scenario: China Soybean Complex Fundamentals, and Difference from Baseline Outlook ........................................................................................................................... 87 Exhibit 61: Counterfactual Scenario: Canada Canola Supply/Demand, and Difference from Baseline Outlook ........................................................................................................................... 89 Exhibit 62: Counterfactual Scenario: China Canola Supply/Demand, and Difference from Baseline Outlook ......................................................................................................................................... 90 Exhibit 63: Future Impacts of Chinese Delays on the Value of Corn Production in Key Countries ....................................................................................................................................................... 92 Exhibit 64: Future Impacts of Chinese Delays on the Value of Soybean Production in Key Countries ....................................................................................................................................................... 92 Exhibit 65: Cumulative Impact to US Output Over Five Years, by Type of Effect ......................... 93 Exhibit 66: Cumulative Impacts to the US Economy over Five Years (Mil $) ................................ 93 Exhibit 67: US Annual Impacts to Employment ............................................................................ 94 Exhibit 68: US Annual Impacts to Labor Income (Mil $) ............................................................... 94 Exhibit 69: US Annual Impacts to GDP (Mil $) .............................................................................. 94 Exhibit 70: US Annual Impacts to Business Sales (Mil $) .............................................................. 94 Exhibit 71: Top 15 US Industries Ranked by 5-Year Cumulative Employment Impact (Indirect and Induced Effects Only) .................................................................................................................... 95 Exhibit 72: Top 15 US Industries Ranked by 5-Year Cumulative GDP Impact (Indirect and Induced Effects Only) (Mil $) ...................................................................................................................... 96 Exhibit 73: Top 15 US Industries Ranked by 5-Year Cumulative Sales Impact (Indirect and Induced Effects Only) (Mil $) ...................................................................................................................... 96 Exhibit 74: Cumulative Impact to Canadian Output Over Five Years, by Type of Effect .............. 97 Exhibit 75: Cumulative Impacts to the Canadian Economy over Five Years (Mil $) ..................... 97 Exhibit 76: Canada Annual Impact to GDP (Mil $) ........................................................................ 98 Exhibit 77: Canada Annual Impact to Business Sales (Mil $) ....................................................... 98 Exhibit 78: Cumulative Impact to Brazilian Output Over Five Years, by Type of Effect ............... 98 Exhibit 79: Cumulative Impacts to the Brazilian Economy over Five Years (Mil $) ...................... 99
5
The Impact of Delays in Chinese Approvals of Biotech Crops
Exhibit 80: Annual Impacts to Brazil (Mil $) ................................................................................. 99 Exhibit 81: Cumulative Impact to Argentine Output Over Five Years, by Type of Effect ........... 100 Exhibit 82: Cumulative Impacts to the Argentine Economy over Five Years (Mil $) ................. 100 Exhibit 83: Annual Impacts to Argentina (Mil $) ........................................................................ 100 Exhibit 84: Argentine Export Tax Impacts (Mil $) ....................................................................... 101
6
The Impact of Delays in Chinese Approvals of Biotech Crops
Terms and Definitions TERM Biotech Event Carryout Closed-loop Cultivation
Commercialization
Counterfactual Scenario Crop Value
Delay Developers Direct Impact Environmental Risk Assessment
Functional Regulatory System
DEFINITION The insertion of a particular transgene into a specific location on a chromosome, conferring specific characteristics. Stocks of a commodity at the end of a crop-marketing year. Cultivation of crop under a strictly controlled system that channels production to specific users. The transfer of title and control of seed to the purchaser for the planting and production of a crop or crop product that will be placed into general commerce.1 A scenario built on an assumption(s) contrary to what has actually occurred or is expected to occur. The average price of a crop multiplied by production in a given year. Difference in time between the actual commercialization of a product and what would have occurred if regulatory approval were obtained in a timely manner. Companies that develop and introduce biotech events. The economic activity that occurs in the industry(ies) in which a change occurs. Assessment to ensure that biotech crops pose no increased risks to the environment relative to conventional crops. A regulatory system that is science-based, with clearly defined timelines and processes for regulatory review and decisionmaking, and for appropriate protection for proprietary information and data. The regulatory and decision-making processes must be predictable and not subject to undue political influence. The term "predictable" includes...that the regulatory system accepts submissions in the ordinary course without preconditions related to the regulatory status in other countries, and the regulatory process for import authorization for a new product (inclusive of both single traits and stacks containing the single trait) is completed routinely within 30 months or less.2
1
CropLife International, Product Launch Stewardship, https://croplife.org/plant-biotechnology/stewardship2/product-launch-stewardship/ 2 Ibid
7
The Impact of Delays in Chinese Approvals of Biotech Crops
Gross Domestic Product (GDP)
Impact Indirect Impact Induced Impact
Output
For an industry, GDP is its value added, equal to the value of gross output minus intermediate inputs. For a country, GDP is the value of final goods and services produced in a given period of time. The change in volume or value of economic activity due to delays in biotech event approval. Economic impacts occurring to upstream industries from which the directly impacted industry purchases inputs. Impacts created by changes in the spending of labor income and profits generated by the direct and indirect impacts. IMPLAN terminology meaning gross value of production. No corrections are made to avoid double counting of inter-industry purchases. (Also referred to as business sales.)
8
The Impact of Delays in Chinese Approvals of Biotech Crops
I. EXECUTIVE SUMMARY A. Introduction In recent years, China has taken considerably longer to approve new biotech crop “events” than have other countries. CropLife International (CLI) commissioned Informa’s Agribusiness Consulting Group (Informa) to conduct an analysis of the agricultural and broader economic impacts of these delays in Chinese approvals. Informa’s analysis was conducted in two phases. The first phase focuses on biotech events approved by China over the last six years, while the second phase addresses conditions over the next 3-5 years.3 This report addresses each phase separately.
B. Key Findings
United States Corn Market
Historical Impact: The value of US corn production would have been $100-175 million
higher annually in the 2010/11 and 2011/12 crop-marketing years (SeptemberAugust) if the timing of Chinese approvals of biotech corn events had been consistent with a functional regulatory system. From 2013/14 to 2015/16, the impact on the value of the US corn crop is estimated to have been well over $1 billion annually. Corn production would have increased by 35-40 million bushels (bu) annually, equivalent to 890,000-1,000,000 metric tons (MT). Most of this additional volume would have found its way into export markets. Future Impact: The value of US corn production would be $360 million to $1 billion higher annually from 2017/18 to 2021/22 if Chinese approvals of biotech events were granted in a timely manner, as opposed to delays consistent with those experienced over the last six years. Soybean Market
Historical Impact: More-timely approvals of biotech events by China would have had
a relatively small effect on the US soybean sector over the last six years. It is estimated that yields and production would have been slightly higher for 2015/16 and 2016/17, resulting in a higher value for the soybean crop on the order of $10 million each year.
3
The agricultural market analysis was completed in January 2018.
9
The Impact of Delays in Chinese Approvals of Biotech Crops Future Impact: The impact on the US soybean sector would be significantly higher going
forward. The value of US soybean production would be $175-$415 million higher annually in the 2017/18 through 2021/22 period absent Chinese delays. An
additional 30-65 million bu (760,000-1.7 million MT) of soybeans would be
produced annually. This would mostly be exported, with a portion being crushed domestically and a marginal amount being added to inventories. Specialty Varieties of Corn and Soybeans
A handful of biotech events submitted for Chinese approval involved specialty traits
that have added value past the farm gate, such as greater processing efficiencies or more healthful oils. The value to US producers of such specialty varieties that was foregone as a result of Chinese delays was $5 million in 2012/13 and has centered around $25 million annually over the last three crop years. Broader Economic Impacts
Historical Impact: Cumulatively over the last five years, Chinese delays resulted in a
direct impact to the US of over $5 billion in output and nearly $1.8 billion in gross domestic product (GDP). Including the “ripple effects” throughout the US economy, the total impact was over $14.8 billion in output and nearly $7 billion in GDP. Future Impact: If delays in Chinese approvals were to continue over the next five years,
the impacts would be similar to those experienced over the last six years. The direct impact would be nearly $5 billion in output and over $2.3 billion in GDP. Throughout the US economy, the total impact would be over $14.5 billion in output and nearly $7.4 billion in GDP.
Brazil Corn Market
Historical Impact: The trajectory of impacts to the corn sector in Brazil and Argentina
mirrors the experience of the US. In Brazil, corn production would have been 100,000300,000 MT higher annually over the last six years. The value of the Brazilian corn crop would have been roughly $400 million higher annually in 2013/14 and 2014/15, while in other years the value of the crop would have been increased by $50 million or less. Future Impact: The value of the Brazilian corn crop would be roughly $60-$70 million
higher annually in 2017/18 and 2018/19 under a more efficient timeline for Chinese
10
The Impact of Delays in Chinese Approvals of Biotech Crops
approvals. From 2019/20 to 2021/22, the value of the crop would be approximately $115-$130 million higher annually. Production of corn would be 1-2.3 million metric tons (MMT) higher, absent delays
in Chinese approvals of biotech corn events. A majority of this would be used domestically as feed, with a still-significant portion being directed to export markets. Soybean Market
Historical Impact: The impact to Brazil – and South America overall – from delays in
Chinese approvals of soybean events is significant. This is largely attributable to Intacta soybeans, which have been rapidly adopted in the region. Brazil’s soybean output would have been 400,000-700,000 MT higher annually over
the last six years if not for delays in Chinese approvals. At the port price, the value of production would have increased by $150-350 million per year. Future Impact: Over the next five years, Brazil’s soybean output would be $155-660
million higher annually if Chinese approvals were more timely. Approximately twothirds of the increased production volumes would be exported, with a majority of the remainder crushed domestically. Broader Economic Impact
Historical Impact: Cumulatively over the last five years, the impact to Brazil’s economy
has been nearly $4.9 billion in output and over $2.6 billion in GDP. Future Impact: Cumulatively over the next five years, the impact on Brazil’s economy
would be nearly $5.8 billion in economic output and over $3 billion in GDP.
Argentina Corn Market
Historical Impact: The value of the Argentine corn crop is estimated to have been
reduced by roughly 100,000 MT or $150 million annually in 2013/14 and 2014/15 as a result of Chinese delays. In other years, the value of the crop was reduced by $15 million or less. Future Impact: The value of the Argentine corn crop would be increased by roughly
$25-$70 million annually over the next five years under a more efficient timeline for Chinese approvals.
Some of this additional corn production would be feed
domestically, but approximately 70% would be exported to other countries.
11
The Impact of Delays in Chinese Approvals of Biotech Crops Soybean Market
Historical Impact: Valued at the port price, Argentina’s soybean output would have
been $38-186 million higher annually over the last six years if not for Chinese delays. Due to Argentina’s preferential export tax system, additional soybean production would largely have been crushed domestically and then exported in the form of soybean meal and oil. Future Impact: Argentina’s soybean production would be approximately 600,000 MT -
1.1 MMT higher over the next five years, valued at $155-$290 million at the port price. Broader Economic Impact
Historical Impact: Cumulatively over the last five years, the impact to Argentina’s
economy was nearly $2.1 billion in economic output and over $1.1 billion in GDP. Taxes on exports of corn, soybeans, and soybean meal and oil would have generated an additional $133 million in revenue to the government. Future Impact: Cumulatively over the next five years, the impact on Argentina’s
economy would be nearly $3 billion in output and over $1.6 billion in GDP. Taxes on exports of soybeans, soybean meal and oil would generate an additional $266 million in revenue to the government in the absence of Chinese delays.
China Corn Market
Historical Impact: The main impact on the corn market from more timely biotech
approvals would have been an increase in imports. In 2014/15, the year of peak impact, additional imports would have been 770,000 MT. Almost
all of the additional imports would have been used in feed, supporting a
modest expansion of the domestic livestock and poultry industry. Until very recently, the Chinese government encouraged domestic corn production
by making purchases for the state temporary reserve at high prices. As a result, changes in imports in past years would have had a minor influence on Chinese farmers’ planting decisions. Future Impact: Over the next five years, more timely biotech import approvals would
result in an increase in Chinese imports of corn. In 2020/21, the year of peak impact, imports would be 120,000 MT higher.
12
The Impact of Delays in Chinese Approvals of Biotech Crops Soybean Market
Historical Impact: China is a relatively small-scale producer of soybeans and is highly
reliant on imports to meet domestic needs. It is by far the largest soybean importer in the world. It is unlikely that Chinese soybean area and production would have been significantly different if approval for the importation of soybeans containing new biotech events had been more timely. The main impact would likely have been higher soybean imports by China over the last six years, on the order of 175,000-280,000 MT annually between 2013/14 and 2016/17. China’s soybean crush would have increased by an amount equivalent to roughly three-fourths of the additional imports. Future Impact: Over the next five years, soybean imports would increase by roughly 1-
2 MMT annually if not for delays in approvals of biotech events. The vast majority would be crushed, providing more soybean meal for the livestock industry and more oil for consumers.
13
The Impact of Delays in Chinese Approvals of Biotech Crops
II. INTRODUCTION Biotech crops have been an important tool for farmers in countries that are major producers of corn, oilseeds and cotton for more than 20 years. The technology allows farmers to better control weeds and insects and protect yields. In some cases, it facilitates the production of crops that have value-added traits, such as more healthful oils or higher processing efficiencies. For consumers, including those in major importing countries, higher yields generally translate to greater security of supply and lower prices. Given the interconnectedness of the global markets for grains, oilseeds and cotton, developers of new biotech “events” try to secure government approvals not only in the countries where the crops will be planted but also in countries where the crops or certain derivative products might be imported for use in human food or animal feed. China has become a major importer of a range of agricultural commodities in recent years. This is particularly the case for soybeans, with China accounting for approximately two-thirds of global imports. In recent years, China has typically taken considerably longer to approve new biotech events than have other importing countries, such as Mexico, Japan, and South Korea. This has impacted the agriculture sectors of major crop-producing countries and, in turn, has had ripple effects throughout the broader economies of these countries. CropLife International (CLI) commissioned Informa’s Agribusiness Consulting Group (Informa) to conduct an analysis of the agricultural and broader economic impacts of the delays in Chinese biotech approvals. The analysis and conclusions contained in this report are Informa’s, and Informa used publicly available materials and its own proprietary databases as sources rather than utilizing nonpublic information made available by the seed industry. This report is split into two phases. The first phase covers crops approved by China over the last six years. The second phase addresses the impacts that would be expected to occur if similar delays continue over the next 3-5 years. The agricultural market analysis was completed in January 2018.
14
The Impact of Delays in Chinese Approvals of Biotech Crops
III. OVERVIEW OF BIOTECH EVENT APPROVAL SYSTEMS IN CHINA AND OTHER IMPORTING COUNTRIES A. China China’s system for regulating products of agricultural biotechnology is complex and multifaceted. Given that China has not approved any biotech food or feed crops for domestic commercial cultivation to date, foreign seed companies mainly seek approvals from the Chinese government for the importation of crops containing novel biotech events. Accordingly, this overview of the Chinese system focuses on the process that must be followed to gain approval for importation of the crops and subsequent use in China. Besides prerequisites that need to be met, there are three main steps a foreign developer (i.e., an applicant) must follow to obtain import approval, with an additional step for grain traders. The Ministry of Agriculture (MOA) is the main regulatory agency that reviews and assesses applications and grants approvals.
Prerequisite: Approval in the Country of Origin According to Chinese agricultural biotechnology regulations, foreign applicants who want
to export to China testing material or products containing biotech event(s) need to meet the following requirements, before becoming eligible to file applications: The testing material (and/or products for processing) containing the event has been approved for use and sale in a relevant production market; Scientific tests have been performed showing that the product will not harm humans; and Applicant has relevant, proper and adequate safety management and precautionary measures to handle the testing material and/or products throughout the importation process. Since application for Chinese approval cannot begin until approval has been granted in a
relevant production country, rather than allowing developers to begin the process at an earlier point, this lengthens the overall timeline involved in gaining an import approval from Chinese authorities.
Step One: Importation of Testing Material The applicant applies for a permit to import GMO material that contains the event (i.e.,
testing material). The testing material is to be used for field trials and rat-feeding studies.
15
The Impact of Delays in Chinese Approvals of Biotech Crops To show compliance and eligibility for application, applicants typically include biosafety
certifications obtained from the country of origin (and optionally other countries) and past scientific test results, among other supporting documents. MOA reviews the validity and completeness of the application package, makes a decision
whether to allow imports of the testing material and notifies the applicant. The applicant applies for a seed import permit (with the MOA) and quarantine permit (with
Entry-Exit Inspection and Quarantine Bureau), based on the GMO material import permit received. The applicant imports testing material and submits to the MOA for field trial and feeding
study.
Step Two: Field Trial and Feeding Study The MOA designates testing institutes and locations for the field trial and feeding test.
The purpose of the field trial is to evaluate the potential impact of the biotech event
on environmental safety. It is conducted in a controlled location. The feed study involves a 90-day rat-feeding test, for which the MOA specifies test procedures and methods. The purpose is to evaluate the impact of the biotech event on food/feed safety. Once the field trial and feeding study are completed, the testing institutes prepare
comprehensive reports and submit them to the MOA. The reports will also be made available to the applicant.
Step Three: Biosafety Certificate Application With the report from testing institutes, along with other required documents specified by
the MOA, the applicant files for a biosafety certificate. After receiving the application, the MOA, through the National Biosafety Committee (NBC),
reviews the application package. The MOA may either approve the application or request additional data/information. The NBC is supposed to meet at least twice a year to review application packages. The lack of more frequent meetings can be viewed as delaying the application process. The MOA may request additional data/information from the applicant. This can occur multiple times, or sometimes a request is repeated if the previously provided information is not deemed sufficient. For example, for one recently approved event, there were at least six requests for additional data/information before final approval was granted.
16
The Impact of Delays in Chinese Approvals of Biotech Crops There have also been occasions when the field trial and/or feeding study were not
deemed to have met the requirements of the MOA, and the MOA requested that the applicants redo the field trial and/or feeding study. At the end of the process, assuming all requirements are met, the MOA grants approval
and notifies the applicant.
Step Four: Biotech Products Import Permit (for Grain Traders) Once a biosafety certificate is granted by the MOA, crops containing the event are allowed
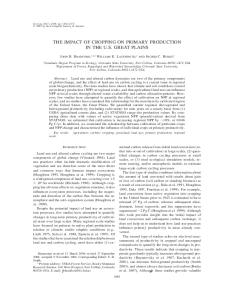
to be imported. But grain traders (exporters and importers) still need to apply to the MOA for import permits, which are shipment-dependent. The application process is summarized in Exhibit 1. Exhibit 1: Overview of China Biotech Event/Product Import Approval Application Process Testing material imports
Applicant (Biotech event developer) Apply for GMO material import permit
MOA Review and make a decision Grant GMO material import permit
Obtain GMO import permit Apply for seed import permit and quarantine permit
Time frame MOA: Around 7 months
Observed: Review and make a decision Could be 4~6 months MOA grants seed import permit and EntryExit Inspection and Quarantine Bureau grants quarantine permit
Import testing material Field trial and feed study
Designate testing institutes and locations for field trials and feed studies Issue lab/trial assignment notification
MOA: Not specified, depending on field trials, feed study and report prepraration.
Obtain lab/trial assignment notification Testing institutes conduct trials and prepare trial reports Receive trial reports Biosafety certificate application Submit application for biosafety certificate
Provide additional data/information
Biotech product imports
Review application (and request additional data/information) Make a decision Grant biosafety certificate
Observed: Varies. Could be up to 24 months MOA: Around 7 months provided no request for additional data/information
Obtain biosafety certificate
Observed: Varies greatly depending on whether receives request(s) for additional data/information
Notify grain traders and the public about the approval
Without additional requests, could be 1~5 months, although some events took longer
Work with grain traders to establish proper labeling, handling and shipping procedures Grain traders apply for trader’s shipping permit Obtain trader’s shipping permit Import approved biotech products
Review and make a decision Grant trader’s shipping permit
MOA: Around 1 month (20 working days) Observed: Around 1 month
Source: Informa Agribusiness Consulting
It is difficult for a developer to know in advance how long the application process will take for an individual biotech event. The minimum time needed for a successful application would be roughly two years. But this estimate is based on conditions including, but not limited to, 1) the
17
The Impact of Delays in Chinese Approvals of Biotech Crops
application package is detailed and complete without missing any necessary documents, 2) the field trial and feeding study meet MOA requirements, 3) the MOA has zero or a limited number of requests for additional data/information, 4) the applicant’s responses to MOA requests are sufficient and timely, and 5) any administrative delays by the MOA are minimal. Any issue affecting the steps outlined earlier, especially Step Two and Step Three, could slow the approval process significantly. Given the slow approval process, governments of major countries that develop and produce biotech crops have been actively working with the Chinese government to streamline and expedite the process. Biotech event approvals were a major topic in the US-China Strategic and Economic Dialogue (Beijing, Jun. 2016) and in the 27th US-China Joint Commission on Commerce and Trade (JCCT) (Washington, DC, Nov. 2016). There has been some recent progress in the granting of approvals, especially after the state visit of Chairman Xi Jinping to the US in April 2017. However, whether the approval process will be expedited sustainably going forward remains to be seen.
B. Japan Japan is heavily reliant on food and feed imports to meet its food needs: 100% of corn supplies are imported, along with 95% of soybean supplies. It also is a significant importer of canola/rapeseed. No biotech crops are commercially cultivated in Japan. Approval of biotech plant products in Japan involves three components: food, feed and environment. There are four ministries involved: Ministry of Agriculture, Forestry and Fisheries (MAFF); the Ministry of Health, Labor and Welfare (MHLW); the Ministry of the Environment; and the Ministry of Education, Culture, Sports, Science and Technology. Japan’s approval process is science-based, and applications are reviewed and approvals granted in a relatively timely and predictable timeframe.
C. Mexico Mexico is also a large importer of corn, soybeans and canola, mainly from the US and Canada. The most important biotech crop produced in Mexico is cotton. Mexico’s approval process for biotech events depends on whether application is being made for commercial cultivation or only for consumption as food and feed.
18
The Impact of Delays in Chinese Approvals of Biotech Crops
Mexico’s Biosafety Law established that for consumption authorization, the government has a maximum of 6 months after application to make a ruling. For environmental permits, a total maximum of 13 months is allotted for experimental, pilot and commercial release of the crop (event). However, these timelines are not always followed.
D. South Korea South Korea is a large-scale importer of corn and a significant importer of soybeans. Biotech crop approvals involve food, feed and environmental safety assessments. The Ministry of Food & Drug Safety (MFDS) requires a full approval process for biotech crops that are commercially produced or imported for human consumption. The Rural Development Administration (RDA) regulates the feed and environmental safety aspects of imported biotech commodities. The process generally requires about 2 years to complete. Redundant data requirements from the various reviewing agencies involved in the approval process have sometimes led to delays. Consequently, South Korea has established a pilot project called the “Joint Environmental Consultation Review.”
19
The Impact of Delays in Chinese Approvals of Biotech Crops
IV. PHASE I: BIOTECH EVENTS SUBJECT TO DELAYS IN CHINESE APPROVALS OVER THE LAST SIX YEARS The analysis conducted by Informa focuses on biotech events approved by China over the last six years. Seventeen biotech events involving corn and soybeans were identified as having been approved over this period (Exhibit 2). Exhibit 2: Biotech Events Approved by China within the Last 6 Years Crop
Event Code
Trade Name
Developer
Corn Corn Corn Corn Corn Corn Corn Soybean Soybean Soybean Soybean Soybean Soybean Soybean Soybean Soybean Soybean
Bt11×GA21 3272 MON87460 MIR162 5307 MON87427 DAS-4Ø278-9 305423 CV127 MON87701 MON87701×MON89788 A5547-127 305423×GTS40-3-2 MON87708 MON87769 FG72 MON87705
Agrisure™ GT/CB/LL Enogen™ Genuity® DroughtGard™ Agrisure™ Viptera Agrisure® Duracade™ Roundup Hybridization System Enlist Treus™, Plenish™ Cultivance Not Available Intacta™ RR™ 2 Pro Liberty Link™ Plenish (with RR Trait) Genuity® RR™ 2 Xtend™ Stearidonic Acid (SDA) Soybeans Balance™ GT Vistive Gold™
Syngenta/Monsanto Syngenta Monsanto Syngenta Syngenta Monsanto Dow AgroSciences LLC DuPont Pioneer BASF/Embrapa Monsanto Monsanto Bayer CropScience DuPont Pioneer/Monsanto Monsanto Monsanto Bayer CropScience/ MS Tech Monsanto
China Approval Date 7/1/2011 11/1/2012 11/1/2012 3/1/2014 7/1/2017 7/1/2017 7/1/2017 7/1/2011 3/1/2012 3/1/2012 3/1/2012 7/1/2013 11/1/2014 11/1/2015 11/1/2015 3/1/2016 3/1/2017
Source: Informa Agribusiness Consulting
For these 17 events, Informa compared the approval timelines for China to those of Japan, South Korea and Mexico. These countries were selected since they are also significant importers of corn, soybeans and canola/rapeseed. Each country has a distinct biotechnology approval process and varying government agency requirements, which bring additional complexity to the commercialization of new biotech crops since developers have to try to synchronize approvals.
A. Approval Timelines For the 17 biotech events that were identified, the dates of approval for cultivation in the key crop-producing and -exporting countries of the US, Canada, Argentina, Brazil, Paraguay and Uruguay were determined. The dates of import approval by China, Japan, Mexico and South Korea also were determined. (Not all events were applicable to every country.)
20
The Impact of Delays in Chinese Approvals of Biotech Crops
Next, an assessment was conducted regarding the years when the events could have been commercialized based on the approval timelines of Japan, Mexico and South Korea. Specifically, the counterfactual year when the crop could have been commercialized was assumed to be the latter of cultivation approval in each relevant producing country or the latest year of import approval by the other countries examined. The counterfactual timeline was then compared to the actual (or assumed actual) production start year for each event. For the analysis contained in this report, the delay attributable to China’s approval process is defined as being equal to the difference between the counterfactual year and actual start date(s) for cultivation. For example, commercialization of Genuity DroughtGard corn (event MON87460) was estimated to have been delayed by one year, based on a comparison of the timing of approval by China versus the other importing countries. The actual and counterfactual timelines for production are shown in Exhibit 3 and Exhibit 4. Exhibit 3: Actual vs. Counterfactual Production Start Year for Corn Events Event/Trade Name 2007 3272 Enogen™ 5307 Agrisure® Duracade™ Bt11×GA21 US Agrisure™ GT/CB/LL Canada
2008
2009
2010
2012
2014
2015
2016
2017
US Canada Brazil
Uruguay US
2018
US
US Canada Brazil Argentina Uruguay Uruguay
Argentina
MON87460 Genuity® DroughtGard™ DAS-4Ø278-9 Enlist Corn
2013 US US
Brazil Argentina
MIR162 Agrisure™ Viptera
2011 US
Legend: Counterfuactual Actual
Paraguay Paraguay US Canada Brazil Argentina Paraguay Paraguay Uruguay US US Canada Brazil
US Canada Brazil
21
The Impact of Delays in Chinese Approvals of Biotech Crops
Exhibit 4: Actual vs. Counterfactual Production Start Year for Soybean Events Event/Trade Name A5547-127 Liberty Link™ soybean CV127 Cultivance 305423 Plenish
2009
2010
2011 US Brazil
2012
2013
2014 US Brazil
2015
2016
2017
2018
Brazil Brazil US US Canada Canada
305423×GTS40-3-2 Plenish™ (with RR trait) MON87701×MON89788 Intacta™ Roundup Ready™ 2 Pro
MON87708 Genuity® Roundup Ready™ 2 Xtend™ Dicamba tolerant MON87705 Vistive Gold™ FG 72 Balance™ GT soybeans
US Canada Argentina Argentina Brazil Brazil Uruguay Uruguay Paraguay Paraguay
US Canada
US
US
US
US US
Legend: Counterfuactual Actual
US
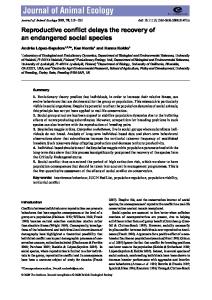
B. Adoption of Biotech Crops Incorporating Events Approved by China For biotech crops incorporating China-approved events, data were obtained or assumptions were developed regarding penetration rates (i.e., the area planted with seeds containing a biotech event divided by the total area of the crop in the country) in each country where such crops were commercialized. This was done for each year since commercialization. A majority of the 17 events approved by China were incorporated into seed lines with penetration rates under 5% to date (Exhibit 5). Three events involve specialty traits that have added value past the farm gate, which have been commercialized primarily under closed- loop systems in the US. The most notable such products are Enogen corn from Syngenta, which improves ethanol processing yields, and Plenish soybeans from DuPont and Vistive Gold soybeans from Monsanto, both of which contain oil with higher levels of oleic acid than commodity soybean oil. Two events have been incorporated into seeds that have been extensively adopted by farmers. Intacta soybeans (MON87701) have achieved penetration rates in Brazil, Argentina, Uruguay and Paraguay that approached 35% in 2017 (Exhibit 6)4. In the US, Genuity Roundup Ready 2 Xtend dicamba-resistant soybeans were grown on an estimated 25% of total soybean acres in 2017. 4
Subsequent to this analysis, Monsanto indicated publicly that the market share has been even higher, with over 50 million acres in South America in FY 2017. Slide 9: https://seekingalpha.com/article/4135582-monsanto-company2018-q1-results-earnings-call-slides
22
The Impact of Delays in Chinese Approvals of Biotech Crops
Exhibit 5: US Penetration Rates of Biotech Events with Small-Scale Adoption
Exhibit 6: Penetration Rates of Intacta and Genuity Soybean Events
Source: Informa Agribusiness Consulting Note: Some events are incorporated into stacks with other events. Penetration rates may reflect the stacked product.
23
The Impact of Delays in Chinese Approvals of Biotech Crops
C. Benefits of Approved Biotech Events Excluding the events with specialty traits, the remaining events generally provide yield protection for growers. For purposes of this analysis, yield differentials were based on a review by Informa of publicly available information on seed containing the events analyzed in Phase I. The assumptions in this report are generally consistent with those made elsewhere in the literature. Still, it should be recognized that trait developers might have more accurate information about yield differentials that is not made available to the public. Additionally, it is worth noting that some events confer cost savings to growers that are not directly related to yields. Given that these are more difficult to include in a fundamental supply/demand analysis, the agricultural impacts examined generally are based only on yield differentials, except in the case of specialty varieties of corn and soybeans (i.e., those with benefits past the farm gate).
24
The Impact of Delays in Chinese Approvals of Biotech Crops
V. PHASE I: IMPACTS ON AGRICULTURE AND THE ECONOMY FROM DELAYS OVER THE LAST SIX YEARS To determine the impact on the agriculture sector from delays in Chinese approvals, Informa built an analytic scenario reflecting how crop supply/demand balance sheets and prices would have been expected to develop if Chinese approvals had been granted in a timely manner (i.e., consistent with an effectively functioning regulatory system), and this was compared to market conditions that actually did occur over the period.
A. Review of Commodity Market Developments in Recent Years The last six years have been a relatively tumultuous period in the global commodities markets. To understand fully the markets during this period, it is necessary to review briefly some key developments that occurred starting in the middle of the last decade. The first half of the decade of the 2000s was a time of rising energy prices and widespread concerns about energy security. Unlike the energy markets, low prices generally pervaded the markets for grains and oilseeds. Within this environment, the Energy Policy Act of 2005 was signed into law, establishing a new Renewable Fuel Standard (RFS) that required motor fuels sold in the US to contain certain minimum volumes of biofuels. Two years later, the Energy Independence and Security Act of 2007 dramatically expanded the volume requirements (the previous RFS target for 2012 was more than quadrupled to 36 billion gallons by 2022), and the standard (now referred to as RFS2) was allocated among specific categories of renewable fuels, including biomass-based diesel. The enactment of these laws further encouraged a building boom that was already taking place in the renewable fuels industry, particularly for ethanol. The US, which is by far the largest corn-producing country in the world, experienced its two largest corn crops to date in 2004 and 2005, and prices averaged less than $2.25 per bushel (bu). However, conditions changed in crop year 2006/07. In the US, corn production declined due to lower acreage and weather issues, and usage in ethanol production began to rise (Exhibit 7); at the same time, Australia experienced a poor wheat crop. In crop year 2007/08, not only did domestic usage of corn increase (for both livestock feed and ethanol), but exports increased to a record level that has yet to be surpassed, due in large part to a reduction in the world wheat supplies and a weaker US dollar. The farm price of corn rose to $4.20/bu.
25
The Impact of Delays in Chinese Approvals of Biotech Crops
Exhibit 7: Corn Supply/Demand and Price in Major Producing Countries and China US CORN SUPPLY AND DEMAND (Million Bushels/Million Acres) 05/06 06/07 07/08 08/09 Planted Acres 81.8 78.3 93.5 86.0 Harvested Acres 75.1 70.6 86.5 78.6 Yield 147.9 149.1 150.7 153.3 Carryin (Sep 1) 2,114 1,967 1,304 1,624 Production 11,112 10,531 13,038 12,043 Imports 9 12 20 14 Total Supply 13,235 12,510 14,362 13,681 Feed & Residual 6,111 5,535 5,853 5,128 Food/Seed/Ind 3,023 3,546 4,447 5,030 Ethanol for Fuel 1,603 2,119 3,049 3,709 Domestic Use 9,134 9,081 10,300 10,159 Exports 2,134 2,125 2,437 1,849 Total Use 11,268 11,207 12,737 12,008 Carryout (Aug 31) 1,967 1,304 1,624 1,673 Stocks/Use 17.5% 11.6% 12.8% 13.9% Farm Revenue (Mil USD) $22,224 $32,015 $54,759 $48,895
09/10 86.4 79.5 164.4 1,673 13,067 8 14,749 5,096 5,966 4,591 11,062 1,979 13,041 1,708 13.1% $46,388
10/11 88.2 81.4 152.6 1,708 12,425 28 14,161 4,770 6,432 5,019 11,202 1,831 13,033 1,128 8.7% $64,363
11/12 91.9 83.9 146.8 1,128 12,314 29 13,471 4,508 6,435 5,000 10,943 1,539 12,482 989 7.9% $76,593
12/13 97.3 87.4 123.1 989 10,755 160 11,904 4,309 6,044 4,641 10,353 730 11,083 821 7.4% $74,103
13/14 95.4 87.5 158.1 821 13,829 36 14,686 5,001 6,532 5,124 11,533 1,921 13,454 1,232 9.2% $61,677
14/15 90.6 83.1 171.0 1,232 14,216 32 15,479 5,280 6,601 5,200 11,881 1,867 13,748 1,731 12.6% $52,597
15/16 88.0 80.8 168.4 1,731 13,602 68 15,401 5,117 6,646 5,224 11,763 1,901 13,664 1,737 12.7% $49,103
16/17 94.0 86.7 174.6 1,737 15,148 57 16,942 5,471 6,883 5,438 12,354 2,293 14,647 2,295 15.7% $50,746
14/15 3.4 7.6 1.3 26.0 0.0 27.3 5.8 3.0 8.8 17.1 25.9 1.4 5.4% $5,018
15/16 3.5 8.5 1.4 29.8 0.0 31.2 6.0 3.3 9.3 19.0 28.3 2.9 10.3% $4,944
16/17 3.6 8.3 2.9 30.0 0.0 32.9 6.6 3.3 9.9 21.6 31.5 1.4 4.4% $5,362
Sources: USDA, US Census Bureau (Trade), Informa Agribusiness Consulting (Revenues) ARGENTINA CORN SUPPLY AND DEMAND (Milllion Tonnes/Million Hectares) 05/06 06/07 07/08 08/09 09/10 Area 2.8 2.4 2.8 3.4 2.5 Yield 7.4 5.9 7.8 6.5 6.2 Carryin (Mar 1) 0.4 1.1 1.2 1.7 2.1 Production 20.5 14.4 21.8 22.0 15.5 Imports 0.0 0.0 0.0 0.0 0.0 Total Supply 20.9 15.6 23.0 23.7 17.6 Feed & Residual 3.4 3.0 4.1 4.9 4.5 Food/Seed/Ind 1.7 1.8 1.9 1.9 1.9 Domestic Use 5.1 4.8 6.0 6.8 6.4 Exports 14.6 9.5 15.3 14.8 10.3 Total Use 19.8 14.3 21.3 21.6 16.7 Carryout (Feb 28) 1.1 1.2 1.7 2.1 0.9 Stocks/Use 5.7% 8.7% 7.9% 9.7% 5.3% Farm Revenue (Mil USD) $1,953 $1,978 $3,622 $4,325 $2,642
10/11 2.9 8.6 0.9 25.0 0.0 25.9 5.0 1.9 6.9 16.5 23.4 2.5 10.6% $5,408
11/12 3.7 6.7 2.5 25.2 0.0 27.7 5.3 2.0 7.3 16.4 23.6 4.0 17.1% $7,207
12/13 3.7 5.7 4.0 21.2 0.0 25.2 5.0 2.2 7.2 17.1 24.3 0.9 3.7% $5,796
13/14 4.9 5.4 0.9 26.5 0.0 27.4 4.8 2.6 7.4 18.7 26.1 1.3 5.0% $6,131
Sources: USDA, Global Trade Tracker (Trade), Informa Agribusiness Consulting (Revenues)
26
The Impact of Delays in Chinese Approvals of Biotech Crops BRAZIL CORN SUPPLY AND DEMAND (Milllion Tonnes/Million Hectares) 05/06 06/07 07/08 08/09 09/10 Area 11.6 12.9 14.0 14.7 14.1 Yield 3.0 3.3 3.7 4.0 3.6 Carryin (Mar 1) 7.9 4.2 3.0 3.1 10.6 Production 34.9 42.5 51.1 58.6 51.0 Imports 0.6 1.0 1.2 0.6 1.2 Total Supply 43.4 47.7 55.3 62.3 62.7 Feed & Residual 32.3 33.5 34.6 37.3 38.6 Food/Seed/Ind 6.4 6.5 6.5 6.5 7.0 Domestic Use 38.7 40.0 41.1 43.8 45.6 Exports 0.5 4.7 11.1 8.0 7.0 Total Use 39.2 44.7 52.2 51.7 52.6 Carryout (Feb 28) 4.2 3.0 3.1 10.6 10.1 Stocks/Use 10.7% 6.8% 5.9% 20.5% 19.2% Farm Revenue (Mil USD) $11,443 $8,190
10/11 12.9 4.3 10.1 56.0 0.4 66.5 41.3 7.0 48.3 11.7 60.0 6.5 10.8% $11,330
11/12 13.8 4.2 6.5 57.4 0.8 64.7 43.1 7.0 50.1 8.3 58.4 6.3 10.7% $15,302
12/13 15.2 4.8 6.3 73.0 0.8 80.0 43.2 7.5 50.7 25.2 75.8 4.2 5.6% $18,752
13/14 15.8 5.2 4.2 81.5 0.9 86.6 45.6 8.0 53.6 23.9 77.5 9.2 11.8% $16,515
14/15 15.8 5.1 9.2 80.1 0.8 90.0 45.9 9.0 54.9 21.1 76.0 14.0 18.4% $15,395
15/16 15.8 5.3 14.0 84.7 0.3 99.0 46.6 9.0 55.6 35.6 91.1 7.8 8.6% $12,871
16/17 15.7 4.2 7.8 66.6 3.4 77.9 48.0 8.5 56.5 12.2 68.7 9.2 13.3% $11,267
14/15 37.1 5.8 81.3 215.6 5.5 302.5 140.0 62.0 202.0 0.0 202.0 100.5 49.7%
15/16 38.1 5.9 100.5 224.6 3.2 328.3 153.5 64.0 217.5 0.0 217.5 110.8 50.9%
16/17 36.8 6.0 110.8 219.6 2.7 333.0 158.0 70.0 228.0 0.0 228.0 105.0 46.0%
Sources: USDA, Global Trade Tracker (Trade), Informa Agribusiness Consulting (Revenues) CHINA CORN SUPPLY AND DEMAND (Milllion Tonnes/Million Hectares) 05/06 06/07 07/08 08/09 Area 26.4 28.5 29.5 29.9 Yield 5.3 5.3 5.2 5.6 Carryin (Oct 1) 36.6 35.3 36.6 38.4 Production 139.4 151.6 152.3 165.9 Imports 0.1 0.0 0.0 0.0 Total Supply 176.0 186.9 189.0 204.4 Feed & Residual 101.0 104.0 106.0 108.0 Food/Seed/Ind 36.0 41.0 44.0 45.0 Domestic Use 137.0 145.0 150.0 153.0 Exports 3.7 5.3 0.5 0.2 Total Use 140.7 150.3 150.5 153.2 Carryout (Sep 30) 35.3 36.6 38.4 51.2 Stocks/Use 25.1% 24.4% 25.5% 33.4%
09/10 31.2 5.3 51.2 164.0 1.3 216.5 118.0 47.0 165.0 0.2 165.2 51.3 31.1%
10/11 32.5 5.5 51.3 177.2 1.0 229.5 128.0 52.0 180.0 0.1 180.1 49.4 27.4%
11/12 33.5 5.7 49.4 192.8 5.3 247.5 131.1 57.0 188.1 0.1 188.2 59.3 31.5%
12/13 35.0 5.9 59.3 205.6 2.7 267.7 144.0 56.0 200.0 0.1 200.1 67.6 33.8%
13/14 36.3 6.0 67.6 218.5 3.3 289.3 150.0 58.0 208.0 0.0 208.0 81.3 39.1%
Sources: USDA, Global Trade Tracker (Trade), JCI (Price)
At the same time, much of the surge in US corn acreage in 2007 was at the expense of soybeans, and soybean production fell 16%. As a result, the stocks-to-use ratio fell from 18.6% in 2006/07 to 6.7% 2007/08, and soybean prices increased to over $10/bu from $6.43/bu (Exhibit 8). In response to tightening world grain stocks, the Chinese government introduced a program in 2008 in which corn, soybeans and rapeseed were purchased for the state temporary reserve at set minimum prices from farmers. At around the same time, the government halted expansion of a program that had been instituted starting in 2002 requiring the use of ethanol in certain cities and provinces, and it phased out subsidies for grain-based ethanol production.
27
The Impact of Delays in Chinese Approvals of Biotech Crops
Exhibit 8: Soybean Supply/Demand and Price in Major Producing Countries, and China Soybean Complex Fundamentals US SOYBEAN SUPPLY AND DEMAND (Million Bushels/Million Acres) 05/06 06/07 07/08 08/09 US SOYBEAN SUPPLY AND DEMAND (Million Bushels/Million Acres) Planted Acres 72.0 75.5 64.7 75.7 Harvested Acres 71.3 74.6 64.1 74.7 Yield 43.1 42.9 41.7 39.7 Carryin (Sep 1) 256 449 574 205 Production 3,068 3,197 2,677 2,967 Imports 3 9 10 13 Total Supply 3,327 3,655 3,261 3,185 Crush 1,739 1,808 1,803 1,662 Exports 940 1,116 1,159 1,279 Seed 89 76 89 90 Residual 111 81 5 16 Total Use 2,878 3,081 3,056 3,047 Carryout (Aug 31) 449 574 205 138 Stocks/Use 15.6% 18.6% 6.7% 4.5% Farm Revenue (Mil. USD) 17,367 20,555 27,039 29,581
09/10
10/11
11/12
12/13
13/14
14/15
15/16
16/17
77.5 76.4 44.0 138 3,361 15 3,514 1,752 1,499 90 22 3,363 151 4.5% 32,231
77.4 76.6 43.5 151 3,331 14 3,497 1,648 1,505 87 42 3,282 215 6.6% 37,644
75.0 73.8 42.0 215 3,097 16 3,328 1,703 1,366 90 0 3,159 169 5.4% 38,715
77.2 76.1 40.0 169 3,042 42 3,253 1,689 1,328 89 7 3,112 141 4.5% 43,805
76.8 76.3 44.0 141 3,358 103 3,602 1,734 1,639 97 41 3,510 92 2.6% 43,654
83.3 82.6 47.5 92 3,927 48 4,067 1,873 1,842 96 65 3,876 191 4.9% 39,664
82.7 81.7 48.0 191 3,926 24 4,140 1,886 1,942 97 18 3,944 197 5.0% 35,141
83.4 82.7 52.0 197 4,296 22 4,515 1,899 2,174 105 36 4,214 301 7.2% 40,813
Sources: USDA, US Census Bureau (Trade), Informa Agribusiness Consulting (Revenues) ARGENTINA SOYBEAN SUPPLY AND DEMAND (1,000 Tonnes/1,000 Hectares) 05/06 06/07 07/08 08/09 09/10 Planted Area 14,400 15,393 16,141 16,609 18,043 Harvested Area 14,037 15,130 15,981 16,390 16,771 Yield 2.73 2.68 2.97 2.82 1.85 Carryin (Apr 1) 555 668 2,078 5,814 4,080 Production 38,300 40,537 47,483 46,239 30,989 Imports 709 1,013 2,336 2,947 157 Total Supply 39,564 42,218 51,897 55,000 35,226 Crush 29,560 32,748 35,969 31,883 28,555 Exports 10,686 7,132 12,133 11,803 3,486 Seed 1,078 1,130 1,163 1,263 1,284 Residual -2,428 -871 -3,183 5,971 -1,782 Total Use 38,896 40,140 46,083 50,920 31,543 Carryout (Mar 31) 668 2,078 5,814 4,080 3,683 Stocks/Use 1.7% 5.2% 12.6% 8.0% 11.7% Prodn. Value at Port Price (Mil. USD) 8,962 10,013 17,616 19,559 12,799
10/11 18,344 18,131 3.01 3,683 54,500 0 58,183 39,196 13,701 1,323 1,477 55,697 2,486 4.5%
11/12 18,902 18,765 2.61 2,486 48,889 13 51,387 37,521 10,389 1,307 -888 48,328 3,059 6.3%
12/13 18,671 17,577 2.28 3,059 40,100 2 43,161 30,681 6,098 1,402 -1,355 36,826 6,335 17.2%
13/14 20,036 19,419 2.54 6,335 49,306 2 55,643 35,009 7,817 1,385 1,218 45,429 10,214 22.5%
14/15 19,782 19,253 2.77 10,214 53,398 2 63,613 38,503 7,434 1,385 5,492 52,813 10,800 20.4%
15/16 19,792 19,335 3.18 10,800 61,398 141 72,339 45,110 11,670 1,434 1,668 59,882 12,457 20.8%
16/17 20,479 19,300 2.95 12,457 57,000 1,304 70,761 43,085 9,046 1,328 629 54,089 16,672 30.8%
24,634
24,151
22,937
26,428
24,883
21,674
22,515
Sources: USDA, Global Trade Tracker (Trade), Informa Agribusiness Consulting (Production Value) BRAZIL SOYBEAN SUPPLY AND DEMAND (1,000 Tonnes/1,000 Hectares) 05/06 06/07 07/08 08/09 Harvested Area 22,917 22,530 20,680 21,318 Yield 2.31 2.53 2.82 2.82 Carryin (Feb 1) 3,143 1,731 2,689 3,507 Production 53,000 57,000 58,400 60,018 Imports 352 40 108 83 Total Supply 56,495 58,771 61,197 63,607 Crush 29,728 28,756 31,511 31,895 Exports 22,857 24,713 23,677 24,918 Seed 1,746 1,603 1,652 1,686 Residual 433 1,009 850 691 Total Use 54,764 56,082 57,690 59,191 Carryout (Jan 31) 1,731 2,689 3,507 4,417 Stocks/Use 3.2% 4.8% 6.1% 7.5% Prodn. Value at Port Price (Mil. USD) 12,508 13,680 19,798 27,248
09/10 21,750 2.63 4,417 57,200 124 61,740 30,779 28,204 1,810 -1,159 59,635 2,106 3.5%
10/11 23,350 2.94 2,106 68,700 94 70,899 35,701 29,280 1,873 2,319 69,172 1,727 2.5%
11/12 24,173 3.12 1,727 75,300 40 77,067 37,264 34,141 1,941 609 73,955 3,112 4.2%
12/13 25,042 2.71 3,112 67,900 298 71,310 36,229 31,581 2,150 -746 69,214 2,096 3.0%
13/14 27,737 2.94 2,096 81,499 269 83,864 36,430 43,039 2,338 57 81,864 2,000 2.4%
14/15 30,173 2.85 2,000 86,121 579 88,700 38,196 45,073 2,487 744 86,500 2,200 2.5%
15/16 32,093 3.02 2,200 97,000 329 99,529 40,287 54,813 2,577 52 97,729 1,800 1.8%
16/17 33,252 2.87 1,800 95,435 362 97,597 39,196 53,109 2,628 -236 94,697 2,900 3.1%
24,081
29,060
37,274
40,672
43,276
41,510
35,696
38,269
Sources: USDA, Global Trade Tracker (Trade), Informa Agribusiness Consulting (Production Value)
28
The Impact of Delays in Chinese Approvals of Biotech Crops
CHINA SOYBEAN COMPLEX BALANCE TABLES 05/06 06/07 07/08 Harvested Area 9,591 9,304 8,754 Yield 1.70 1.62 1.45 Carryin (Oct 1) 4,700 4,573 1,809 Production 16,350 15,082 12,725 Imports 28,317 28,726 37,816 Total Supply 49,367 48,381 52,350 Crush 34,500 35,970 39,518 Exports 354 446 453 Food 8,200 8,500 8,530 Residual 1,740 1,655 1,375 Total Use 44,794 46,572 49,876 Carryout (Sep 30) 4,573 1,809 2,474 Stocks/Use 10.2% 3.9% 5.0% CHINA SOYBEAN MEAL SUPPLY AND DEMAND (1,000 Tonnes) Oct/Sep Crush 30,362 34,500 35,970 Carryin (Oct 1) Production 24,026 27,296 28,465 Imports 69 837 32 Total Supply 24,095 28,133 28,497 Domestic Use 23,437 27,776 27,630 Exports 658 357 867 Total Use 24,095 28,133 28,497 Carryout (Sep 30) CHINA SOYBEAN OIL SUPPLY AND DEMAND (1,000 Tonnes) Carryin (Oct 1) 247 200 250 Production 6,149 6,410 7,045 Imports 1,516 2,404 2,727 Total Supply 7,912 9,014 10,022 Food Use 7,607 8,670 9,693 Industrial Use Exports 105 94 102 Total Use 7,712 8,764 9,795 Carryout (Sep 30) 200 250 227 Stocks/Use 2.6% 2.9% 2.3%
08/09 9,127 1.70 2,474 15,542 41,098 59,114 41,035 400 8,640 1,580 51,655 7,459 14.4%
09/10 9,190 1.63 7,459 14,982 50,338 72,779 48,830 184 8,850 1,701 59,564 13,215 22.2%
10/11 8,516 1.77 13,215 15,083 52,339 80,637 55,000 190 9,100 1,800 66,090 14,547 22.0%
11/12 7,889 1.84 14,547 14,485 59,231 88,263 60,970 275 9,300 1,800 72,345 15,918 22.0%
12/13 7,172 1.81 15,918 13,011 59,865 88,794 64,950 266 9,450 1,780 76,446 12,348 16.2%
13/14 14/15 15/16 16/17 6,791 6,800 6,506 7,200 1.76 1.79 1.81 1.81 12,348 13,848 17,009 16,910 11,951 12,154 11,785 13,050 70,364 78,350 83,230 93,492 94,663 104,352 112,024 123,452 68,850 74,500 81,000 89,000 215 143 114 125 9,850 10,200 11,100 11,500 1,900 2,500 2,900 2,500 80,815 87,343 95,114 103,125 13,848 17,009 16,910 20,327 17.1% 19.5% 17.8% 19.7%
39,518
41,035
48,830
55,000
60,970
64,950
68,850
74,500
81,000
31,280 203 31,483 30,849 634 31,483
32,475 215 32,690 31,674 1,017 32,690
38,644 83 38,727 37,550 1,177 38,727
43,560 294 43,854 43,391 463 43,854
48,288 113 48,401 47,436 966 48,401
51,440 16 51,456 50,091 1,365 51,456
54,531 20 54,551 52,534 2,017 54,551
59,004 58 59,062 57,467 1,595 59,062
64,152 23 64,175 62,269 1,906 64,175
227 7,325 2,494 10,046 9,485
477 8,726 1,514 10,717 10,035
605 9,840 1,319 11,764 11,409
303 10,914 1,502 12,719 12,044
615 11,626 1,409 13,650 12,545
1,021 12,335 1,353 14,709 13,650
965 13,347 773 15,085 14,200
778 14,515 586 15,879 15,250
533 15,948 750 17,231 16,356
83 9,569 477 5.0%
77 10,112 605 6.0%
51 11,461 303 2.6%
60 12,104 615 5.1%
84 12,629 1,021 8.1%
94 13,744 965 7.0%
107 14,307 778 5.4%
96 15,346 533 3.5%
125 16,481 750 4.6%
Sources: USDA, Global Trade Tracker (Trade)
The sharp commodity price rally from the mid-2000s through the summer of 2008 was followed by a crash, due mostly to the financial crisis. Prices of petroleum and corn turned sharply lower through 2009. However, by crop years 2010/11 and 2011/12, a rebound in petroleum prices, increasing biofuels requirements under RFS2 and weather problems in certain areas of the US (notably a drought in the Southern Plains) led to substantially higher prices of grains and oilseeds, as stocks-to-use ratios tightened significantly. The value of US corn production (not including any government programs) surged to nearly $77 billion, more than triple the 2005/06 level. The value of soybean production rose to $39 billion, more than double the 2005/06 level. Soybean area in South America, which had been rising for a couple of decades, took another leg higher in response to record prices. With the growth of renewable fuels production slowing significantly and a surge in planted acreage in the US in 2012, it appeared that crop production would be sufficient to start
29
The Impact of Delays in Chinese Approvals of Biotech Crops
replenishing tight global stocks. However, the worst drought in a half-century hit the US during the summer of 2012, driving prices to record levels. Corn area surged higher in South America – most notably Brazil, which has maintained high plantings since this period. The situation began to ease significantly in 2013. The US produced a record corn crop and essentially tied the record for soybean output. Ethanol consumption began to approach a “blend wall,” the point at which the 10% ethanol blends (the typical blending rate) are used in as much of the US gasoline pool as is practical. As a result, corn inventories increased substantially and prices fell, although it took an additional year for the tightness in world soybean inventories to be resolved. Soybean prices did not decline significantly until crop year 2014/15, when production in the US, Brazil and at a global level hit a record. US production in 2014 was 18% larger than in 2013. Over the last few years, there has been a dramatic shift to relative abundance and low prices compared to the environment that existed for much of the prior decade. While Chinese imports of soybeans have continued their strong expansion, the growth of the global biofuels industry – most notably the US corn ethanol industry – has slowed considerably, and other sources of rapid demand growth have not emerged. Additionally, growing conditions have been generally favorable. Record corn and soybean crops have been harvested in the US, Brazil and Argentina. Record corn production has occurred in China as well. US corn prices have averaged under $4/bu each of the last three crop years, and US soybean prices have averaged $10 or less. The value of US corn production dropped to $51 billion in 2016/17, a decline of roughly one-third from the peak five years earlier. The value of soybean production had a modestly smaller decline to $35 billion from its peak of $44 billion three years earlier, before rebounding in 2016/17. In a sign of the easing of world supply/demand conditions, China’s government cancelled corn purchases for the temporary reserve in 2016. Inventories had become costly and difficult to manage, and some of the corn had gone out of condition. In a reversal, subsidies were introduced for purchases of corn from the reserve by certain end-users, including ethanol producers.
B. The Counterfactual Case: If Chinese Approvals Had Been Timely Most of the biotech events for which Chinese approval was sought have agronomic benefits (insect resistance or herbicide tolerance), and the crops produced from varieties incorporating these events are typically handled in the bulk commodity system. For these events, Informa
30
The Impact of Delays in Chinese Approvals of Biotech Crops
developed crop supply/demand balance sheets that would have been expected to occur if Chinese regulatory approvals had been granted in a timely manner (i.e., consistent with an effectively functioning regulatory system), along with estimating the value of crop production. These counterfactual supply/demand and value estimates were then compared to actual market conditions in order to quantify the impact of Chinese delays on the commodity sector. Additionally, a handful of biotech events involved specialty traits with value derived past the farm gate, such as improved efficiencies for processors or more healthful oils for consumers. These events tend to be commercialized at small scale and have relatively high-value, non-agronomic benefits, so they were not well-suited to analysis within commodity balance sheets. Accordingly, the impact of delays in their approval was analyzed separately.
1. Impact on the Commodity Corn Market (a) United States During the early part of the period analyzed, more-timely approvals of biotech events would have had a modest, positive impact on US corn yields and production. In 2010 and 2011, the national average yield would have increased by roughly 0.5 bu/acre (equivalent to 0.3% of actual yields), and production would have increased by 35-40 million bu each year (Exhibit 9). It is assessed that most of the additional production would have been exported, with minor volumes being added to inventories. The value of US corn production would have increased by $100-175 million annually in 2010/11 and 2011/12. In 2012/13, the impact was negligible, with output increasing by only 6 million bu and the value of production increasing by $23 million.
31
The Impact of Delays in Chinese Approvals of Biotech Crops
Exhibit 9: Counterfactual Case: US Corn Supply/Demand and Price, and Difference from Actual Market Conditions US CORN SUPPLY AND DEMAND: COUNTERFACTUAL CASE (Million Bushels/Million Acres) 10/11 11/12 12/13 13/14 14/15 15/16 16/17 Planted Acres 88.2 91.9 97.3 95.4 90.8 88.2 94.1 Harvested Acres 81.4 83.9 87.4 87.5 83.3 80.9 86.8 Yield 153.0 147.3 123.2 158.1 171.0 168.7 175.3 Carryin (Sep 1) 1,717 1,133 994 822 1,175 1,671 1,711 Production 12,460 12,352 10,761 13,830 14,252 13,658 15,221 Imports 28 29 160 36 32 68 57 Total Supply 14,204 13,515 11,914 14,688 15,459 15,397 16,990 Feed & Residual 4,774 4,512 4,310 4,973 5,217 5,065 5,458 Food/Seed/Ind 6,437 6,440 6,045 6,533 6,606 6,653 6,891 Ethanol for Fuel 5,019 5,000 4,641 5,124 5,200 5,224 5,438 Domestic Use 11,211 10,952 10,355 11,506 11,823 11,718 12,349 Exports 1,861 1,569 737 2,007 1,965 1,968 2,337 Total Use 13,071 12,521 11,092 13,513 13,788 13,686 14,686 Carryout (Aug 31) 1,133 994 822 1,175 1,671 1,711 2,304 Stocks/Use 8.7% 7.9% 7.4% 8.7% 12.1% 12.5% 15.7% Farm Revenue (Mil USD) $64,471 $76,767 $74,126 $63,415 $54,710 $50,134 $50,894 DIFFERENCE FROM ACTUAL Planted Acres Harvested Acres Yield Carryin (Sep 1) Production Imports Total Supply Feed & Residual Food/Seed/Ind Ethanol for Fuel Domestic Use Exports Total Use Carryout (Aug 31) Stocks/Use Farm Revenue (Mil USD)
10/11 0.0 0.0 0.4 9 35 0 43 4 4 0 8 30 38 5 0.0% $108
11/12 0.0 0.0 0.5 5 38 0 44 4 5 0 9 30 39 5 0.0% $175
12/13 0.0 0.0 0.1 5 6 0 10 2 1 0 3 7 9 1 0.0% $23
13/14 0.0 0.0 0.0 1 1 0 3 -28 0 0 -27 87 59 -57 -0.5% $1,738
14/15 0.2 0.2 0.1 -57 36 0 -21 -63 4 0 -58 98 40 -60 -0.5% $2,112
15/16 0.2 0.2 0.3 -60 56 0 -4 -53 7 0 -46 67 22 -26 -0.2% $1,031
16/17 0.1 0.1 0.7 -26 73 0 48 -14 8 0 -5 44 39 9 0.0% $148
Source: Informa Agribusiness Consulting
The impact turned substantially higher in crop year 2013/14. In the counterfactual case, it is estimated that US exports would have been 87 million bu higher than actually occurred, and ending stocks would have been 57 million bu lower. Given that exports would have been higher and ending stocks lower, it is estimated that the stocks-to-use ratio would have tightened to 8.7% rather than the actual 9.2%.
32
The Impact of Delays in Chinese Approvals of Biotech Crops
This situation continued in 2014/15. In the counterfactual case, exports would have been 98 million bu higher, and ending stocks would have been 60 million bu lower. It is estimated that Chinese regulatory delays resulted in a reduction in the value of the US corn crop of well over $1 billion in both 2013/14 and 2014/15. By 2016/17, overall Chinese corn imports were subdued due to the cessation of corn purchases for the state temporary reserve and the related substantial narrowing of the gap between domestic and world prices. As a result of biotech events not being commercialized in the US – or being planted on fewer acres since adoption was slower to ramp up – US corn production was 73 million bu lower than it otherwise would have been. In the counterfactual case, just over half of the additional production would have been directed to exports, and ending stocks would have been 9 million bu higher. The value of US corn produced would have been $148 million higher if the timing of Chinese approvals of biotech events had been consistent with a functional regulatory system. (b) Other Key Producers and Exporters The trajectory of impacts to the corn sector in Argentina and Brazil from Chinese delays mirrors the experience of the US. In general, there were fewer corn events that would have been commercialized in South America than was the case in the US. In Argentina, production would have been roughly 70,000 metric tons (MT) larger in most years since 2011/12 in the counterfactual case (Exhibit 10). Exports would have been 50,000 MT higher in 2013/14 and 2014/15. In Brazil, corn production would have been 300,000 MT larger in 2015/16 in the counterfactual case, and roughly 200,000 MT higher in most other years (Exhibit 11). Exports would have been roughly 100,000 MT higher annually from 2012/13 to 2015/16. Delays in Chinese approvals are estimated to have reduced the value of the Argentine corn crop by roughly $150 million per year in 2013/14 and 2014/15 and to have reduced the value of the Brazilian corn crop on the order of $400 million annually in both years. In other years, the impact on the value of the corn crop would have been $6-50 million annually in Brazil and $15 million or less annually in Argentina.
33
The Impact of Delays in Chinese Approvals of Biotech Crops
Exhibit 10: Counterfactual Case: Argentina Corn Supply/Demand and Price, and Difference from Actual Market Conditions ARGENTINA CORN SUPPLY & DEMAND: COUNTERFACTUAL CASE (Mil. Tonnes/Mil. Hectares) 10/11 11/12 12/13 13/14 14/15 15/16 16/17 Area 2.9 3.7 3.7 4.9 3.4 3.5 3.6 Yield 8.6 6.7 5.8 5.5 7.7 8.5 8.3 Carryin (Mar 1) 0.9 2.5 4.1 0.9 1.3 1.4 2.9 Production 25.0 25.3 21.3 26.6 26.1 29.8 30.0 Imports 0.0 0.0 0.0 0.0 0.0 0.0 0.0 Total Supply 25.9 27.8 25.3 27.5 27.4 31.2 33.0 Feed & Residual 5.0 5.3 5.0 4.8 5.8 6.0 6.6 Food/Seed/Ind 1.9 2.0 2.2 2.6 3.0 3.3 3.3 Domestic Use 6.9 7.3 7.2 7.4 8.8 9.3 9.9 Exports 16.5 16.4 17.2 18.7 17.2 19.0 21.7 Total Use 23.4 23.7 24.4 26.2 26.0 28.3 31.5 Carryout (Feb 28) 2.5 4.1 0.9 1.3 1.4 2.9 1.4 Stocks/Use 10.6% 17.1% 3.7% 5.0% 5.5% 10.3% 4.5% Farm Revenue (Mil USD) $5,410 $7,222 $5,811 $6,280 $5,175 $5,028 $5,362 DIFFERENCE FROM ACTUAL Area Yield Carryin (Mar 1) Production Imports Total Supply Feed & Residual Food/Seed/Ind Domestic Use Exports Total Use Carryout (Feb 28) Stocks/Use Farm Revenue (Mil USD)
10/11 0.0 0.0 0.0 0.0 0.0 0.0 0.0 0.0 0.0 0.0 0.0 0.0 0.0% $2
11/12 0.0 0.0 0.0 0.1 0.0 0.1 0.0 0.0 0.0 0.0 0.1 0.0 0.0% $15
12/13 0.0 0.0 0.0 0.1 0.0 0.1 0.0 0.0 0.0 0.0 0.1 0.0 0.0% $15
13/14 0.0 0.0 0.0 0.1 0.0 0.1 0.0 0.0 0.0 0.1 0.1 0.0 0.0% $149
14/15 0.0 0.0 0.0 0.1 0.0 0.1 0.0 0.0 0.0 0.1 0.1 0.0 0.0% $157
15/16 0.0 0.0 0.0 0.1 0.0 0.1 0.0 0.0 0.0 0.0 0.1 0.0 0.0% $84
16/17 0.0 0.0 0.0 0.0 0.0 0.1 0.0 0.0 0.0 0.0 0.0 0.0 0.0% $0
Source: Informa Agribusiness Consulting
34
The Impact of Delays in Chinese Approvals of Biotech Crops
Exhibit 11: Counterfactual Case: Brazil Corn Supply/Demand and Price, and Difference from Actual Market Conditions BRAZIL CORN SUPPLY & DEMAND: COUNTERFACTUAL CASE (Mil. Tonnes/Mil. Hectares) Scenario 10/11 11/12 12/13 13/14 14/15 15/16 Area 12.9 13.8 15.2 15.8 15.8 15.8 Yield 4.3 4.2 4.8 5.2 5.1 5.4 Carryin (Mar 1) 10.1 6.5 6.3 4.2 9.2 14.0 Production 56.1 57.6 73.2 81.7 80.3 85.0 Imports 0.4 0.8 0.8 0.9 0.8 0.3 Total Supply 66.6 64.9 80.3 86.9 90.3 99.3 Feed & Residual 41.4 43.2 43.3 45.7 46.0 46.7 Food/Seed/Ind 7.0 7.0 7.5 8.0 9.0 9.0 Domestic Use 48.4 50.2 50.8 53.7 55.0 55.7 Exports 11.7 8.3 25.2 23.9 21.2 35.7 Total Use 60.1 58.5 76.0 77.7 76.2 91.4 Carryout (Feb 28) 6.5 6.3 4.2 9.2 14.0 7.9 Stocks/Use 10.8% 10.8% 5.6% 11.8% 18.4% 8.6% Farm Revenue (Mil USD) $11,336 $15,337 $18,804 $16,915 $15,824 $13,100
16/17 15.7 4.3 7.9 66.8 3.4 78.1 48.1 8.5 56.6 12.3 68.9 9.2 13.4% $11,289
DIFFERENCE FROM ACTUAL Area Yield Carryin (Mar 1) Production Imports Total Supply Feed & Residual Food/Seed/Ind Domestic Use Exports Total Use Carryout (Feb 28) Stocks/Use Farm Revenue (Mil USD)
10/11 0.0 0.0 0.0 0.1 0.0 0.1 0.1 0.0 0.1 0.0 0.1 0.0 0.0% $6
11/12 0.0 0.0 0.0 0.2 0.0 0.2 0.1 0.0 0.1 0.0 0.1 0.0 0.0% $35
12/13 0.0 0.0 0.0 0.2 0.0 0.2 0.1 0.0 0.1 0.1 0.2 0.0 0.0% $52
13/14 0.0 0.0 0.0 0.2 0.0 0.3 0.1 0.0 0.1 0.1 0.2 0.1 0.0% $400
14/15 0.0 0.0 0.1 0.2 0.0 0.3 0.1 0.0 0.1 0.1 0.2 0.1 0.0% $429
15/16 0.0 0.0 0.1 0.3 0.0 0.4 0.2 0.0 0.2 0.1 0.3 0.1 0.0% $230
16/17 0.0 0.0 0.1 0.2 0.0 0.2 0.1 0.0 0.1 0.0 0.2 0.1 0.0% $22
Source: Informa Agribusiness Consulting
35
The Impact of Delays in Chinese Approvals of Biotech Crops
(c) China China’s corn area, yield and production would have been essentially unchanged in the period since 2010/11 if China had approved biotech events in a more-timely manner. China has generally not allowed planting of biotech seed, so the approvals would have been only to allow corn (and distillers grains) containing those events to be imported for food and feed use. Additionally, the Chinese government was encouraging corn production by making purchases for the state temporary reserve at high prices. In the counterfactual case, given additional corn production and lower prices in major exporting countries, China would have been expected to have imported more corn during the 2010/112012/13 period, on the order of 160,000-720,000 MT annually, depending on the year (Exhibit 12). In 2013/14 and 2014/15, Chinese prices were far above world prices, even though China imported substantial volumes of corn from Ukraine. Had it not been for delays in Chinese approvals, imports would have been 720,000 MT higher in 2013/14 and 770,000 MT higher in 2014/15. Still, even in 2015/16, total imports would have been expected to peak at 6.3 million metric tons (MMT), which is well below the tariff rate quota (TRQ) and is only moderately higher than the 2011/12 import level. In 2016/17, imports would have been only 85,000 MT higher in the counterfactual case. The policy changes made by the Chinese government reduced the attractiveness of imports relative to domestically produced corn, and imports would have totaled only 2.8 MMT. Starting in crop year 2013/14, when prices of imported corn began to fall well below domestic prices, consumers of corn in China would have saved a substantial amount of money on the additional imports compared to what they would have had to pay if they had bought the corn domestically. Cumulatively from 2013/14 to 2016/17, China would have imported an additional 1.7 MMT of corn in the counterfactual case. The cost of this corn would have been $152 million less than if it had been purchased domestically. Exhibit 12: Counterfactual Case: China Corn Supply/Demand and Price, and Difference from Actual Market Conditions
36
The Impact of Delays in Chinese Approvals of Biotech Crops CHINA CORN SUPPLY & DEMAND: COUNTERFACTUAL CASE (Mil. Tonnes/Mil. Hectares) 10/11 11/12 12/13 13/14 14/15 15/16 Area 32.5 33.5 35.0 36.3 37.1 38.1 Yield 5.5 5.7 5.9 6.0 5.8 5.9 Carryin (Oct 1) 51.3 49.4 59.3 67.6 81.3 100.5 Production 177.2 192.8 205.6 218.5 215.6 224.6 Imports 1.6 6.1 2.9 4.0 6.3 3.3 Total Supply 230.2 248.3 267.8 290.1 303.3 328.4 Feed & Residual 128.7 131.8 144.2 150.7 140.8 153.6 Food/Seed/Ind 52.0 57.0 56.0 58.0 62.0 64.0 Domestic Use 180.7 188.8 200.2 208.7 202.8 217.6 Exports 0.1 0.1 0.1 0.0 0.0 0.0 Total Use 180.8 188.9 200.2 208.7 202.8 217.6 Carryout (Sep 30) 49.4 59.3 67.6 81.3 100.5 110.8 Stocks/Use 27.3% 31.4% 33.7% 39.0% 49.5% 50.9%
16/17 36.8 6.0 110.8 219.6 2.8 333.1 158.1 70.0 228.1 0.0 228.1 105.0 46.0%
DIFFERENCE FROM ACTUAL Area Yield Carryin (Mar 1) Production Imports Total Supply Feed & Residual Food/Seed/Ind Domestic Use Exports Total Use Carryout (Feb 28) Stocks/Use
10/11 0.0 0.0 0.0 0.0 0.7 0.7 0.7 0.0 0.7 0.0 0.7 0.0 -0.1%
11/12 0.0 0.0 0.0 0.0 0.7 0.7 0.7 0.0 0.7 0.0 0.7 0.0 -0.1%
12/13 0.0 0.0 0.0 0.0 0.2 0.2 0.2 0.0 0.2 0.0 0.2 0.0 0.0%
13/14 0.0 0.0 0.0 0.0 0.7 0.7 0.7 0.0 0.7 0.0 0.7 0.0 -0.1%
14/15 0.0 0.0 0.0 0.0 0.8 0.8 0.8 0.0 0.8 0.0 0.8 0.0 -0.2%
15/16 0.0 0.0 0.0 0.0 0.1 0.1 0.1 0.0 0.1 0.0 0.1 0.0 0.0%
16/17 0.0 0.0 0.0 0.0 0.1 0.1 0.1 0.0 0.1 0.0 0.1 0.0 0.0%
Source: Informa Agribusiness Consulting
37
The Impact of Delays in Chinese Approvals of Biotech Crops
2. Impact on the Commodity Soybean Market (a) United States In the US, more timely approvals of biotech events by China would have had a small effect on the commodity soybean sector, particularly compared to the corn sector. This is because (1) the historical delays for soybean events were limited in length, (2) they involved improvements to established product lines or lines with low market share, or (3) the events involved specialty products (e.g., Plenish high-oleic soybeans). It is estimated that yields and production would have been fractionally higher for 2015/16 and 2016/17, resulting in a higher value for the soybean crop on the order of $10 million each year (Exhibit 13). (b) Other Key Producers and Exporters The impact to South America from delays in Chinese event approvals is larger than to the US. This is largely due to Intacta RR2 PRO soybeans (events MON87701 and MON89788); these have been rapidly adopted in South America, so the delay in China’s import approval had an outsized impact. In the counterfactual case, Argentine soybean production would have increased by 220,000390,000 MT annually since 2013/14 – on the order of 0.5% (Exhibit 14). Because of Argentina’s differential taxation system that favors domestic crushing of soybeans, roughly two-thirds of the additional production would have been crushed, while the remainder would have been split between imports and additions to inventories. Valued at the port price, Argentina’s soybean output would have been $83-186 million higher annually. Brazil’s soybean production would have been 400,000-720,000 MT higher annually since 2013/14 if Chinese approvals had occurred in a timely manner (Exhibit 15). Similar to Argentina, this represents an increase of roughly 0.5% – slightly more in 2013/14 and 2014/15. Just over half of the additional production would have been exported, with nearly as much going to crushing. Modest incremental volumes would go to inventories. Valued at the port price, Brazil’s soybean output would have been $150-350 million higher annually.
38
The Impact of Delays in Chinese Approvals of Biotech Crops
Exhibit 13: Counterfactual Case: US Soybean Supply/Demand and Price, and Difference from Actual Market Conditions US SOYBEAN SUPPLY AND DEMAND: COUNTERFACTUAL CASE (Million Bushels/Million Acres) 10/11 11/12 12/13 13/14 14/15 15/16 Planted Acres 77.4 75.0 77.2 76.8 83.3 82.7 Harvested Acres 76.6 73.8 76.1 76.3 82.6 81.7 Yield 43.5 42.0 40.0 44.0 47.5 48.1 Carryin (Sep 1) 151 215 169 141 92 191 Production 3,331 3,097 3,042 3,358 3,927 3,928 Imports 14 16 42 103 48 24 Total Supply 3,497 3,328 3,253 3,602 4,067 4,142 Crush 1,648 1,703 1,689 1,734 1,873 1,886 Exports 1,505 1,366 1,328 1,639 1,842 1,943 Seed 87 90 89 97 96 97 Residual 42 0 7 41 65 19 Total Use 3,282 3,159 3,112 3,510 3,876 3,945 Carryout (Aug 31) 215 169 141 92 191 197 Stocks/Use 6.6% 5.4% 4.5% 2.6% 4.9% 5.0% Farm Revenue (Mil. USD) 37,644 38,715 43,805 43,654 39,664 35,153
16/17 83.4 82.7 52.0 197 4,297 22 4,516 1,899 2,174 105 37 4,215 301 7.2% 40,821
DIFFERENCE FROM ACTUAL Planted Acres Harvested Acres Yield Carryin (Sep 1) Production Imports Total Supply Crush Exports Seed Residual Total Use Carryout (Aug 31) Stocks/Use Farm Revenue (Mil. USD)
10/11 0.00 0.00 0.00 0 0 0 0 0 0 0 0 0 0 0.0% 0
11/12 0.00 0.00 0.00 0 0 0 0 0 0 0 0 0 0 0.0% 0
12/13 0.00 0.00 0.00 0 0 0 0 0 0 0 0 0 0 0.0% 0
13/14 0.00 0.00 0.00 0 0 0 0 0 0 0 0 0 0 0.0% 0
14/15 0.00 0.00 0.00 0 0 0 0 0 0 0 0 0 0 0.0% 0
15/16 0.00 0.00 0.02 0 1 0 1 0 1 0 0 1 0 0.0% 12
16/17 0.00 0.00 0.01 0 1 0 1 0 0 0 0 1 0 0.0% 9
Source: Informa Agribusiness Consulting
39
The Impact of Delays in Chinese Approvals of Biotech Crops
Exhibit 14: Counterfactual Case: Argentina Soybean Supply/Demand and Price, and Difference from Actual Market Conditions ARGENTINA SOYBEAN SUPPLY AND DEMAND: COUNTERFACTUAL CASE (1,000 Tonnes/1,000 Hectares) 10/11 11/12 12/13 13/14 14/15 15/16 16/17 Planted Area 18,344 18,902 18,671 20,036 19,782 19,792 20,479 Harvested Area 18,131 18,765 17,577 19,419 19,253 19,335 19,300 Yield 3.01 2.61 2.29 2.55 2.79 3.19 2.97 Carryin (Apr 1) 3,683 2,486 3,059 6,345 10,270 10,866 12,495 Production 54,500 48,889 40,166 49,613 53,788 61,619 57,277 Imports 0 13 2 2 2 141 1,304 Total Supply 58,183 51,387 43,227 55,959 64,059 72,626 71,076 Crush 39,196 37,521 30,728 35,202 38,739 45,247 43,254 Exports 13,701 10,389 6,107 7,860 7,480 11,706 9,082 Seed 1,323 1,307 1,402 1,385 1,385 1,434 1,328 Residual 1,477 -888 -1,355 1,242 5,590 1,743 675 Total Use 55,697 48,328 36,883 45,689 53,193 60,131 54,338 Carryout (Mar 31) 2,486 3,059 6,345 10,270 10,866 12,495 16,737 Stocks/Use 4.5% 6.3% 17.2% 22.5% 20.4% 20.8% 30.8%
DIFFERENCE FROM ACTUAL Planted Area Harvested Area Yield Carryin (Apr 1) Production Imports Total Supply Crush Exports Seed Residual Total Use Carryout (Mar 31) Stocks/Use Prodn. Value at Port Price (Mil. USD)
10/11 0 0 0.00 0 0 0 0 0 0 0 0 0 0 0.0%
11/12 0 0 0.00 0 0 0 0 0 0 0 0 0 0 0.0%
12/13 0 0 0.00 0 66 0 66 47 9 0 0 56 10 0.0%
13/14 0 0 0.02 10 307 0 316 193 43 0 24 260 56 0.0%
14/15 0 0 0.02 56 390 0 446 236 46 0 98 380 66 0.0%
15/16 0 0 0.01 66 221 0 287 138 36 0 76 249 38 0.0%
16/17 0 0 0.01 38 277 0 315 169 35 0 46 250 65 0.0%
0
0
38
165
186
83
112
Source: Informa Agribusiness Consulting
40
The Impact of Delays in Chinese Approvals of Biotech Crops
Exhibit 15: Counterfactual Case: Brazil Soybean Supply/Demand and Price, and Difference from Actual Market Conditions BRAZIL SOYBEAN SUPPLY AND DEMAND: COUNTERFACTUAL CASE (1,000 Tonnes/1,000 Hectares) 10/11 11/12 12/13 13/14 14/15 15/16 16/17 Harvested Area 23,350 24,173 25,042 27,737 30,173 32,093 33,252 Yield 2.94 3.12 2.72 2.96 2.88 3.04 2.89 Carryin (Feb 1) 2,106 1,728 3,113 2,100 2,014 2,218 1,807 Production 68,724 75,332 68,045 82,084 86,838 97,406 95,994 Imports 94 40 298 269 579 329 362 Total Supply 70,924 77,100 71,456 84,453 89,431 99,953 98,163 Crush 35,713 37,279 36,303 36,684 38,505 40,451 39,421 Exports 29,290 34,155 31,645 43,339 45,438 55,037 53,413 Seed 1,873 1,941 2,150 2,338 2,487 2,577 2,628 Residual 2,320 611 -742 78 784 81 -215 Total Use 69,196 73,986 69,356 82,439 87,214 98,145 95,247 Carryout (Jan 31) 1,728 3,113 2,100 2,014 2,218 1,807 2,917 Stocks/Use 2.5% 4.2% 3.0% 2.4% 2.5% 1.8% 3.1% Prodn. Value at Port Price (Mil. USD) 29,070 37,289 40,759 43,586 41,856 35,845 38,494 DIFFERENCE FROM ACTUAL Harvested Area Yield Carryin (Feb 1) Production Imports Total Supply Crush Exports Seed Residual Total Use Carryout (Jan 31) Stocks/Use Prodn. Value at Port Price (Mil. USD)
10/11 0 0.00 0 24 0 24 12 10 0 1 23 1 0.0%
11/12 0 0.00 1 32 0 32 15 14 0 2 31 1 0.0%
12/13 0 0.01 1 145 0 146 74 64 0 4 142 4 0.0%
13/14 0 0.02 4 585 0 589 254 300 0 21 575 14 0.0%
14/15 0 0.02 14 717 0 731 309 365 0 40 714 18 0.0%
15/16 0 0.01 18 406 0 424 164 223 0 29 416 7 0.0%
16/17 0 0.02 7 559 0 567 225 304 0 21 550 17 0.0%
10
16
87
310
346
149
224
Source: Informa Agribusiness Consulting
In addition to Argentina and Brazil, the impacts of delays in Chinese regulatory approvals were analyzed for two smaller but significant South American producers of soybeans, Uruguay and Paraguay. Similar to the case for their larger neighbors, the primary product involved was Intacta soybeans. For Uruguay, production in the counterfactual case would have been 23,000 MT higher in both 2013/14 and 2014/15 and 11,000 MT higher in both 2015/16 and 2016/17. Virtually all of the additional production would have been exported. Supply/demand conditions in Paraguay would not have been materially different in the counterfactual case.
41
The Impact of Delays in Chinese Approvals of Biotech Crops
(c) China China’s soybean production is small relative to its consumption, and the country is highly reliant on imports to meet domestic needs. China imports about seven times more soybeans than it produces. In fact, soybean area and production have fallen over the last 5-10 years, as government policies encouraged production of other crops such as corn. (This framework has been revised over the last couple of years, and policies once again have begun to encourage soybean production, but this was not generally the case for the period that was analyzed.) It is unlikely that Chinese soybean area and production would have been significantly different if approval for the importation of soybeans containing new biotech events (and their use in food and feed) had been granted in a more-timely way. Rather, the main difference in the counterfactual case is that the availability of additional volumes of soybeans from major exporting countries would likely have led to modestly higher soybean imports by China. Imports would have increased by approximately 175,000-280,000 MT annually between 2013/14 and 2016/17 (Exhibit 16). This represents a change of less than 1% from actual imports, given China’s position as by far the largest soybean importer in the world. China’s soybean crush would have increased by an amount equivalent to roughly three-fourths of the additional imports, since soybeans are used predominantly for processing into meal and oil. This would have resulted in an increase in soybean meal production of approximately 100,000-160,000 MT on an annual basis, which would have been consumed almost entirely by the livestock and poultry industry. Soybean oil production would have increased by approximately 20,000-35,000 MT annually, with nearly all of the incremental amount going to food use. While it stands to reason that there would be some reduction in the prices of soybeans, meal and oil due to greater availability on the market in the counterfactual case, the small size of the incremental volumes relative to the massive size of China’s soybean complex makes it difficult to estimate the price differential with any precision. Therefore, it is not possible to estimate the overall impact on Chinese expenditures for soybeans, meal and oil.
42
The Impact of Delays in Chinese Approvals of Biotech Crops
Exhibit 16: Counterfactual Case: China Soybean Complex Fundamentals, and Difference from Actual Market Conditions CHINA SOYBEAN COMPLEX: COUNTERFACTUAL CASE 10/11 11/12 12/13 13/14 14/15 15/16 16/17 CHINA SOYBEAN SUPPLY AND DEMAND (1,000 Tonnes/1,000 Hectares) Harvested Area 8,516 7,889 7,172 6,791 6,800 6,506 7,200 Yield 1.77 1.84 1.81 1.76 1.79 1.81 1.81 Carryin (Oct 1) 13,215 14,548 15,919 12,354 13,872 17,037 16,927 Production 15,083 14,485 13,011 11,951 12,154 11,785 13,050 Imports 52,344 59,240 59,919 70,594 78,632 83,403 93,730 Total Supply 80,642 88,272 88,848 94,899 104,658 112,225 123,707 Crush 55,004 60,976 64,989 69,018 74,701 81,125 89,171 Exports 190 275 266 215 144 114 125 Food 9,101 9,301 9,456 9,874 10,228 11,117 11,522 Residual 1,801 1,801 1,783 1,920 2,549 2,941 2,539 Total Use 66,095 72,353 76,495 81,027 87,621 95,298 103,358 Carryout (Sep 30) 14,548 15,919 12,354 13,872 17,037 16,927 20,349 Stocks/Use 22.0% 22.0% 16.1% 17.1% 19.4% 17.8% 19.7% CHINA SOYBEAN MEAL SUPPLY AND DEMAND (1,000 Tonnes) Oct/Sep Crush 48,834 55,006 61,009 65,118 69,051 74,625 81,171 Carryin (Oct 1) Production 38,647 43,565 48,319 51,573 54,690 59,103 64,288 Imports 83 294 113 16 20 58 23 Total Supply 38,729 43,859 48,432 51,589 54,710 59,161 64,311 Domestic Use 37,553 43,396 47,466 50,220 52,687 57,564 62,401 Exports 1,177 463 966 1,369 2,023 1,598 1,910 Total Use 38,729 43,859 48,432 51,589 54,710 59,161 64,311 Carryout (Sep 30) CHINA SOYBEAN OIL SUPPLY AND DEMAND (1,000 Tonnes) Carryin (Oct 1) 605 303 615 1,022 967 780 534 Production 9,841 10,915 11,633 12,365 13,383 14,537 15,979 Imports 1,319 1,502 1,409 1,353 773 586 750 Total Supply 11,764 12,720 13,657 14,740 15,123 15,903 17,263 Food Use 11,410 12,045 12,552 13,678 14,234 15,272 16,386 Industrial Use Exports 52 60 84 94 107 96 125 Total Use 11,461 12,105 12,636 13,773 14,343 15,370 16,512 Carryout (Sep 30) 303 615 1,022 967 780 534 751 Stocks/Use 2.6% 5.1% 8.1% 7.0% 5.4% 3.5% 4.6%
Source: Informa Agribusiness Consulting
43
The Impact of Delays in Chinese Approvals of Biotech Crops CHINA SOYBEAN COMPLEX: DIFFERENCE FROM ACTUAL 10/11 11/12 12/13 13/14 CHINA SOYBEAN SUPPLY AND DEMAND (1,000 Tonnes/1,000 Hectares) Harvested Area 0 0 0 0 Yield 0.00 0.00 0.00 0.00 Carryin (Oct 1) 0 1 1 6 Production 0 0 0 0 Imports 5 9 54 231 Total Supply 5 9 55 236 Crush 4 6 39 168 Exports 0 0 0 1 Food 1 1 6 24 Residual 0 1 4 20 Total Use 5 8 49 212 Carryout (Sep 30) 1 1 6 24 Stocks/Use 0.0% 0.0% 0.0% 0.0% CHINA SOYBEAN MEAL SUPPLY AND DEMAND (1,000 Tonnes) Oct/Sep Crush 4 6 39 168 Carryin (Oct 1) Production 3 5 31 133 Imports 0 0 0 0 Total Supply 3 5 31 133 Domestic Use 3 5 31 129 Exports 0 0 1 4 Total Use 3 5 31 133 Carryout (Sep 30) CHINA SOYBEAN OIL SUPPLY AND DEMAND (1,000 Tonnes) Carryin (Oct 1) 0 0 0 1 Production 1 1 7 30 Imports 0 0 0 0 Total Supply 1 1 7 31 Food Use 1 1 6 28 Industrial Use Exports 0 0 0 0 Total Use 1 1 7 29 Carryout (Sep 30) 0 0 1 2 Stocks/Use 0.0% 0.0% 0.0% 0.0%
14/15
15/16
16/17
0 0.00 24 0 281 305 201 0 28 49 278 28 0.0%
0 0.00 28 0 174 201 125 0 17 41 184 17 0.0%
0 0.00 17 0 238 255 171 0 22 39 233 22 0.0%
201
125
171
159 0 159 153 6 159
99 0 99 97 3 99
136 0 136 132 4 136
2 36 0 38 34
2 22 0 24 22
1 31 0 31 29
0 36 2 0.0%
0 24 1 0.0%
0 30 1 0.0%
Source: Informa Agribusiness Consulting
44
The Impact of Delays in Chinese Approvals of Biotech Crops
3. Impact of Specialty Varieties of Corn and Soybeans As noted earlier in this section, most of the biotech events for which Chinese approval was sought have agronomic benefits, and the crops produced from varieties incorporating these events are handled in the bulk commodity system. The impacts of delays in approvals of these events were evaluated above. However, a handful of biotech events involved specialty traits with added value past the farm gate, such as Enogen corn from Syngenta, Plenish soybeans from DuPont and Vistive Gold soybeans from Monsanto. These products tend to be produced in closed-loop systems or in conditions where they are otherwise channeled to specific handlers and processors, rather than entering the commodity system. Accordingly, the impact of delays in their approval by China was analyzed separately from products that largely enter the commodity system. The developers of these products have asserted that their yields are the same as the commodity versions of the crops. In order to attract farmers to produce these crops and to be willing to accept restrictions on delivery, premiums are paid above the commodity price. These premiums have often been $0.40/bu or more. Whereas the premiums to producers are relatively well known, the net benefits to processors and others involved in the supply chain past the farm gate are more opaque, especially in the case of high-oleic soybean oil. Accordingly, this analysis focuses on farm-level impacts. In order to estimate the impact of Chinese regulatory delays on specialty varieties of corn and soybeans, the actual acreage trajectory was compared to the counterfactual acreage trajectory. The difference in acreage was then multiplied by the crop yield and the applicable premium for the product and year. The foregone value to US producers resulting from Chinese regulatory delays has centered around $25 million annually over the last three crop years (Exhibit 17). Most of this is associated with Enogen corn, but Plenish soybeans have accounted for an increasing share of the foregone value as their acreage has ramped up.
45
The Impact of Delays in Chinese Approvals of Biotech Crops
Exhibit 17: Value of Specialty Varieties of Corn and Soybeans Foregone due to Delays in Chinese Biotech Approvals ($ Million) Enogen™ Corn High-Oleic Soybeans Total
12/13 $1.4 $3.4 $4.8
13/14 $9.8 $4.0 $13.8
14/15 $20.0 $5.3 $25.3
15/16 $17.5 $7.6 $25.1
16/17 $14.0 $11.9 $25.9
Source: Informa Agribusiness Consulting Notes: Does not reflect value past farm gate. High-oleic soybeans include Plenish™ and Vistive Gold™. Does not include stearidonic acid (SDA) soybeans.
C. Summary of Impacts on the Value of Crop Production Cumulatively, the value of corn production in the US, Argentina and Brazil was $6.7 billion lower over the last five crop years than it would have been without delays in Chinese approvals of biotech crops (Exhibit 18). The impact to the US alone was $5.1 billion. Exhibit 18: Impacts of Chinese Delays on the Value of Corn Production in Key Countries
Source: Informa Agribusiness Consulting
The cumulative impact on the value of soybean production in the US, Argentina and Brazil over the last five crop years was $1.8 billion (Exhibit 19). The geography of the impact was the
46
The Impact of Delays in Chinese Approvals of Biotech Crops
opposite of the situation for corn. The reduction in value was mainly due to delayed adoption of Intacta soybeans in South America, and therefore a large share of the overall impact was in this region. The reduction in the value of Brazil’s soybean crop was $1.1 billion, while the impact on Argentina was $0.6 billion. Exhibit 19: Impacts of Chinese Delays on the Value of Soybean Production in Key Countries
Note: Argentina and Brazil values are based on port prices Source: Informa Agribusiness Consulting
D. Impacts of Chinese Delays to the Broader Economy 1. Input-Output Modeling Input-output modeling was utilized to estimate the “ripple effects” that the agricultural market impacts of Chinese regulatory delays have on the broader economies of key countries. The inputoutput tables and models allow a determination of the impact of exogenous changes in final demand on output, while taking account of the interdependencies between different industries and regions, and accounting for leakages out of the economy through items such as imports and taxes.
47
The Impact of Delays in Chinese Approvals of Biotech Crops
For the U.S., IMPLAN Pro software was used. This IMPLAN model uses historical data to construct a fixed pricing model for 536 pre-defined sectors within the economy. This allows for a detailed examination of how various industries are impacted individually. Informa used a customized approach to IMPLAN to estimate impacts on jobs, value added (essentially gross domestic product, or GDP) and output (industry sales). There are three different types of impacts incorporated into the analysis: direct, indirect and induced.
Direct impacts reflect the economic activity that occurs in the industry(ies) in which investments are made or other changes occur. In this analysis, the direct impacts occur primarily at the farm level, in terms of changes in farm revenue. If biotech events had been approved in a more-timely manner, farmers in major crop-producing counties generally would have experienced an increase in sales. The direct impact to a country/region is the amount of added economic output or sales; IMPLAN also provides a measure of GDP added, along with direct farming jobs.
Indirect impacts are the additional economic impacts that occur to upstream industries, as participants in the directly impacted industry purchase inputs and services in order to produce their commodity or product. For example, increased grain or oilseed production creates indirect impacts on upstream industries such as support activities for agriculture and farm equipment manufacturing.
Induced impacts are those impacts created by changes in the spending of labor income and profits generated by the direct and indirect impacts. In this analysis, wages for the jobs directly and indirectly supported by grain and oilseed production are spent on goods and services such as housing, medical treatments and groceries. The spending creates induced impacts in these industries.
The flow of indirect and induced impacts from a direct change to the US grain-farming industry in IMPLAN are shown in Exhibit 20.
48
The Impact of Delays in Chinese Approvals of Biotech Crops
Exhibit 20: Example of Backward Linkages/Upstream Industries Applied to the Grain-Farming Industry
Source: Informa Agribusiness Consulting
For Argentina and Brazil, the IMPLAN Online model was used. At the international level, datasets are constructed using OECD multipliers in combination with a variety of sources, and then benchmarked against other data to maintain accuracy. To model the broader impacts to the Canadian economy, Informa utilized a service provided by Statistics Canada. The government of Canada maintains supply-and-use tables that focus on measuring the productive structure of the economy, as well as input-output/industry-by-industry tables. Informa worked directly with Statistics Canada analysts to customize a model for this specific analysis (similar to the customization that Informa performed in IMPLAN). Statistics Canada then provided the results to Informa for further use and analysis.
2. Impacts to the US Economy Based on input-output modeling, delays in Chinese approvals of biotech crops had a significant impact on the US economy. In the counterfactual analysis, most of the impacts are related to corn production, with soybean impacts beginning to register in the latter years.
49
The Impact of Delays in Chinese Approvals of Biotech Crops
Cumulatively over the last five years, Chinese delays resulted in a direct impact of over $5 billion in economic output (in IMPLAN, business sales is referred to as output) and nearly $1.8 billion in GDP (Exhibit 22 and Exhibit 22). Once the economic “ripple effects” of indirect and induced impacts are included, the total impact increases to over $14.8 billion in output, and nearly $7 billion in GDP. In aggregate, a $1 increase in grain sales would have resulted in an additional $1.92 elsewhere in the economy. Exhibit 21: Cumulative Impact to US Output Over Five Years, by Type of Effect
Exhibit 22: Cumulative Impacts to the US Economy over Five Years (Mil $) Impact Type Direct Effect Indirect Effect Induced Effect Total Effect
Employment 6,910 15,516 11,424 33,850
Labor Income $ 1,473.1 $ 1,741.9 $ 1,406.1 $ 4,621.1
Value Added $ 1,762.2 $ 2,765.0 $ 2,465.5 $ 6,992.6
$ $ $ $
Output 5,072.6 5,220.0 4,523.5 14,816.0
A breakout of these impacts on a crop marketing year (MY) basis is provided in Exhibit 23 through Exhibit 26. Peak impacts occur in MY 2014/15, at over $2.9 billion in GDP, $6.1 billion in output, and nearly 34,000 jobs supported by the additional economic activity in the counterfactual case.
50
The Impact of Delays in Chinese Approvals of Biotech Crops
Exhibit 23: US Annual Impacts to Employment Employment Direct Effect Indirect Effect Induced Effect Total Effect
2012/13 77 176 129 382
2013/14 5,791 13,008 9,575 28,374
2014/15 6,910 15,516 11,424 33,850
2015/16 3,305 7,455 5,522 16,282
2016/17 465 1,064 1,114 2,643
Exhibit 24: US Annual Impacts to Labor Income (Mil $) Labor Income Direct Effect Indirect Effect Induced Effect Total Effect
$ $ $ $
2012/13 6.6 8.0 6.3 20.9
$ $ $ $
2013/14 504.2 598.0 476.4 1,578.6
$ $ $ $
2014/15 612.8 727.4 579.3 1,919.6
$ $ $ $
2015/16 303.4 356.6 285.4 945.4
$ $ $ $
2016/17 46.0 51.9 58.6 156.6
$ $ $ $
2016/17 57.8 82.6 102.8 243.2
$ $ $ $
2016/17 156.4 155.5 188.6 500.5
Exhibit 25: US Annual Impacts to GDP (Mil $) Value Added Direct Effect Indirect Effect Induced Effect Total Effect
$ $ $ $
2012/13 7.9 12.6 11.1 31.6
$ $ $ $
2013/14 600.7 948.6 835.4 2,384.6
$ $ $ $
2014/15 730.0 1,154.7 1,015.8 2,900.5
$ $ $ $
2015/16 365.8 566.4 500.4 1,432.7
Exhibit 26: US Annual Impacts to Business Sales (Mil $) Output Direct Effect Indirect Effect Induced Effect Total Effect
$ $ $ $
2012/13 22.8 23.5 20.2 66.5
$ $ $ $
2013/14 1,738.1 1,792.1 1,532.9 5,063.1
$ $ $ $
2014/15 2,112.4 2,180.3 1,863.7 6,156.4
$ $ $ $
2015/16 1,042.8 1,068.6 918.1 3,029.5
The delays in Chinese approvals did not affect every industry equally or to the same degree. Part of the benefit of the US dataset in IMPLAN is granularity, with the ability to model interactions between the impacted industry and all 536 categories within the industry sectoring scheme. Each individual industry has its own spending pattern which shows how that particular industry interacts with its upstream industries. As a result, the US dataset allows for a closer look at the various impacts on an industry-by-industry basis as well. The top 15 industries impacted over the five-year time period are examined by each type of impact (jobs, GDP, sales) in Exhibit 27 through Exhibit 29. (Note that these reflect aggregated indirect and induced impacts.) As would be expected, several agriculture-related industries, such as support activities for agriculture and real estate, are ranked among the most impacted. Still,
51
The Impact of Delays in Chinese Approvals of Biotech Crops
several non-agricultural industries, such as hospitals, restaurants, and petroleum refineries, are also among the top ones affected. In including these non-agricultural impacts, input-output analysis provides a more holistic view of the impacts to the greater economy. Exhibit 27: Top 15 US Industries Ranked by 5-Year Cumulative Employment Impact (Indirect and Induced Effects Only) Total Jobs Support activities for agriculture and forestry Wholesale trade Real estate Full-service restaurants Limited-service restaurants Hospitals Beef cattle ranching and farming, including feedlots and dual-purpose ranching and farming Grain farming Truck transportation Employment services Services to buildings Monetary authorities and depository credit intermediation Other financial investment activities Retail - General merchandise stores Retail - Food and beverage stores
26,940 9,673 1,032 706 547 503 480 356 349 327 312 306 298 290 289 288
Exhibit 28: Top 15 US Industries Ranked by 5-Year Cumulative GDP Impact (Indirect and Induced Effects Only) (Mil $) Total GDP Support activities for agriculture and forestry Wholesale trade Real estate Owner-occupied dwellings Monetary authorities and depository credit intermediation Insurance carriers Extraction of natural gas and crude petroleum Hospitals Management of companies and enterprises Petroleum refineries Pesticide and other agricultural chemical manufacturing Offices of physicians Insurance agencies, brokerages, and related activities Limited-service restaurants Truck transportation
$ $ $ $ $ $ $ $ $ $ $ $ $ $ $ $
5,230.4 965.4 399.0 252.4 232.0 160.4 121.2 113.5 102.4 91.7 75.1 72.8 65.7 57.5 55.9 55.1
52
The Impact of Delays in Chinese Approvals of Biotech Crops
Exhibit 29: Top 15 US Industries Ranked by 5-Year Cumulative Sales Impact (Indirect and Induced Effects Only) (Mil $) Total Output/Business Sales Support activities for agriculture and forestry Wholesale trade Real estate Owner-occupied dwellings Monetary authorities and depository credit intermediation Insurance carriers Extraction of natural gas and crude petroleum Hospitals Management of companies and enterprises Petroleum refineries Pesticide and other agricultural chemical manufacturing Offices of physicians Insurance agencies, brokerages, and related activities Limited-service restaurants Truck transportation
$ 9,743.5 $ 1,246.8 $ 609.6 $ 391.2 $ 353.0 $ 344.6 $ 252.3 $ 224.6 $ 212.3 $ 209.9 $ 177.7 $ 177.6 $ 146.1 $ 131.1 $ 127.3 $ 119.6
3. Impacts to the Canadian Economy In the Canadian case, the impacts of delays in biotech approvals were driven only by grain farming and were substantially smaller than the US. Based on Statistics Canada input-output modeling, it is estimated that over the course of five years the direct impact was over $166 million in output and over $106 million in GDP (Exhibit 30 and Exhibit 31). Once the economic impacts of indirect and induced effects are included, the cumulative impacts increase to over $271 million in output and over $161 million in GDP.
53
The Impact of Delays in Chinese Approvals of Biotech Crops
Exhibit 30: Cumulative Impact to Canadian Output Over Five Years, by Type of Effect
Exhibit 31: Cumulative Impacts to the Canadian Economy over Five Years (Mil $) Aggregate Employment Direct 216 $ Indirect 144 $ Induced 61 $ Total 421 $
GDP 106.6 40.9 14.0 161.5
$ $ $ $
Output 166.4 80.3 24.5 271.3
A breakout of these impacts is shown on a marketing year basis in Exhibit 32 and Exhibit 33. Peak impacts occur in MY 2013/14 at nearly $67 million in GDP and $112 million in output. Exhibit 32: Canada Annual Impact to GDP (Mil $) GDP Direct Indirect Induced Total
$ $ $ $
2012/13 0.42 0.16 0.06 0.64
$ $ $ $
2013/14 44.00 16.89 5.79 66.68
$ $ $ $
2014/15 39.16 15.03 5.16 59.35
$ $ $ $
2015/16 21.97 8.43 2.89 33.30
$ $ $ $
2016/17 1.01 0.39 0.13 1.53
Exhibit 33: Canada Annual Impact to Business Sales (Mil $) Output Direct Indirect Induced Total
$ $ $ $
2012/13 0.66 0.32 0.10 1.07
$ $ $ $
2013/14 68.72 33.17 10.11 112.01
$ $ $ $
2014/15 61.16 29.52 9.00 99.69
$ $ $ $
2015/16 34.32 16.56 5.05 55.93
$ $ $ $
2016/17 1.58 0.76 0.23 2.57
4. Impacts to the Brazilian Economy The impacts of Chinese delays on the Brazilian economy are quite significant. Cumulatively over the last five years, the direct impact was over $2.2 billion in output and over $1.2 million in GDP
54
The Impact of Delays in Chinese Approvals of Biotech Crops
(Exhibit 34 and Exhibit 35). Once indirect and induced effects are included, these impacts increase to nearly $4.9 billion in output and over $2.6 billion in GDP. These impacts have particular importance to the Brazilian economy. Agriculture tends to account for a larger share of employment, GDP and output in Brazil than in more-industrialized countries. For example, jobs within agriculture, forestry and fishing account for approximately 8% of the population of Brazil, and approximately 10%-15% (depending on the year) of employment in Brazil. This compares to approximately 2% of total employment in both the US and Canada. Agriculture accounts for approximately 5% of Brazil’s output, compared to only 1.5%-2% of the output share of similar sectors in the US. Exhibit 34: Cumulative Impact to Brazilian Output Over Five Years, by Type of Effect
Exhibit 35: Cumulative Impacts to the Brazilian Economy over Five Years (Mil $) Direct Effect Indirect Effect Induced Effect Total Effect
Employment 52,282 15,957 6,736 74,975
Labor Income ($) $ 489.0 $ 323.7 $ 248.0 $ 1,060.7
Value Added ($) $ 1,239.1 $ 820.1 $ 553.0 $ 2,612.2
$ $ $ $
Output ($) 2,249.6 1,651.1 988.2 4,888.9
A breakout of the counterfactual impacts is shown on a marketing year basis in Exhibit 36. Peak impacts occur in MY 2014/15 at nearly $903 million in GDP, nearly $1.7 billion in output and almost 75,000 jobs supported by the additional activity that occurs in the counterfactual scenario.
55
The Impact of Delays in Chinese Approvals of Biotech Crops
Exhibit 36: Annual Impacts to Brazil (Mil $) Jobs GDP Output
2012/13 2013/14 2014/15 2015/16 2016/17 13,633 69,918 74,975 36,038 23,015 $ 155.6 $ 824.7 $ 903.4 $ 441.6 $ 286.8 $ 297.2 $ 1,545.0 $ 1,686.0 $ 824.7 $ 536.0
5. Impacts to the Argentine Economy Cumulatively over the last five years, the direct economic to Argentina from Chinese regulatory delays was nearly $990 million in output and over $547 million in GDP (Exhibit 37 and Exhibit 38). Including indirect and induced effects, these impacts increase to over $2.1 billion in output and over $1.1 billion in GDP. Exhibit 37: Cumulative Impact to Argentine Output Over Five Years, by Type of Effect
Exhibit 38: Cumulative Impacts to the Argentine Economy over Five Years (Mil $) Employment Direct Effect 3,086 Indirect Effect 4,737 Induced Effect 5,318 Total Effect 13,141
Labor Income ($) $ 204.4 $ 132.1 $ 137.7 $ 474.2
Value Added ($) $ 547.4 $ 342.2 $ 278.2 $ 1,167.8
$ $ $ $
Output ($) 988.4 644.1 473.6 2,106.1
A breakout of the impacts on a marketing year basis is shown in Exhibit 39. Peak impacts occur in MY 2014/15 with nearly $406 million in GDP, over $730 million in output and over 13,000 jobs affected.
56
The Impact of Delays in Chinese Approvals of Biotech Crops
Exhibit 39: Annual Impacts to Argentina (Mil $) Jobs GDP Output
2012/13 2013/14 2014/15 2015/16 2016/17 2,061 12,237 13,141 6,259 4,228 $ 60.3 $ 370.0 $ 405.9 $ 196.6 $ 135.1 $ 111.1 $ 668.4 $ 730.7 $ 354.2 $ 241.6
Agriculture accounts for approximately 7% of Argentina’s output, compared to 5% of output in Brazil and 1.5-2% in the US and Canada. However, agriculture accounts for a somewhat smaller share of employment in Argentina than Brazil, more in line with the US and Canada. Still, an important way in which agriculture affects the broader Argentine economy is via taxes. Historically, Argentina has levied significant taxes on agricultural exports. Argentina has in place a differential export tax in place for soybean and processed soybean products that incentivizes crushing soybeans in the country and export the meal and oil as opposed to exporting whole soybeans. These substantial export taxes began to change with the election of President Mauricio Macri to office in December 2015. Soon after his election, he instituted dramatic reductions in grain export taxes. Corn and wheat export taxes were eliminated; previously, exports of corn were taxed at a rate of 20%. At that time, soybean export taxes were lowered to 30% from 35%, and soybean meal and oil export taxes were lowered from 32% to 27%; the announced intention was to reduce these rates by 5% on an annual basis until the target rates were achieved, but further reductions were put on hold for 2017. The most recent position by the Argentine government is to begin decreasing the export tax on soybeans and soybean products (meal and oil) by 0.5% per month beginning in January of 2018, until December of 2019 when it reaches the end target of 18% for soybeans and 15% for soybean meal and oil. Cumulatively over the last five years, the increased exports that would have occurred in the absence of Chinese delays would have generated an additional $133 million in tax revenue to the Argentine government, with the greatest impact in the 2014/15 marketing year (Exhibit 40). Exhibit 40: Argentine Export Tax Impacts (Mil $) Counterfactual Scenario Corn Exports (MT) Corn Export Tax Revenue (Mil $) Soybean Exports (MT) Soybean Export Tax Revenue (Mil $) SBM Exports (MT) SBM Export Tax Revenue (Mil $) SBO Exports (MT) SBO Export Tax Revenue (Mil $) Total Tax Revenue (Mil $)
$ $ $ $ $
2012/13 49,838 2.73 9,328 1.87 33,690 5.59 5,261 1.92 12.11
$ $ $ $ $
2013/14 54,948 2.60 43,098 8.63 131,979 21.16 23,602 6.88 39.27
$ $ $ $ $
2014/15 51,155 2.03 45,554 9.12 168,343 24.02 26,322 6.70 41.87
$ $ $ $ $
2015/16 48,761 35,596 6.11 97,218 8.31 19,251 3.50 17.91
$ $ $ $ $
2016/17 37,122 35,418 6.08 116,279 11.07 21,084 4.31 21.46
57
The Impact of Delays in Chinese Approvals of Biotech Crops
VI. PHASE II: BIOTECH EVENTS SUBJECT TO DELAYS IN CHINESE APPROVALS OVER THE NEXT 3-5 YEARS Phase II covers biotech events for which regulatory applications have already been made to the Chinese government but import approvals have not yet been received, as well as events for which applications have not yet been made but approvals would be expected in the next 3-5 years if timelines were consistent with importing countries with functional regulatory systems. The Chinese government does not make public a list of events for which application has been made. Therefore, Informa compiled a list of events for which it is considered likely that application has been made, focusing on events already approved for cultivation in key cropproducing countries. As previously explained, applications for import approvals can only be made to China once an event is approved for commercial use in an exporting country. Informa compiled a list of candidate events from Phillips McDougall (a unit of Informa PLC), The Biotech Trade Group, Crop Life International and the International Service for the Acquisition of Agri-biotech Applications (ISAAA). To refine the list, the events were evaluated for consistency across sources. Additionally, Informa reviewed pipeline reports, investor presentations and other materials from the major biotech seed companies to identify other events for which application might not yet have been made but approval will likely be sought over the next 3-5 years. Finally, a few events were included in Phase II that have already been approved by China, but approval was so recent that they had not been commercialized at scale (past a limited launch) through the 2016/17 crop year, which was the endpoint for the Phase I analysis. Products containing these events include Enlist corn, Agrisure Duracade corn, Balance GT soybeans, and Vistive Gold soybeans. A total of 16 biotech events in corn, soybeans and canola were identified and met the criteria for Phase II (Exhibit 2). Note that there were several pipeline events for which the timelines for seeking approval and planned commercialization could not be ascertained (e.g., fourthgeneration weed/pest control in cases where the third generation has not yet been commercialized), or for which event descriptions were ambiguous and did not provide sufficient information on the nature of the traits involved. These were excluded from the Phase II list; as a result, it is possible that if Chinese delays continue more events than were identified will be affected, especially for events for which Chinese import applications have not yet been made.
58
The Impact of Delays in Chinese Approvals of Biotech Crops
Exhibit 41: Biotech Events Addressed in Phase II Crop
Event Code Associated Products/ Trade Names
Developer
Canola Canola Corn Corn Corn Corn Corn Corn Corn Soybean Soybean Soybean Soybean Soybean Soybean Soybean
DP73496 MON88302 5307 4114 MON87427 DAS40278 MON 89034 MON87411 MON87419 MON87705 FG72 DAS-81419-2 DAS-44406-6 DAS-68416-4 n/a n/a
DuPont Pioneer Monsanto Syngenta DuPont Pioneer Monsanto Dow AgroSciences Dow AgroSciences, Monsanto Monsanto Monsanto Monsanto Bayer CropScience, MS Tech Dow AgroSciences Dow AgroSciences & MS Tech Dow AgroSciences Monsanto Monsanto
Optimum Gly TruFlex RR, InVigor X TruFlex RR Agrisure Duracade Qrome VT Double Pro with RHS, Trecepta, SmartStax with RHS Enlist PowerCore Ultra Enlist SmartStax Pro, Genuity SmartStax Pro 3rd Generation Weed Control Vistive Gold Balance GT, Balance GT - 2nd Generation Conkesta, Conkesta Enlist E3 Enlist E3 Enlist Soybean (Not Commercialized Separately), Enlist RR2 Intacta RR2 PRO - 2nd Generation Insect Control RR2 Xtend - 3rd Generation Weed Control
Country of Origin Approval 7/19/2013 9/25/2013 2/27/2013 6/20/2013 9/26/2013 9/22/2014 9/22/2014 10/27/2015 3/23/2016 12/16/2011 8/21/2013 4/17/2014 9/22/2014 9/22/2014 n/a n/a
Source: Informa/Phillips McDougall, ISAAA, The Biotech Trade Group, Crop Life International
A. Timelines for Chinese Approval and Event Commercialization The same sources that were utilized to identify the events to be included in Phase II were used to determine the timing of their expected commercialization. Commercialization dates generally extended through 2020; beyond that, companies tended not to comment on timelines, or as noted previously the nature of events farther in the pipeline was not provided in detail (Exhibit 42 through Exhibit 44). In Phase I, the average delay by the Chinese government was estimated to be three years. This is how much longer, on average, it took for China to approve biotech events versus countries with regulatory systems that were deemed to be functional. Unlike the case for Phase I, it cannot be known exactly when the Phase II events for which applications have been made will be approved, or how long the delays will be. Accordingly, it was assumed that approvals will continue to be delayed by three years, consistent with historical timelines. The only exceptions are for the events that were included in Phase I but not yet launched at commercial scale, since actual delays for those events could be determined. In the analysis of the impacts of Chinese delays on the corn, soybean and canola markets, baseline long-term supply/demand forecasts were developed. These incorporated the events identified for Phase II and reflected their expected commercialization timelines. A counterfactual set of forecasts was then developed, reflecting how supply/demand conditions would have been expected to unfold if the events had been commercialized three years earlier, consistent with
59
The Impact of Delays in Chinese Approvals of Biotech Crops
average delays in the past. (For the few events carried over from Phase I, the actual length of the delays was utilized in the analysis.) Exhibit 42: Timeline for Commercialization of Soybean Events Event/ Trade Name
2017
2018
DAS-44406-6 Enlist E3 Soybean
DAS-68416-4 X MON 89788 Enlist RoundUp Ready 2 Soybean DAS-81419-2 Conkesta Soybean DAS-81419-2 X DAS-44406-6 Conkesta Enlist E3 Soybean FG72 Balance GT Soybeans
n/a Next generation Balance GT Soybeans
2019 US Canada Brazil Argentina US Canada Brazil Argentina Brazil Argentina
2020
2021
Legend: Assumed Launch
US Canada Brazil Argentina US Canada Brazil Argentina
US MON87705 X MON89788 Vistive Gold* n/a Brazil Argentina Intacta RR2 PRO - 2nd generation insect control n/a US RR2 Xtend - 3rd generation weed control Note: The assumed actual launch is subject to Chinese approval. * Based on Phase I analysis, Vistive Gold received Chinese approval in July 2017, therefore assumed actual launch is 2018.
60
The Impact of Delays in Chinese Approvals of Biotech Crops
Exhibit 43: Timeline for Commercialization of Corn Events Event/ Trade Name
2017
4114 X MON810 X MIR604 X NK603 Qrome DAS40278 Enlist Maize
5307 Agrisure Duracade MON87427 X MON89034 X MIR162 X NK603 Trecepta
2018 US Canada US Canada Brazil Argentina US Canada US Brazil Argentina
2019
2020
2021
Legend: Assumed Launch
US Canada Brazil Argentina
MON87411 SmartStax Pro
MON87419 3rd Generation weed control MON 89034 X TC1507 X NK603 X MIR162 X DAS-40278-9 PowerCore Ultra Enlist Note: The assumed actual launch is subject to Chinese approval.
US Canada US
Exhibit 44: Timeline for Commercialization of Canola Events Event/ Trade Name
2017
DP73496 Optimum Gly Canola MON88302 X RF3 (also combined with MS8) US InVigor X TruFlex Roundup Ready Canada Note: The assumed actual launch is subject to Chinese approval.
2018 US Canada
2019
2020
2021 Legend: Assumed Launch
B. Assumed Adoption Rates for Biotech Crops Assumptions regarding market penetration rates were developed for the Phase II biotech events in the major countries where each event is expected to be commercialized: the US, Canada, Brazil and Argentina. The penetration rate is defined as the area planted to varieties containing the biotech event, divided by the total area of the crop in the country. The assumptions were developed based on statements by the companies developing the events or in reference to historical penetration rates for similar events. In cases where the events are new generations of biotech products approved in recent years by China – notably Roundup Ready 2 Xtend soybeans in the US and Intacta RR2 PRO soybeans in South America – the penetration rates were assumed to build on those existing products’ foundations.
61
The Impact of Delays in Chinese Approvals of Biotech Crops
In the US and Canada, the Phase II corn events were estimated to have less than a 1% market share in 2016 since they were only involved in limited launches, but they are expected to have a combined penetration rate of over 30% by 2021 (Exhibit 45 and Exhibit 46). The situation for soybeans and canola is more complex. For canola, existing Roundup Ready varieties currently have a roughly 46% market share. Building on this foundation, the aggregate penetration rate for Phase II canola events is expected to reach 63% in 2021. Exhibit 45: Assumed Penetration Rates for Phase II Biotech Events in the US, 2016-2021
Exhibit 46: Assumed Penetration Rates for Phase II Biotech Events in Canada, 2016-2021
62
The Impact of Delays in Chinese Approvals of Biotech Crops
In the US, Roundup Ready 2 Xtend soybeans are assumed to be planted on 32% of soybean acres in 2019.5 Including its third-generation successor (with both dicamba and glufosinate tolerance), the combined penetration rate of Phase II events in the US is expected to reach 67% by 2021. In Brazil and Argentina, given the nature of the Phase II corn events, adoption is expected to be somewhat slower than in North America. The combined penetration rate was less than 1% in 2017 and is expected to be 17% by 2021 (Exhibit 47). For soybeans, the situation is more complex due to the presence of a Phase I event, similar to the situation in the US. Intacta RR2 PRO soybeans were planted on just over one-third of the soybean area in 2017, and this is forecast to increase to just over one-half in 2019.6 Including the thirdgeneration successor for Intacta, the combined penetration rate of Phase II events is expected to reach 79% by 2021.
C. Benefits of Approved Biotech Events The Phase II events generally confer yield protection to growers. Since they have not yet been commercialized at scale, event-specific yield differentials versus other varieties were generally unavailable, unlike the situation for Phase I. Accordingly, it was assumed that the central tendencies in yield differentials from Phase I events would also be applicable to Phase II events as a group. One note is that there were no canola events approved in recent years and, therefore, included in Phase I. Literature searches did not result in any specific estimates of yield differentials for the canola traits included in Phase II. Accordingly, to be conservative, Informa assumed a 3.5% yield increase, which was half the level of soybeans. As was the case in Phase I, some events might confer cost savings to growers that are not simply a function of higher yields. However, given that these are more difficult to reflect in a supply/demand analysis, the agricultural impacts discussed in Section VII generally are based only on yield increases.
5
Subsequent to this analysis, Monsanto indicated publicly that market share is expected to increase more rapidly, with 40 million acres in the US in 2018. Slide 11: https://seekingalpha.com/article/4135582-monsanto-company2018-q1-results-earnings-call-slides 6 Subsequent to this analysis, Monsanto indicated publicly that the market share has been even higher, with over 50 million acres in South America in FY 2017. Slide 10: https://seekingalpha.com/article/4135582-monsanto-company2018-q1-results-earnings-call-slides
63
The Impact of Delays in Chinese Approvals of Biotech Crops
Exhibit 47: Assumed Penetration Rates for Phase II Biotech Events in Argentina and Brazil, 2016-2021
64
The Impact of Delays in Chinese Approvals of Biotech Crops
VII. PHASE II: IMPACTS ON AGRICULTURE AND THE ECONOMY FROM FUTURE DELAYS This analysis addresses the impacts of Chinese delays in biotech events for which approval would be expected in the next 3-5 years if timelines were consistent with those of importing countries that have functional regulatory systems. To determine the impact of these delays on the agriculture sector, Informa utilized its current long-term outlook framework. This outlook is developed using a combination of econometric analysis, analytic judgement, and qualitative input from Informa experts. Separately, Informa built a scenario reflecting how crop supply/demand balance sheets and prices would be expected to develop if Chinese regulatory approvals were granted in a timely manner. This “counterfactual” scenario was then compared to the baseline outlook in order to evaluate the future impacts of a timelier approval system. As noted in Section VI, a key assumption in this analysis is that Chinese regulatory delays over the next five years will be similar in length to those in recent years, as addressed in Phase I.
A. Baseline Outlook of Commodity Markets for the Next Five Years As discussed in Section V, commodity markets in recent years have experienced a shift to relative abundance and subdued prices relative to the previous decade of booming prices that resulted from tight supplies, increased demand, and adverse weather events. Recent generally favorable growing conditions have led to record corn and soybean crops in the US, Brazil, and Argentina, as well as record corn production in China. In addition to these increased supplies, the previously increasing growth rate of the global biofuels industry – particularly the US corn ethanol industry – has considerably slowed. This glut of supply when combined with slowing demand in some key industries has led to dramatically lower commodity prices over the last several years. In the US, moving forward, the short-term situation is likely to remain similar to the recent bearish environment. Large supplies of corn and soybeans were carried into 2017/18, with good yields leading to another year of large ending stocks. Accompanying these large supplies are prices remaining near decade lows as they are pressured by a global glut of grain. These large volumes of stocks will take time to work through and to reduce to levels that would allow a rebound in prices. Moving beyond the short term does not significantly change the picture. US total planted area is projected to remain relatively constant at approximately 340 million acres throughout the outlook. Corn area is anticipated to remain relatively flat, and moderate production increases
65
The Impact of Delays in Chinese Approvals of Biotech Crops
will be driven by yield improvements (Exhibit 7). It is important to note that the crop production forecasts contained in this report assume “normal” weather. Along with maintained area, corn ending stocks in the US are projected to remain elevated, weighing on prices. Growth in the disappearance of corn in the US is expected to be driven by exports and feed/residual use as a result of rising livestock and poultry production. Ethanol consumption has already been approaching a “blend wall,” where 10% ethanol blends are used in as much of the gasoline pool as practical, leading to a moderation of demand for corn in this sector. Corn use in ethanol is expected to remain somewhat stagnant over the outlook, absent any significant policy developments in the US or rising demand from other countries. Exhibit 48: Corn Supply/Demand Baseline Outlook in Major Producing Countries and China US CORN SUPPLY AND DEMAND (Million Bushels/Million Acres) 14/15
20/21
21/22
90.6 88.0 94.0 90.4 91.4 91.3 92.3 Harvested Acres 83.1 80.7 86.7 83.1 84.0 83.8 84.8 Yield 171.0 168.4 174.6 175.4 174.1 174.3 176.4 Carryin (Sep 1) 1,232 1,731 1,737 2,295 2,522 2,593 2,482 Production 14,216 13,602 15,148 14,578 14,629 14,602 14,949 Imports 32 67 57 45 40 40 40 Total Supply 15,479 15,401 16,942 16,917 17,190 17,235 17,471 Feed & Residual 5,324 5,131 5,471 5,600 5,625 5,815 5,718 Food/Seed/Ind 6,560 6,635 6,883 6,896 6,907 6,903 6,934 Ethanol for Fuel 5,200 5,206 5,438 5,415 5,415 5,368 5,316 Domestic Use 11,883 11,766 12,354 12,496 12,532 12,718 12,652 Exports 1,864 1,898 2,293 1,900 2,065 2,035 2,199 Total Use 13,748 13,664 14,647 14,396 14,597 14,753 14,851 Carryout (Aug 31) 1,731 1,737 2,295 2,522 2,593 2,482 2,620 Stocks/Use 12.6% 12.7% 15.7% 17.5% 17.8% 16.8% 17.6% Farm Revenue (Mil USD) $52,597 $49,103 $50,746 $46,648 $46,080 $53,144 $57,065 Sources: USDA, US Census Bureau (Trade), Informa Agribusiness Consulting (Revenues and Forecast)
91.5 84.0 178.5 2,620 14,991 40 17,652 5,781 6,943 5,377 12,725 2,241 14,966 2,686 17.9% $57,251
Planted Acres
15/16
16/17
17/18
18/19
19/20
66
The Impact of Delays in Chinese Approvals of Biotech Crops ARGENTINA CORN SUPPLY AND DEMAND (Milllion Tonnes/Million Hectares) Area Yield Carryin (Mar 1) Production Imports Total Supply Feed & Residual Food/Seed/Ind Domestic Use Exports Total Use Carryout (Feb 28) Stocks/Use Farm Revenue (Mil USD)
14/15
15/16
16/17
17/18
18/19
19/20
20/21
21/22
3.4 7.6 1.3 26.0 0.0 27.3 5.8 3.0 8.8 17.1 25.9 1.4 5.4% $5,018
3.5 8.5 1.4 29.8 0.0 31.2 6.0 3.3 9.3 19.0 28.3 2.9 10.2% $4,944
3.6 8.3 2.9 30.0 0.0 32.9 6.6 3.3 9.9 21.6 31.5 1.4 4.4% $5,362
4.9 8.4 1.4 41.0 0.0 42.4 8.4 3.5 11.9 23.5 35.4 7.0 19.7% $7,263
5.2 8.2 7.0 42.0 0.0 49.0 8.3 3.7 12.0 29.0 41.0 8.0 19.5% $7,210
5.0 8.2 8.0 41.0 0.0 49.0 8.3 3.7 12.0 29.0 41.0 8.0 19.5% $7,652
5.0 8.4 8.0 41.8 0.0 49.8 8.6 3.8 12.4 29.6 42.0 7.8 18.5% $8,037
5.1 8.5 7.8 43.8 0.0 51.6 9.0 4.0 13.0 31.0 44.0 7.7 17.4% $8,421
Sources: USDA, Global Trade Tracker (Trade), Informa Agribusiness Consulting (Revenues, Forecast)
BRAZIL CORN SUPPLY AND DEMAND (Milllion Tonnes/Million Hectares) Area Yield Carryin (Mar 1) Production Imports Total Supply Feed & Residual Food/Seed/Ind Domestic Use Exports Total Use Carryout (Feb 28) Stocks/Use Farm Revenue (Mil USD)
14/15
15/16
16/17
17/18
15.8 5.1 9.2 80.1 0.8 90.0 45.9 9.0 54.9 21.1 76.0 14.0 18.4% $15,395
15.7 5.4 14.0 84.7 0.3 99.0 46.6 9.0 55.6 35.6 91.1 7.8 8.6% $12,871
16.0 4.2 7.8 66.6 3.4 77.9 47.0 8.5 55.5 12.2 67.7 10.2 15.0% $11,267
17.5 5.7 10.2 99.5 0.8 110.4 48.0 9.0 57.0 34.1 91.1 19.3 21.2% $16,969
18/19
19/20
20/21
21/22
16.9 5.4 19.3 92.0 0.3 111.6 49.5 9.3 58.8 29.0 87.8 23.8 27.1% $14,775
18.0 5.4 23.8 97.0 0.5 121.3 49.5 9.6 59.1 28.2 87.3 34.0 39.0% $17,013
17.9 5.5 34.0 97.9 0.5 132.4 50.1 9.9 60.0 38.6 98.7 33.7 34.2% $17,651
18.2 5.5 33.7 101.0 0.5 135.2 51.6 10.4 62.0 39.3 101.3 33.9 33.4% $18,211
Sources: USDA, Global Trade Tracker (Trade), Informa Agribusiness Consulting (Revenues, Forecast)
67
The Impact of Delays in Chinese Approvals of Biotech Crops CANADA CORN SUPPLY AND DEMAND (Milllion Tonnes/Million Hectares) Baseline Area Yield Carryin (Mar 1) Production Imports Total Supply Feed & Residual Food/Seed/Ind Domestic Use Exports Total Use Carryout (Feb 28) Stocks/Use Farm Revenue (Mil USD)
14/15
15/16
16/17
17/18
18/19
19/20
20/21
21/22
1.2 9.4 1.6 11.5 1.7 14.7 7.4 5.4 12.8 0.5 13.3 1.4 10.5% $1,673
1.3 10.3 1.4 13.6 1.2 16.2 7.1 5.3 12.4 1.6 13.9 2.2 16.1% $1,927
1.3 10.0 2.2 13.2 1.9 17.3 7.1 5.4 12.5 2.4 14.9 2.4 16.2% $1,741
1.4 10.1 2.4 14.3 1.0 17.7 8.7 5.4 14.1 1.4 15.5 2.2 14.2% $1,803
1.5 10.0 2.2 14.5 1.0 17.7 7.5 5.4 12.9 1.3 14.2 3.5 24.7% $1,798
1.4 10.2 3.5 14.7 1.0 19.2 7.8 5.5 13.3 1.6 14.9 4.3 29.1% $2,104
1.5 10.3 4.3 15.3 1.0 20.6 8.2 5.7 13.9 1.8 15.7 4.9 31.3% $2,294
1.5 10.5 4.9 15.4 1.0 21.3 8.6 5.8 14.5 1.8 16.3 5.0 30.6% $2,316
Sources: USDA, Global Trade Tracker (Trade), Informa Agribusiness Consulting (Forecast) CHINA CORN SUPPLY AND DEMAND (Milllion Tonnes/Million Hectares) Area Yield Carryin (Oct 1) Production Imports Total Supply Feed & Residual Food/Seed/Ind Domestic Use Exports Total Use Carryout (Sep 30) Stocks/Use
14/15
15/16
16/17
17/18
18/19
19/20
20/21
21/22
37.1 5.8 81.3 215.6 5.5 302.5 140.0 62.0 202.0 0.0 202.0 100.5 49.7%
38.1 5.9 100.5 224.6 3.2 328.3 153.5 64.0 217.5 0.0 217.5 110.8 50.9%
36.8 6.0 110.8 219.6 2.7 333.0 158.0 70.0 228.0 0.0 228.0 105.0 46.0%
35.0 6.1 105.0 213.0 2.5 320.5 165.0 73.0 238.0 0.1 238.1 82.4 34.6%
35.0 6.0 82.4 210.5 5.0 297.9 168.0 73.0 241.0 0.1 241.1 56.9 23.6%
36.0 6.1 56.9 219.9 9.8 286.6 165.5 75.8 241.3 0.1 241.4 45.2 18.7%
37.0 6.2 45.2 229.3 10.8 285.4 164.6 79.7 244.2 0.1 244.3 41.0 16.8%
36.8 6.3 41.0 231.6 8.5 281.2 161.7 82.1 243.8 0.1 243.9 37.3 15.3%
Sources: USDA, Global Trade Tracker (Trade), Informa Agribusiness Consulting (Forecast)
In response to growing grain stocks, the government of China ended its corn purchases for the temporary reserve in 2016. China’s government has incentivized the consumption of its corn reserves in an attempt to draw down on those stocks. This drawdown in stocks is expected to be the case moving forward, with the stocks-to-use ratio decreasing from 51% at its peak in 2015/16 to 15% by the end of the outlook. This is expected to be driven by usage of corn exceeding production of corn, eventually leading to an uptick in imports beyond the 2017 TRQ, set at 7.2 MMT. Currently and in the short term, imports of corn are well below the TRQ level. However, the fundamentals of the situation will likely push China into some easing of these restrictions on corn imports, as demand is expected to be very strong
68
The Impact of Delays in Chinese Approvals of Biotech Crops
and production will not be able to increase to cover it and meet the target of winding down ending stocks, with significant policies that encouraged production having been withdrawn. A key demand source is livestock feeding; this is key both in terms of an increase in the number of animals to feed, but, just as importantly, an increase in feeding intensity as more animals are brought from “back-yard farming” into more intensive modern feeding programs utilizing grains. This demand pressure could be further exacerbated by an increase in ethanol production. A key caveat remains though. There are some in the industry who believe China’s current ending stocks could be as much as double the levels reported by the USDA and assumed by Informa. If this is indeed the case, then this pressure on imports and the TRQ would likely not materialize. US soybean stocks are projected to recede despite rising production throughout the baseline outlook (Exhibit 8). This rising production is projected to be more than offset by an increase in domestic crush as well as increasing net exports. Currently stocks are close to record highs, but they are forecast to decline over time given strong global demand driven by increases in destination crush markets, particularly in China.7 China typically will import whole soybeans to crush into meal and oil at local facilities in order to supply its livestock industry. Over the last decade, soybean meal usage in China increased by 40 MMT, and over the next five years this usage is forecast to increase by approximately 30 MMT (Exhibit 8). Increasing livestock production will require more protein meal moving forward, making China even more dependent on soybean imports to meet its crush as domestic production is limited. China imports soybeans from all of the major producers. South American production and exports of soybeans are expected to continue to expand to meet growing global demand. Behind this production, harvested area is forecast to increase by over 10%, with Brazil accounting for most of this increase. A majority of this increase in production will be exported, either as whole soybeans or as meal and oil. Brazil will continue to dominate the whole soybean exports from South America, exporting over half of its production. Argentina has an export tax system in place that incentivizes the export of soybean meal and oil over whole soybeans. As a result, Argentine domestic crush will continue to be far larger than exports of whole soybeans.
7
Note that the events in Vistive Gold soybeans were excluded from the analysis since they were the only specialty product included among the Phase II events and are expected to have very limited acreage going forward in comparison to the commodity-oriented events.
69
The Impact of Delays in Chinese Approvals of Biotech Crops
Exhibit 49: Soybean Supply/Demand Baseline Outlook in Major Producing Countries, and China Soybean Complex Fundamentals US SOYBEAN SUPPLY AND DEMAND (Million Bushels/Million Acres) Planted Acres Harvested Acres Yield Carryin (Sep 1) Production Imports Total Supply Crush Food/Seed/Residual Exports Total Use Carryout (Aug 31) Stocks/Use Farm Revenue (Mil USD)
14/15
15/16
16/17
17/18
83.3 82.6 47.5 92 3,927 18 4,037 1,873 130 1,843 3,847 191 5.0% $39,664
82.7 81.7 48.0 191 3,926 31 4,148 1,886 129 1,936 3,951 197 5.0% $35,141
83.4 82.7 52.0 197 4,296 22 4,515 1,899 141 2,174 4,214 301 7.2% $40,813
90.2 89.5 49.5 301 4,425 20 4,747 1,935 134 2,250 4,319 428 9.9% $39,385
18/19
19/20
20/21
21/22
89.6 88.9 49.5 428 4,397 20 4,845 1,950 137 2,350 4,437 408 9.2% $40,457
89.8 88.8 49.8 408 4,417 20 4,845 1,965 177 2,307 4,448 397 8.9% $39,890
88.9 87.9 50.0 397 4,391 20 4,807 1,990 177 2,254 4,422 385 8.7% $40,092
89.7 88.7 50.5 385 4,480 20 4,885 2,032 174 2,297 4,503 382 8.5% $43,059
Sources: USDA, US Census Bureau (Trade), Informa Agribusiness Consulting (Revenues, Forecast) ARGENTINA SOYBEAN SUPPLY AND DEMAND (Milllion Tonnes/Million Hectares) 14/15 Area Yield Carryin (Mar 1) Production Imports Total Supply Crush Food, Feed, & Residual Exports Total Use Carryout (Feb 28) Stocks/Use Farm Revenue (Mil USD)
19.3 2.8 19.5 53.4 0.0 72.9 36.2 3.6 7.8 47.6 25.3 53.1% $24,884
15/16
16/17
19.3 19.5 3.2 2.9 25.3 31.7 61.4 56.8 0.1 1.3 86.8 89.8 40.2 43.3 4.2 4.3 10.7 10.5 55.1 58.1 31.7 31.7 57.5% 54.6% $21,674 $22,436
17/18
18.4 3.1 31.7 57.8 1.3 90.8 44.2 4.5 6.3 54.9 35.9 65.4% $21,155
18/19
19/20
20/21
21/22
18.5 3.0 35.9 55.5 1.0 92.4 43.9 3.8 10.0 57.6 34.8 60.3% $21,446
19.0 3.1 34.8 58.0 1.0 93.8 43.9 3.8 11.1 58.8 35.0 59.5% $21,969
19.2 3.1 35.0 59.2 1.0 95.1 44.4 4.9 20.5 69.9 25.3 36.2% $21,524
19.1 3.1 25.3 59.4 1.0 85.7 44.6 5.1 10.5 60.2 25.5 42.3% $23,093
Sources: USDA, Global Trade Tracker (Trade), Informa Agribusiness Consulting (Production Value, Forecast)
70
The Impact of Delays in Chinese Approvals of Biotech Crops BRAZIL SOYBEAN SUPPLY AND DEMAND (Milllion Tonnes/Million Hectares) Area Yield Carryin (Mar 1) Production Imports Total Supply Crush Food, Feed, & Residual Exports Total Use Carryout (Feb 28) Stocks/Use Farm Revenue (Mil USD)
14/15
15/16
16/17
17/18
30.1 2.9 15.4 86.7 0.6 102.6 36.9 3.2 46.8 86.8 15.8 18.2% $41,789
32.1 3.0 15.8 97.2 0.3 113.3 40.4 3.4 50.6 94.4 18.9 20.0% $35,770
33.3 2.9 18.9 96.5 0.4 115.8 39.7 3.5 54.3 97.6 18.2 18.7% $38,697
33.9 3.4 18.2 114.0 0.3 132.5 41.3 3.7 62.6 107.5 25.0 23.3% $43,206
18/19
19/20
20/21
21/22
35.0 3.2 25.0 111.0 0.4 136.4 42.7 4.1 67.8 114.6 21.8 19.0% $44,275
36.0 3.2 21.8 115.0 0.4 137.2 43.4 4.1 68.2 115.7 21.5 18.6% $45,313
36.6 3.2 21.5 118.4 0.4 140.3 43.9 5.2 57.7 106.7 33.5 31.4% $42,515
37.0 3.3 33.5 121.0 0.4 154.9 44.4 5.3 75.9 125.6 29.3 23.3% $48,565
Sources: USDA, Global Trade Tracker (Trade), Informa Agribusiness Consulting (Production Value, Forecast)
CANADA SOYBEAN SUPPLY AND DEMAND (Milllion Tonnes/Million Hectares) Area Yield Carryin (Mar 1) Production Imports Total Supply Crush Food, Feed, & Residual Exports Total Use Carryout (Feb 28) Stocks/Use Farm Revenue (Mil USD)
14/15
15/16
16/17
17/18
18/19
19/20
20/21
21/22
2.2 2.7 0.2 6.0 0.3 6.6 1.8 0.6 3.8 6.2 0.5 7.6% $2,245
2.2 2.9 0.5 6.4 0.3 7.2 2.0 0.6 4.3 6.9 0.3 4.4% $2,095
2.2 3.0 0.3 6.5 0.5 7.2 2.0 0.4 4.6 7.0 0.3 4.0% $2,256
2.9 2.8 0.3 8.3 0.5 9.0 1.9 0.6 5.6 8.1 0.9 11.7% $2,721
3.0 2.8 0.9 8.5 0.3 9.7 1.9 0.6 5.9 8.4 1.3 15.2% $2,873
3.1 2.8 1.3 8.7 0.3 10.3 1.9 0.8 5.5 8.2 2.1 25.2% $2,898
2.9 2.9 2.1 8.4 0.3 10.8 1.9 0.8 6.5 9.2 1.6 17.2% $2,832
3.1 2.9 1.6 8.8 0.3 10.7 2.0 0.8 6.6 9.3 1.4 15.0% $3,119
Sources: USDA, Global Trade Tracker (Trade), Informa Agribusiness Consulting (Production Value, Forecast)
71
The Impact of Delays in Chinese Approvals of Biotech Crops
CHINA SOYBEAN COMPLEX: BASLINE FORECAST 14/15
15/16
16/17
17/18
18/19
19/20
CHINA SOYBEAN SUPPLY AND DEMAND (Milllion Tonnes/Million Hectares) Area 6.8 6.5 7.2 8.0 8.5 8.7 Yield 1.8 1.8 1.8 1.9 1.8 1.8 Carryin (Oct 1) 13.8 17.0 16.9 19.7 23.6 25.9 Production 12.2 11.8 12.9 15.0 15.5 16.1 Imports 78.4 83.2 93.5 101.0 105.3 108.8 Total Supply 104.4 112.0 123.3 135.7 144.3 150.8 Crush 74.5 81.0 87.0 97.5 103.5 110.7 Food, Feed, & Residual 12.7 14.0 15.0 14.5 14.8 15.5 Exports 0.1 0.1 1.6 0.1 0.1 0.3 Total Use 87.3 95.1 103.6 112.1 118.4 126.5 Carryout (Sep 30) 17.0 16.9 19.7 23.6 25.9 24.3 Stocks/Use 19.5% 17.8% 19.0% 21.0% 21.9% 19.2% CHINA SOYBEAN MEAL SUPPLY AND DEMAND (Milllion Tonnes/Million Hectares) Crush 74.5 81.0 87.0 97.5 103.5 110.7 Carryin 0.0 0.0 0.0 0.0 0.0 0.0 Production 59.0 64.2 70.5 77.2 81.9 85.2 Imports 0.1 0.0 0.1 0.1 0.1 0.1 Total Supply 59.1 64.2 70.6 77.3 81.9 85.2 Domestic Use 57.5 62.3 69.4 75.9 80.4 84.4 Exports 1.6 1.9 1.2 1.4 1.5 0.9 Total Use 59.1 64.2 70.6 77.3 81.9 85.2 CHINA SOYBEAN OIL SUPPLY AND DEMAND (Milllion Tonnes/Million Hectares) Carryin 1.0 0.8 0.5 0.7 0.8 0.7 Production 13.3 14.5 15.9 17.5 18.5 19.3 Imports 0.8 0.6 0.8 0.5 0.4 1.0 Total Supply 15.1 15.9 17.2 18.7 19.7 21.0 Food Use 14.2 15.3 16.4 17.8 18.7 19.5 Industrial Use 0.0 0.0 0.0 0.0 0.0 0.0 Exports 0.1 0.1 0.1 0.2 0.2 0.8 Total Use 14.3 15.3 16.5 18.0 18.9 20.3 Carryout 0.8 0.5 0.7 0.8 0.7 0.7
20/21
21/22
8.4 1.9 24.3 15.7 118.3 158.3 116.8 15.7 0.4 132.8 25.4 19.1%
8.7 1.9 25.4 16.5 124.0 165.9 123.0 15.8 0.6 139.4 26.5 19.0%
116.8 0.0 90.6 0.1 90.7 89.6 1.1 90.7
123.0 0.0 97.4 0.1 97.5 96.1 1.4 97.5
0.7 20.5 1.0 22.3 20.6 0.0 0.9 21.5 0.7
0.7 22.0 1.0 23.8 20.7 0.0 2.3 23.0 0.8
Sources: USDA, Global Trade Tracker (Trade), Informa Agribusiness Consulting (Forecast)
Canada is one of the world’s most important players in the canola/rapeseed market. Canada’s production ranks second only behind the EU, producing approximately 95% of the volume that the EU did in 2016/17. While the EU may be the world’s largest producer of the oilseed, it is also one of the world’s largest consumers and traditionally is a net importer of canola/rapeseed. Canada is by far the largest canola exporter in the world, accounting for over 2/3 of world exports. China is also a large producer of rapeseed, and like the EU is a major consumer of the oilseed, having to rely on imports to meet demand. Canada has accounted over 90% of China’s canola imports since 2011, reaching as high as 99% in some of the years. Australia has gained market
72
The Impact of Delays in Chinese Approvals of Biotech Crops
share in China somewhat in recent years, but still falls well below Canada’s volume into the country. Moving forward, Canada is expected to see canola area rebound significantly in 2017/18 and then level off over the outlook. Due to expected yield declines in 2017/18, Canadian production is only expected to increase by 3.5% (Exhibit 50). Exhibit 50: Canola Supply/Demand Baseline Outlook in Canada and China CANADA CANOLA SUPPLY AND DEMAND (Milllion Tonnes/Million Hectares) Area Yield Carryin (Mar 1) Production Imports Total Supply Crush Seed & Residual Exports Total Use Carryout (Feb 28) Stocks/Use Farm Revenue (Mil USD)
14/15
15/16
16/17
17/18
18/19
19/20
20/21
21/22
8.3 2.0 3.0 16.4 0.1 19.5 7.4 0.4 9.2 16.9 2.6 15.2% $6,072
8.3 2.2 2.6 18.4 0.1 21.1 8.3 0.3 10.3 19.0 2.1 11.0% $6,509
8.1 2.4 2.1 19.6 0.1 21.8 9.2 0.2 11.0 20.4 1.3 6.6% $7,166
9.2 2.2 1.3 20.3 0.1 21.7 9.2 0.3 11.1 20.5 1.3 6.3% $7,756
9.2 2.4 1.3 22.4 0.1 23.8 9.3 0.4 11.1 20.8 3.0 14.4% $8,356
9.1 2.3 3.0 21.2 0.1 24.3 10.1 0.4 11.6 22.1 2.2 9.8% $7,748
8.9 2.4 2.2 21.0 0.1 23.3 10.1 0.4 11.5 22.0 1.3 6.0% $7,770
9.4 2.4 1.3 22.5 0.1 24.0 10.9 0.4 11.0 22.3 1.7 7.5% $8,772
Sources: USDA, Global Trade Tracker (Trade), Informa Agribusiness Consulting (Production Value, Forecast) CHINA CANOLA SUPPLY AND DEMAND (Milllion Tonnes/Million Hectares) 14/15 Area Yield Carryin (Oct 1) Production Imports Total Supply Crush Food, Feed, & Residual Exports Total Use Carryout (Sep 30) Stocks/Use
7.6 1.9 1.0 14.8 4.6 20.4 18.3 0.6 0.0 18.9 1.5 7.9%
15/16
7.5 2.0 1.5 14.9 4.0 20.4 18.5 0.6 0.0 19.1 1.3 7.0%
16/17
7.0 1.9 1.3 13.5 4.1 18.9 16.8 0.6 0.0 17.4 1.5 8.9%
17/18
6.9 2.0 1.5 13.6 3.9 19.0 17.1 0.6 0.0 17.7 1.4 7.9%
18/19
19/20
20/21
21/22
7.0 2.0 1.4 13.8 4.5 19.7 18.0 0.6 0.0 18.6 1.1 6.0%
7.0 2.0 1.1 13.9 4.9 19.9 17.9 0.8 0.0 18.7 1.2 6.3%
6.9 2.0 1.2 13.8 5.1 20.0 18.0 0.8 0.0 18.8 1.3 6.7%
6.9 2.0 1.3 14.0 5.2 20.4 18.3 0.8 0.0 19.1 1.3 7.0%
Sources: USDA, Global Trade Tracker (Trade), Informa Agribusiness Consulting (Forecast)
73
The Impact of Delays in Chinese Approvals of Biotech Crops
B. The Counterfactual Scenario: If Chinese Approvals Occur in a Timelier Manner Moving Forward The “counterfactual scenario,” reflects a timeline for commercialization of the Phase II biotech events that is consistent with having an effectively functioning regulatory system in China. It was generally assumed that commercialization of the events would take place three years earlier in the absence of delays in Chinese approvals; this and other assumptions central to the counterfactual scenario were discussed in Section VI. Informa developed additional crop supply/demand balance sheets and forecasts that could develop under the counterfactual scenario and compared these to Informa’s baseline outlook. From this, one can quantify the impacts that Chinese delays are expected to have on the commodity sector over the next five years. One key difference in the US between the Phase I and the Phase II analyses is the incidence of the impact by crop. In the forward looking “counterfactual scenario” in Phase II, there is a greater impact in soybean biotech events than in Phase I, whereas the Phase I impact was largely being driven by corn.
1. Impact on the Corn Market (a) United States In the counterfactual scenario, production increases range from 239-625 million bu annually compared to the baseline; this is driven by yield increases as high as 7.4 bu/acre as farmers adopt the approved biotech events (Exhibit 9). This increase in production is used in several areas, with the largest share occurring in exports, with increases ranging from approximately 110-350 million bu/year. Another key category is in feed, increasing by roughly 70-180 million bu depending on the year. Ending stocks are expected to increase over the baseline outlook, by 53 million bu in 2017/18 and rising to a nearly 160 million bu increase before slowing its growth in the final year. The value of US corn production would see a boost under the counterfactual scenario; the initial two years of the outlook would see production value rising from approximately $360 million to over $550 million. This would be expected to spike to an over $1 billion increase in 2019/20 over the baseline before settling at a nearly $600 million increase at the end of the outlook.
74
The Impact of Delays in Chinese Approvals of Biotech Crops
Exhibit 51: Counterfactual Scenario: US Corn Supply/Demand, and Difference from Baseline Outlook US CORN: COUNTERFACTUAL CASE (Million Bushels/Million Acres) 17/18
18/19
19/20
20/21
21/22
91.4 84.0 179.0 2,574 15,040 40 17,655 5,742 6,955 5,415 12,697 2,268 14,965 2,690 18.0% $46,631
91.3 83.8 181.4 2,690 15,197 40 17,927 5,985 6,973 5,368 12,959 2,347 15,306 2,621 17.1% $54,149
92.3 84.8 183.7 2,621 15,574 40 18,234 5,900 7,006 5,316 12,906 2,551 15,457 2,777 18.0% $58,017
91.5 84.0 184.2 2,777 15,476 40 18,293 5,926 7,000 5,377 12,926 2,548 15,473 2,820 18.2% $57,838
18/19
19/20
20/21
21/22
0.0 0.0 0.0 Harvested Acres 0.0 0.0 0.0 Yield 2.9 4.9 7.1 Carryin (Sep 1) 22 53 96 Production 239 412 595 Imports 0 0 0 Total Supply 261 465 691 Feed & Residual 67 117 170 Food/Seed/Ind 28 49 70 Ethanol for Fuel 0 0 0 Domestic Use 95 166 241 Exports 112 203 312 Total Use 208 368 553 Carryout (Aug 31) 53 96 138 Stocks/Use 0.1% 0.2% 0.3% Farm Revenue (Mil USD) $362.83 $550.76 $1,005.37 Source: Informa Agribusiness Consulting
0.0 0.0 7.4 138 625 0 763 182 72 0 254 352 606 157 0.3% $951.64
0.0 0.0 5.8 157 485 0 641 145 56 0 201 306 507 134 0.3% $587.24
Planted Acres Harvested Acres Yield Carryin (Sep 1) Production Imports Total Supply Feed & Residual Food/Seed/Ind Ethanol for Fuel Domestic Use Exports Total Use Carryout (Aug 31) Stocks/Use Farm Revenue (Mil USD)
90.4 83.1 178.3 2,317 14,816 45 17,178 5,667 6,924 5,415 12,591 2,012 14,604 2,574 17.6% $47,011
DIFFERENCE FROM BASELINE 17/18 Planted Acres
75
The Impact of Delays in Chinese Approvals of Biotech Crops
(b) Other Key Producers and Exporters South American corn producers are less impacted than the US under the counterfactual scenario, with the impacts occurring in a similar rise-and-fall pattern but to a lesser degree. Under the counterfactual scenario, Argentina would be expected to see an increase in production of corn as high as 980,000 MT in 2020/21 (Exhibit 52). Most of this increase in production throughout the outlook period is absorbed in the form of exports out of Argentina, with a smaller share finding use in feed. At the end of 2016, Argentina abolished its export tax on corn, leading to an expected increase in corn exports relative to history, and in the counterfactual scenario this is reflected in exports capturing a larger share of the increased production. Argentine ending stocks would also see an increase over the baseline outlook. The value of corn production would follow a similar pattern as the US, peaking at $70 million in 2019/20 before moderating over the final two years of the outlook. Impacts in Brazil would be modestly higher than in Argentina, with corn production increasing by as much as nearly 2.3 MMT under the counterfactual scenario (Exhibit 11). However, unlike Argentina, much of this would be absorbed into feed as opposed to exports in order to support increasing feeding requirements for livestock. Increases in value of production over the baseline follow a similar pattern to Argentina, peaking in 2019/20 at over $130 million before moderating.
76
The Impact of Delays in Chinese Approvals of Biotech Crops
Exhibit 52: Counterfactual Scenario: Argentina Corn Supply/Demand and Difference from Baseline Outlook ARGENTINA CORN: COUNTERFACTUAL CASE (Milllion Tonnes/Million Hectares) Area Yield Carryin (Mar 1) Production Imports Total Supply Feed & Residual Food/Seed/Ind Domestic Use Exports Total Use Carryout (Feb 28) Stocks/Use Farm Revenue (Mil USD)
17/18
18/19
19/20
20/21
21/22
4.9 8.4 1.4 41.3 0.0 42.7 8.5 3.5 12.0 23.7 35.7 7.1 19.8% $7,289
5.2 8.3 7.1 42.6 0.0 49.6 8.4 3.7 12.1 29.4 41.5 8.1 19.6% $7,243
5.0 8.4 8.1 41.9 0.0 50.0 8.5 3.7 12.2 29.6 41.8 8.2 19.7% $7,722
5.0 8.6 8.2 42.8 0.0 51.1 8.8 3.8 12.6 30.3 43.0 8.1 18.8% $8,105
5.1 8.7 8.1 44.8 0.0 52.8 9.2 4.0 13.2 31.7 44.9 7.9 17.7% $8,487
18/19
19/20
20/21
21/22
0.0 0.1 0.09 0.56 0.00 0.65 0.11 0.00 0.11 0.38 0.50 0.16 0.1% $33
0.0 0.2 0.16 0.89 0.00 1.05 0.18 0.00 0.18 0.62 0.80 0.25 0.2% $70
0.0 0.2 0.25 0.98 0.00 1.23 0.21 0.00 0.21 0.73 0.94 0.29 0.3% $68
0.0 0.2 0.29 0.92 0.00 1.20 0.21 0.00 0.21 0.72 0.93 0.27 0.2% $66
DIFFERENCE FROM BASELINE 17/18
0.0 Yield 0.1 Carryin (Mar 1) 0.02 Production 0.34 Imports 0.00 Total Supply 0.35 Feed & Residual 0.07 Food/Seed/Ind 0.00 Domestic Use 0.07 Exports 0.19 Total Use 0.26 Carryout (Feb 28) 0.09 Stocks/Use 0.1% Farm Revenue (Mil USD) $26 Source: Informa Agribusiness Consulting Area
77
The Impact of Delays in Chinese Approvals of Biotech Crops
Exhibit 53: Counterfactual Scenario: Brazil Corn Supply/Demand, and Difference from Baseline Outlook BRAZIL CORN: COUNTERFACTUAL CASE (Milllion Tonnes/Million Hectares) 17/18
18/19
19/20
20/21
21/22
16.9 5.5 19.5 93.2 0.3 113.1 50.1 9.3 59.4 29.4 88.8 24.3 27.3% $14,845
18.0 5.5 24.3 99.1 0.5 123.9 50.5 9.6 60.1 28.8 88.9 34.9 39.3% $17,145
17.9 5.6 34.9 100.2 0.5 135.6 51.3 9.9 61.2 39.6 100.8 34.8 34.5% $17,773
18.2 5.7 34.8 103.1 0.5 138.4 52.8 10.4 63.2 40.3 103.5 34.9 33.8% $18,327
18/19
19/20
20/21
21/22
0.0 0.0 Yield 0.0 0.1 Carryin (Mar 1) 0.06 0.22 Production 0.82 1.23 Imports 0.00 0.00 Total Supply 0.87 1.46 Feed & Residual 0.38 0.65 Food/Seed/Ind 0.00 0.00 Domestic Use 0.38 0.65 Exports 0.27 0.38 Total Use 0.65 1.03 Carryout (Feb 28) 0.22 0.43 Stocks/Use 0.1% 0.2% Farm Revenue (Mil USD) $63 $70 Source: Informa Agribusiness Consulting
0.0 0.1 0.43 2.12 0.00 2.55 1.04 0.00 1.04 0.59 1.63 0.92 0.3% $132
0.0 0.1 0.92 2.28 0.00 3.20 1.21 0.00 1.21 0.93 2.14 1.05 0.3% $122
0.0 0.1 1.05 2.12 0.00 3.17 1.21 0.00 1.21 0.92 2.13 1.04 0.3% $116
Area Yield Carryin (Mar 1) Production Imports Total Supply Feed & Residual Food/Seed/Ind Domestic Use Exports Total Use Carryout (Feb 28) Stocks/Use Farm Revenue (Mil USD)
17.5 5.7 10.2 100.3 0.8 111.3 48.4 9.0 57.4 34.4 91.7 19.5 21.3% $17,032
DIFFERENCE FROM BASELINE 17/18 Area
78
The Impact of Delays in Chinese Approvals of Biotech Crops
Exhibit 54: Counterfactual Scenario: Canada Corn Supply/Demand, and Difference from Baseline Outlook CANADA CORN: COUNTERFACTUAL CASE (Milllion Tonnes/Million Hectares) Area Yield Carryin (Mar 1) Production Imports Total Supply Feed & Residual Food/Seed/Ind Domestic Use Exports Total Use Carryout (Feb 28) Stocks/Use Farm Revenue (Mil USD)
17/18
18/19
19/20
20/21
21/22
1.4 10.3 2.4 14.5 0.9 17.9 8.9 5.4 14.2 1.4 15.7 2.2 14.2% $1,815
1.5 10.3 2.2 14.9 0.9 18.0 7.7 5.4 13.1 1.3 14.4 3.5 24.5% $1,816
1.4 10.5 3.5 15.3 0.8 19.6 8.1 5.5 13.6 1.6 15.2 4.4 28.6% $2,141
1.5 10.7 4.4 15.9 0.8 21.0 8.5 5.7 14.2 1.9 16.1 4.9 30.7% $2,325
1.5 10.8 4.9 15.9 0.9 21.7 8.9 5.8 14.7 1.9 16.6 5.0 30.2% $2,334
17/18
18/19
19/20
20/21
21/22
0.00 0.26 0.02 0.38 -0.15 0.25 0.20 0.00 0.20 0.03 0.23 0.02 0% $18
0.00 0.40 0.02 0.57 -0.21 0.39 0.30 0.00 0.30 0.06 0.37 0.02 -1% $36
0.00 0.40 0.02 0.59 -0.20 0.41 0.32 0.00 0.32 0.07 0.38 0.02 -1% $31
0.00 0.31 0.02 0.46 -0.15 0.33 0.26 0.00 0.26 0.05 0.31 0.02 0% $18
DIFFERENCE FROM BASELINE Area Yield Carryin (Mar 1) Production Imports Total Supply Feed & Residual Food/Seed/Ind Domestic Use Exports Total Use Carryout (Feb 28) Stocks/Use Farm Revenue (Mil USD)
0.00 0.15 0.00 0.22 -0.06 0.15 0.13 0.00 0.13 0.02 0.15 0.02 0% $12
Source: Informa Agribusiness Consulting
79
The Impact of Delays in Chinese Approvals of Biotech Crops
(c) China Similar to Phase I, China’s corn area, yield, and production would be expected to remain essentially unchanged from the baseline under the counterfactual scenario. China typically has not authorized the planting of biotech seed, and this was assumed to also be the case under the counterfactual scenario. Instead, timelier approvals by the Chinese government would be reflected in imports of corn and distillers’ grains containing the various events into the country. This results in an increase in imports of approximately 40,000 MT to 120,000 MT of corn over the baseline outlook, depending on the year (Exhibit 12). In recent years, Chinese corn prices have been well above world prices; however, with policy developments in the country, the difference in prices has been decreasing but still remains a factor. Under the counterfactual scenario, there would be an increase in world corn production and stocks as a result of the increased yields from adoption of biotech events. This leads to slightly lower prices for corn imported into China. The increase in imports would then be absorbed into additional feeding demand, not adding to the ending stocks. China is experiencing a livestock inventory expansion coupled with a strong increase in feeding intensity of its animals, as more animals are moved from less sophisticated feeding into more modern feeding operations. Exhibit 55: Counterfactual Scenario: China Corn Supply/Demand, and Difference from Baseline Outlook CHINA CORN: COUNTERFACTUAL CASE (Milllion Tonnes/Million Hectares) Area Yield Carryin (Oct 1) Production Imports Total Supply Feed & Residual Food/Seed/Ind Domestic Use Exports Total Use Carryout (Sep 30) Stocks/Use
17/18
18/19
19/20
20/21
21/22
35.0 6.1 105.0 213.0 2.5 320.5 165.0 73.0 238.0 0.1 238.1 82.4 34.6%
35.0 6.0 82.4 210.5 5.1 298.0 168.1 73.0 241.1 0.1 241.1 56.9 23.6%
36.0 6.1 56.9 219.9 9.9 286.7 165.6 75.8 241.4 0.1 241.5 45.2 18.7%
37.0 6.2 45.2 229.3 10.9 285.5 164.7 79.7 244.4 0.1 244.4 41.0 16.8%
36.8 6.3 41.0 231.6 8.6 281.3 161.8 82.1 243.9 0.1 244.0 37.3 15.3%
80
The Impact of Delays in Chinese Approvals of Biotech Crops
DIFFERENCE FROM BASELINE 17/18 Area Yield Carryin (Mar 1) Production Imports Total Supply Feed & Residual Food/Seed/Ind Domestic Use Exports Total Use Carryout (Feb 28) Stocks/Use
0.0 0.0 0.00 0.00 0.04 0.04 0.04 0.00 0.04 0.00 0.04 0.00 0.0%
18/19
19/20
20/21
21/22
0.0 0.0 0.00 0.00 0.07 0.07 0.07 0.00 0.07 0.00 0.07 0.00 0.0%
0.0 0.0 0.00 0.00 0.11 0.11 0.11 0.00 0.11 0.00 0.11 0.00 0.0%
0.0 0.0 0.00 0.00 0.12 0.12 0.12 0.00 0.12 0.00 0.12 0.00 0.0%
0.0 0.0 0.00 0.00 0.11 0.11 0.11 0.00 0.11 0.00 0.11 0.00 0.0%
Source: Informa Agribusiness Consulting
2. Impact on the Soybean Market (a) United States The impact on the US soybean market from Chinese delays is expected to be significantly higher going forward than historically, leading to a more diverse range of impacts across crops in Phase II. Moving forward, there is expected to be a greater number of biotech events for soybeans that could be impacted by any delays. The increased adoption of biotech events in the U.S soybean sector under the counterfactual scenario is reflected in increased yields throughout the outlook, leading to increased production ranging from nearly 28 million bu to over 65 million bu per year (Exhibit 13). A small portion of this increased production would be consumed as increased domestic crush, with the largest amount being reflected in export increases relative to the baseline. Impacts on the value of soybean production follow a similar pattern to corn by rising to a peak of $416 million before moderating in the out years of the forecast.
81
The Impact of Delays in Chinese Approvals of Biotech Crops
Exhibit 56: Counterfactual Scenario: US Soybean Supply/Demand, and Difference from Baseline Outlook US SOYBEANS: COUNTERFACTUAL CASE (Million Bushels/Million Acres) 17/18 Planted Acres Harvested Acres Yield Carryin (Sep 1) Production Imports Total Supply Crush Food/Seed/Residual Exports Total Use Carryout (Aug 31) Stocks/Use Farm Revenue (Mil USD)
90.2 89.5 49.8 302 4,453 20 4,775 1,941 135 2,268 4,344 431 9.9% $39,559
18/19
19/20
20/21
21/22
89.6 88.9 50.0 431 4,446 20 4,898 1,960 139 2,384 4,483 414 9.2% $40,771
89.8 88.8 50.5 414 4,482 20 4,917 1,979 179 2,353 4,512 405 9.0% $40,307
88.9 87.9 50.5 405 4,439 20 4,865 2,001 179 2,292 4,472 392 8.8% $40,398
89.7 88.7 50.9 392 4,515 20 4,928 2,040 175 2,326 4,540 387 8.5% $43,298
18/19
19/20
20/21
21/22
0.0 0.0 0.5 3.6 48.8 0.0 52.4 10.5 1.5 34.0 45.9 6.4 0.0% $314.28
0.0 0.0 0.7 6.4 65.6 0.0 72.0 14.1 2.6 46.7 63.4 8.6 0.1% $416.50
0.0 0.0 0.6 8.6 48.6 0.0 57.3 10.4 2.0 38.1 50.5 6.7 0.1% $306.14
0.0 0.0 0.4 6.7 35.7 0.0 42.4 7.7 1.4 28.5 37.5 4.9 0.0% $238.70
DIFFERENCE FROM BASELINE 17/18
0.0 0.0 Yield 0.3 Carryin (Sep 1) 0.8 Production 27.8 Imports 0.0 Total Supply 28.6 Crush 6.0 Food/Seed/Residual 0.8 Exports 18.2 Total Use 25.0 Carryout (Aug 31) 3.6 Stocks/Use 0.0% Farm Revenue (Mil USD) $173.78 Source: Informa Agribusiness Consulting Planted Acres
Harvested Acres
(b) Other Key Producers and Exporters The impact on South American soybean producers would also be larger than in Phase I under the counterfactual scenario. Yield increases in Argentina would be expected to drive production up in every year of the outlook, ranging from 560,000 MT to 1.1 MMT (Exhibit 14). Due to the export tax system that incentivizes crushing soybeans domestically and exporting the products, roughly
82
The Impact of Delays in Chinese Approvals of Biotech Crops
three-fourths of the additional production would be sent to the domestic crush, and the small remaining amount would be either exported or kept in ending stocks. A timelier approval process for biotech events in China would lead to additional value of production of $150 million to $290 million annually when valued at the port price. Exhibit 57: Counterfactual Scenario: Argentina Soybean Supply/Demand, and Difference from Baseline Outlook ARGENTINA SOYBEAN: COUNTERFACTUAL CASE (Milllion Tonnes/Million Hectares) 17/18 Area Yield Carryin (Mar 1) Production Imports Total Supply Crush Food, Feed, & Residual Exports Total Use Carryout (Feb 28) Stocks/Use Farm Revenue (Mil USD)
18.4 3.2 31.7 58.5 1.3 91.5 44.7 4.5 6.4 55.5 36.0 64.9% $21,341
18/19
19/20
20/21
21/22
18.5 3.1 36.0 56.5 1.0 93.5 44.7 3.8 10.2 58.6 34.9 59.5% $21,735
19.0 3.1 34.9 59.1 1.0 95.0 44.7 3.8 11.3 59.8 35.2 58.8% $22,254
19.2 3.1 35.2 59.9 1.0 96.1 45.0 4.9 20.8 70.7 25.4 35.9% $21,718
19.1 3.1 25.4 60.0 1.0 86.4 45.0 5.1 10.6 60.7 25.7 42.3% $23,248
18/19
19/20
20/21
21/22
0.0 0.1 0.11 1.02 0.00 1.13 0.81 0.00 0.18 0.99 0.14 -1% $289
0.0 0.1 0.14 1.09 0.00 1.23 0.83 0.00 0.21 1.03 0.20 -1% $284
0.0 0.0 0.20 0.78 0.00 0.98 0.58 0.00 0.27 0.86 0.12 0% $194
0.0 0.0 0.12 0.56 0.00 0.68 0.42 0.00 0.10 0.52 0.16 0% $155
DIFFERENCE FROM BASELINE 17/18 Area Yield Carryin (Mar 1) Production Imports Total Supply Crush Food, Feed, & Residual Exports Total Use Carryout (Feb 28) Stocks/Use Farm Revenue (Mil USD)
0.0 0.0 0.03 0.68 0.00 0.71 0.52 0.00 0.07 0.60 0.11 0% $186
Source: Informa Agribusiness Consulting
83
The Impact of Delays in Chinese Approvals of Biotech Crops
Brazil would experience similar yield increases as Argentina under a timelier approval system, but, as the country has substantially larger soybean area, the increases in production for Brazil would be roughly double those of Argentina. Unlike Argentina, Brazil does not have a preferential export tax system in place incentivizing the export of soybean products over whole soybeans. Brazil would see roughly one-half to two-thirds of the increase in production relative to the baseline be exported. These changes from the baseline would lead to an additional value of soybean production at the port price ranging from approximately $175 million to $660 million annually (Exhibit 15). Exhibit 58: Counterfactual Scenario: Brazil Soybean Supply/Demand, and Difference from Baseline Outlook BRAZIL SOYBEAN: COUNTERFACTUAL CASE (Milllion Tonnes/Million Hectares) 17/18 Area Yield Carryin (Mar 1) Production Imports Total Supply Crush Food, Feed, & Residual Exports Total Use Carryout (Feb 28) Stocks/Use Farm Revenue (Mil USD)
33.9 3.4 18.3 115.3 0.3 134.0 41.7 3.7 63.3 108.7 25.3 23.3% $43,628
18/19
19/20
20/21
21/22
35.0 3.2 25.3 113.0 0.4 138.8 43.4 4.1 69.1 116.5 22.3 19.1% $44,938
36.0 3.3 22.3 117.2 0.4 139.8 44.1 4.1 69.5 117.8 22.1 18.7% $45,928
36.6 3.3 22.1 120.0 0.4 142.4 44.4 5.2 58.4 108.0 34.4 31.8% $42,792
37.0 3.3 34.4 122.1 0.4 156.9 44.8 5.3 76.6 126.7 30.2 23.8% $48,736
84
The Impact of Delays in Chinese Approvals of Biotech Crops
DIFFERENCE FROM BASELINE 17/18
0.0 Yield 0.0 Carryin (Mar 1) 0.13 Production 1.35 Imports 0.00 Total Supply 1.47 Crush 0.41 Food, Feed, & Residual 0.00 Exports 0.74 Total Use 1.15 Carryout (Feb 28) 0.32 Stocks/Use 0.0% Farm Revenue (Mil USD) $422 Source: Informa Agribusiness Consulting Area
18/19
19/20
20/21
21/22
0.0 0.1 0.32 2.04 0.00 2.36 0.67 0.00 1.25 1.92 0.45 0.1% $663
0.0 0.1 0.45 2.16 0.00 2.61 0.73 0.00 1.28 2.02 0.59 0.2% $615
0.0 0.0 0.59 1.56 0.00 2.15 0.55 0.00 0.76 1.31 0.85 0.4% $276
0.0 0.0 0.85 1.13 0.00 1.98 0.40 0.00 0.71 1.11 0.87 0.5% $172
Exhibit 59: Counterfactual Scenario: Canada Soybean Supply/Demand, and Difference from Baseline Outlook CANADA SOYBEAN: COUNTERFACTUAL CASE (Milllion Tonnes/Million Hectares) Area Yield Carryin (Mar 1) Production Imports Total Supply Crush Food, Feed, & Residual Domestic Use Exports Total Use Carryout (Feb 28) Stocks/Use Farm Revenue (Mil USD)
17/18
18/19
19/20
20/21
21/22
2.9 2.9 0.3 8.4 0.5 9.1 1.9 0.6 2.5 5.6 8.2 1.0 11.7% $2,738
3.0 2.9 1.0 8.6 0.3 9.8 1.9 0.6 2.5 6.0 8.5 1.3 15.2% $2,905
3.1 2.9 1.3 8.9 0.3 10.5 2.0 0.8 2.7 5.6 8.4 2.1 25.2% $2,940
2.9 2.9 2.1 8.6 0.3 11.0 2.0 0.8 2.8 6.6 9.4 1.6 17.3% $2,870
3.1 2.9 1.6 9.0 0.3 10.9 2.0 0.8 2.8 6.7 9.4 1.4 15.3% $3,158
85
The Impact of Delays in Chinese Approvals of Biotech Crops
DIFFERENCE FROM BASELINE 17/18
0.0 Yield 0.0 Carryin (Mar 1) 0.00 Production 0.07 Imports 0.00 Total Supply 0.07 Crush 0.02 Food, Feed, & Residual 0.00 Domestic Use 0.02 Exports 0.05 Total Use 0.06 Carryout (Feb 28) 0.01 Stocks/Use 0.0% Farm Revenue (Mil USD) $17 Source: Informa Agribusiness Consulting Area
18/19
19/20
20/21
21/22
0.0 0.0 0.01 0.12 0.00 0.13 0.03 0.00 0.03 0.08 0.11 0.02 0.0% $31
0.0 0.1 0.02 0.17 0.00 0.18 0.04 0.00 0.04 0.11 0.14 0.04 0.1% $42
0.0 0.0 0.04 0.14 0.00 0.18 0.03 0.00 0.03 0.11 0.14 0.04 0.2% $38
0.0 0.0 0.04 0.13 0.00 0.17 0.03 0.00 0.03 0.10 0.13 0.05 0.3% $38
(c) China As noted previously, China is a massive consumer of soybeans, with production meeting only a fraction of consumption. China is expected to import approximately 75% of its soybean supply throughout the outlook. Production is expected to increase as policies incentivize soybean production (a recent policy change), but it is still expected to remain below even ending stocks. China relies very heavily on soybean imports to meet its strong demand, and under the counterfactual scenario it is expected to slightly increase its reliance. Similar to the scenario in corn, it is unlikely that Chinese soybean area and production would be impacted by a timelier import approval process for biotech events in China. The primary difference under the counterfactual scenario would be an increase in the availability of additional volumes of soybeans from major exporting countries that would lead to an increase in soybean imports by China. Relative to the baseline outlook, imports could increase anywhere from 950,000 MT to as much as 2 MMT annually (Exhibit 16). While this is a substantial figure, it would amount to approximately 1.3% of the total supply of the world’s largest soybean importer. Nearly all of this increase from the baseline would find its way into the domestic crush. The crush is increasing over the outlook in order to produce enough feed to supply China’s growing livestock feeding needs. Protein sources are particularly going to be in high demand in order to supply the growing poultry and swine feeding operations. This is reflected in the expectation that the
86
The Impact of Delays in Chinese Approvals of Biotech Crops
entirety of the increase in meal production from the increased crush will be passed through to domestic use in the form of animal feeding. Exhibit 60: Counterfactual Scenario: China Soybean Complex Fundamentals, and Difference from Baseline Outlook
CHINA SOYBEAN COMPLEX: COUNTERFACTUAL CASE 17/18
18/19
19/20
20/21
21/22
CHINA SOYBEAN SUPPLY AND DEMAND (Milllion Tonnes/Million Hectares) Area 8.0 8.5 8.7 8.4 8.7 Yield 1.9 1.8 1.8 1.9 1.9 Carryin (Oct 1) 19.7 23.6 26.0 24.4 25.6 Production 15.0 15.5 16.1 15.7 16.5 Imports 101.9 107.0 110.7 119.7 125.1 Total Supply 136.6 146.0 152.8 159.8 167.1 Crush 98.4 105.2 112.6 118.3 124.1 Food, Feed, & Residual 14.5 14.8 15.5 15.7 15.8 Exports 0.1 0.1 0.3 0.4 0.6 Total Use 113.1 120.0 128.4 134.3 140.5 Carryout (Sep 30) 23.6 26.0 24.4 25.6 26.7 Stocks/Use 20.9% 21.7% 19.0% 19.0% 19.0% CHINA SOYBEAN MEAL SUPPLY AND DEMAND (Milllion Tonnes/Million Hectares) Crush 98.4 105.2 112.6 118.3 124.1 Carryin 0.0 0.0 0.0 0.0 0.0 Production 78.0 83.2 86.7 91.8 98.3 Imports 0.1 0.1 0.1 0.1 0.1 Total Supply 78.0 83.2 86.7 91.8 98.4 Domestic Use 76.6 81.7 85.9 90.8 96.9 Exports 1.4 1.5 0.9 1.1 1.4 Total Use 78.0 83.2 86.7 91.8 98.4 CHINA SOYBEAN OIL SUPPLY AND DEMAND (Milllion Tonnes/Million Hectares) Carryin 0.7 0.7 0.7 0.7 0.7 Production 17.6 18.8 19.6 20.8 22.2 Imports 0.5 0.4 1.0 1.0 1.0 Total Supply 18.9 20.0 21.4 22.5 24.0 Food Use 18.0 19.0 19.9 20.9 20.9 Industrial Use 0.0 0.0 0.0 0.0 0.0 Exports 0.2 0.2 0.8 0.9 2.3 Total Use 18.1 19.2 20.6 21.8 23.2 Carryout 0.7 0.7 0.7 0.7 0.8 Source: Informa Agribusiness Consulting
87
The Impact of Delays in Chinese Approvals of Biotech Crops
CHINA SOYBEAN COMPLEX: DIFFERENCE FROM BASELINE 17/18
18/19
19/20
20/21
21/22
CHINA SOYBEAN SUPPLY AND DEMAND (Milllion Tonnes/Million Hectares) Area 0.00 0.00 0.00 0.00 0.00 Yield 0.00 0.00 0.00 0.00 0.00 Carryin (Mar 1) 0.01 0.03 0.06 0.10 0.13 Production 0.00 0.00 0.00 0.00 0.00 Imports 0.95 1.71 1.97 1.48 1.12 Total Supply 0.95 1.73 2.04 1.58 1.26 Crush 0.93 1.67 1.93 1.45 1.10 Food, Feed, & Residual 0.00 0.00 0.00 0.00 0.00 Exports 0.00 0.00 0.00 0.00 0.00 Total Use 0.93 1.67 1.93 1.45 1.10 Carryout (Feb 28) 0.03 0.06 0.10 0.13 0.15 Stocks/Use -0.1% -0.3% -0.2% -0.1% 0.0% CHINA SOYBEAN MEAL SUPPLY AND DEMAND (Milllion Tonnes/Million Hectares) Crush 0.93 1.67 1.93 1.45 1.10 Carryin 0.00 0.00 0.00 0.00 0.00 Production 0.73 1.32 1.49 1.13 0.87 Imports 0.00 0.00 0.00 0.00 0.00 Total Supply 0.73 1.32 1.49 1.13 0.87 Domestic Use 0.73 1.32 1.49 1.13 0.87 Exports 0.00 0.00 0.00 0.00 0.00 Total Use 0.73 1.32 1.49 1.13 0.87 CHINA SOYBEAN OIL SUPPLY AND DEMAND (Milllion Tonnes/Million Hectares) Carryin 0.00 0.00 0.00 0.00 0.00 Production 0.17 0.30 0.34 0.25 0.20 Imports 0.00 0.00 0.00 0.00 0.00 Total Supply 0.17 0.30 0.34 0.25 0.20 Food Use 0.17 0.30 0.34 0.25 0.20 Industrial Use 0.00 0.00 0.00 0.00 0.00 Exports 0.00 0.00 0.00 0.00 0.00 Total Use 0.17 0.30 0.34 0.25 0.20 Carryout 0.00 0.00 0.00 0.00 0.00 Source: Informa Agribusiness Consulting
88
The Impact of Delays in Chinese Approvals of Biotech Crops
3. Impact on Canola Markets For Canada, the impacts of timelier approvals would largely be reflected in years 2017/182018/19, with production increasing by 120,000 MT and 130,000 MT respectively (Exhibit 61). The final three years of the outlook would see less than 10,000 MT of increased production. The value of this increased production relative to the baseline is $31-$45 million in the first two years before declining substantially in the out years. This production increase is captured somewhat evenly between exports and the domestic crush, with ending stocks marginally increasing. Similar to the situation for corn and soybeans, it is unlikely that timelier import approvals would lead to changes in China’s canola area or production. Instead this change in approval timeline would be primarily reflected in an increase in imports, ranging from roughly 150,000 MT to 450,000 MT annually (Exhibit 62). This increase in imports would be captured almost entirely by the domestic crush in order to produce meal and oil for its domestic industries. Canada is the primary exporter of canola to China. (a) Canada Exhibit 61: Counterfactual Scenario: Canada Canola Supply/Demand, and Difference from Baseline Outlook CANADA CANOLA: COUNTERFACTUAL CASE (Milllion Tonnes/Million Hectares) Area Yield Carryin (Mar 1) Production Imports Total Supply Crush Food, Feed, & Residual Exports Total Use Carryout (Feb 28) Stocks/Use Farm Revenue (Mil USD)
17/18
18/19
19/20
20/21
21/22
9.2 2.2 1.4 20.4 0.1 21.9 9.2 0.3 11.1 20.6 1.3 6.2% $7,787
9.2 2.4 1.3 22.6 0.1 24.0 9.3 0.4 11.2 20.9 3.0 14.4% $8,401
9.1 2.3 3.0 21.2 0.1 24.3 10.1 0.4 11.6 22.2 2.2 9.8% $7,750
8.9 2.4 2.2 21.0 0.1 23.3 10.1 0.4 11.5 22.0 1.3 6.0% $7,777
9.4 2.4 1.3 22.6 0.1 24.0 10.9 0.4 11.0 22.3 1.7 7.6% $8,780
89
The Impact of Delays in Chinese Approvals of Biotech Crops
CANADA CANOLA SUPPLY AND DEMAND (Milllion Tonnes/Million Hectares) 17/18
9.2 Yield 2.2 Carryin (Mar 1) 1.3 Production 20.3 Imports 0.1 Total Supply 21.7 Crush 9.2 Seed & Residual 0.3 Exports 11.1 Total Use 20.5 Carryout (Feb 28) 1.3 Stocks/Use 6.3% Farm Revenue (Mil USD) $7,756 Source: Informa Agribusiness Consulting Area
18/19
19/20
20/21
21/22
9.2 2.4 1.3 22.4 0.1 23.8 9.3 0.4 11.1 20.8 3.0 14.4% $8,356
9.1 2.3 3.0 21.2 0.1 24.3 10.1 0.4 11.6 22.1 2.2 9.8% $7,748
8.9 2.4 2.2 21.0 0.1 23.3 10.1 0.4 11.5 22.0 1.3 6.0% $7,770
9.4 2.4 1.3 22.5 0.1 24.0 10.9 0.4 11.0 22.3 1.7 7.5% $8,772
(b) China Exhibit 62: Counterfactual Scenario: China Canola Supply/Demand, and Difference from Baseline Outlook CHINA CANOLA: COUNTERFACTUAL CASE (Milllion Tonnes/Million Hectares) 17/18 Area Yield Carryin (Oct 1) Production Imports Total Supply Crush Food, Feed, & Residual Exports Total Use Carryout (Sep 30) Stocks/Use
6.9 2.0 1.5 13.6 4.2 19.3 17.4 0.6 0.0 17.9 1.4 7.8%
18/19
19/20
20/21
21/22
7.0 2.0 1.4 13.8 5.0 20.1 18.4 0.6 0.0 19.0 1.1 5.9%
7.0 2.0 1.1 13.9 5.3 20.4 18.4 0.8 0.0 19.2 1.2 6.3%
6.9 2.0 1.2 13.8 5.3 20.3 18.3 0.8 0.0 19.1 1.3 6.8%
6.9 2.0 1.3 14.0 5.4 20.7 18.5 0.8 0.0 19.3 1.4 7.1%
90
The Impact of Delays in Chinese Approvals of Biotech Crops
DIFFERENCE FROM BASELINE Area Yield Carryin (Mar 1) Production Imports Total Supply Crush Food, Feed, & Residual Exports Total Use Carryout (Feb 28) Stocks/Use
17/18
18/19
19/20
20/21
21/22
0.0 0.0 0.00 0.00 0.27 0.27 0.26 0.00 0.00 0.26 0.01 -0.1%
0.0 0.0 0.01 0.00 0.45 0.46 0.44 0.00 0.00 0.44 0.02 0.0%
0.0 0.0 0.02 0.00 0.46 0.48 0.46 0.00 0.00 0.46 0.03 0.0%
0.0 0.0 0.03 0.00 0.28 0.30 0.27 0.00 0.00 0.27 0.03 0.1%
0.0 0.0 0.03 0.00 0.26 0.29 0.25 0.00 0.00 0.25 0.04 0.1%
Source: Informa Agribusiness Consulting
C. Summary of Impacts on the Value of Crop Production Cumulatively, the value of corn production in the US, Argentina, Brazil, and Canada would be $4.3 billion higher over the next five crop years if China approved biotech crops in a timelier manner (Exhibit 18). Impacts slowly accelerate to a peak in 2019/20, before moderating somewhat and declining in 2021/22. The corn impacts are largely driven by impacts within the US. The cumulative impact on the value of soybean production in the US, Argentina, Brazil, and Canada under the counterfactual scenario is greater than on corn production, at nearly $4.9 billion (Exhibit 19). These impacts are driven more by Brazil, with the US and Argentina being significant contributors. While the peak year is the same as in corn impacts, the general trend is somewhat accelerated relative to corn, with the smallest impacts in the final two years of the outlook.
91
The Impact of Delays in Chinese Approvals of Biotech Crops
Exhibit 63: Future Impacts of Chinese Delays on the Value of Corn Production in Key Countries
Source: Informa Agribusiness Consulting
Exhibit 64: Future Impacts of Chinese Delays on the Value of Soybean Production in Key Countries
Source: Informa Agribusiness Consulting
92
The Impact of Delays in Chinese Approvals of Biotech Crops
D. Impacts of Chinese Delays on the Broader Economy 1. Impacts to the US Economy Based on input-output modeling, continued delays in Chinese approvals of biotech crops would have a significant impact on the US economy. In the counterfactual analysis, corn production is driving the majority of the impacts. However, soybean production plays a greater role moving forward than it did in the historical analysis in Phase I. Cumulatively over next five years, Chinese delays could result in a direct impact of nearly $5 billion in grain economic output and over $2.3 billion in GDP (Exhibit 22). Once the impacts of indirect and induced impacts are included, the total impact increases to over $14.5 billion in output and over $7.3 billion in GDP. In aggregate, a $1 increase in grain sales would result in an additional $1.96 elsewhere in the economy. Exhibit 65: Cumulative Impact to US Output Over Five Years, by Type of Effect
Source: Informa Agribusiness Consulting
Exhibit 66: Cumulative Impacts to the US Economy over Five Years (Mil $) Impact Type Direct Effect Indirect Effect Induced Effect Total Effect
Employment 3,942 8,148 6,926 19,016
Labor Income $ 1,532.2 $ 1,533.9 $ 1,331.6 $ 4,397.7
Value Added $ 2,337.7 $ 2,707.1 $ 2,334.7 $ 7,379.5
$ $ $ $
Output 4,907.3 5,335.1 4,290.3 14,532.7
Source: Informa Agribusiness Consulting
93
The Impact of Delays in Chinese Approvals of Biotech Crops
A breakout of these impacts on a crop marketing year (MY) basis is provided in Exhibit 23 through Exhibit 26. Peak impacts occur in MY 2019/20, at over $2.1 billion in GDP, $4.2 billion in output, and nearly 20,000 jobs supported by the additional economic activity in the counterfactual case. Exhibit 67: US Annual Impacts to Employment Employment Direct Effect Indirect Effect Induced Effect Total Effect
2017/18 1,484 3,104 2,686 7,275
2018/19 2,326 4,730 4,198 11,254
2019/20 3,942 8,148 6,926 19,016
2020/21 3,552 7,390 6,108 17,050
2021/22 2,263 4,574 3,882 10,720
Source: Informa Agribusiness Consulting
Exhibit 68: US Annual Impacts to Labor Income (Mil $) Labor Income Direct Effect Indirect Effect Induced Effect Total Effect
$ $ $ $
2017/18 168.7 163.2 144.2 476.1
$ $ $ $
2018/19 274.5 254.0 229.6 758.1
$ $ $ $
2019/20 443.7 445.3 386.1 1,275.1
$ $ $ $
2020/21 387.8 411.4 347.0 1,146.2
$ $ $ $
2021/22 257.5 260.0 224.8 742.3
$ $ $ $
2021/22 391.1 459.0 394.1 1,244.2
$ $ $ $
2021/22 825.9 905.6 725.0 2,456.6
Source: Informa Agribusiness Consulting
Exhibit 69: US Annual Impacts to GDP (Mil $) Value Added Direct Effect Indirect Effect Induced Effect Total Effect
$ $ $ $
2017/18 262.4 288.1 252.8 803.3
$ $ $ $
2018/19 438.1 448.4 402.5 1,289.1
$ $ $ $
2019/20 675.8 785.8 676.9 2,138.6
$ $ $ $
2020/21 570.2 725.7 608.4 1,904.4
Source: Informa Agribusiness Consulting
Exhibit 70: US Annual Impacts to Business Sales (Mil $) Output Direct Effect Indirect Effect Induced Effect Total Effect
$ $ $ $
2017/18 536.6 566.6 464.0 1,567.2
$ $ $ $
2018/19 865.0 880.8 739.2 2,485.0
$ $ $ $
2019/20 1,421.9 1,548.6 1,243.6 4,214.1
$ $ $ $
2020/21 1,257.8 1,433.5 1,118.5 3,809.7
Source: Informa Agribusiness Consulting
The delays in Chinese approvals would not affect every industry equally or to the same degree. Part of the benefit of the US dataset in IMPLAN is granularity, with the ability to model interactions between the impacted industry and all 536 categories within the industry sectoring
94
The Impact of Delays in Chinese Approvals of Biotech Crops
scheme. Each individual industry has its own spending pattern which shows how that particular industry interacts with its upstream industries. As a result, the US dataset allows for a closer look at the various impacts on an industry-by-industry basis as well. The top 15 industries impacted over the five-year time period are examined by each type of impact (jobs, GDP, output) in Exhibit 27 through Exhibit 29. (Note that these reflect aggregated indirect and induced impacts.) As would be expected, several agriculture-related industries, such as support activities for agriculture and real estate, are ranked among the most impacted. Still, several non-agricultural industries, such as hospitals, restaurants, and petroleum refineries, are also among the top ones affected. By including these non-agricultural impacts, input-output analysis provides a more holistic view of the impacts to the greater economy. Exhibit 71: Top 15 US Industries Ranked by 5-Year Cumulative Employment Impact (Indirect and Induced Effects Only) Total Jobs Support activities for agriculture and forestry Real estate Wholesale trade Full-service restaurants Limited-service restaurants Hospitals Employment services Maintenance and repair construction of nonresidential structures Services to buildings Truck transportation Insurance agencies, brokerages, and related activities Retail - General merchandise stores Management of companies and enterprises All other crop farming Retail - Food and beverage stores
15,074 4,014 741 604 336 307 291 219 216 200 193 187 179 177 176 175
Source: Informa Agribusiness Consulting
95
The Impact of Delays in Chinese Approvals of Biotech Crops
Exhibit 72: Top 15 US Industries Ranked by 5-Year Cumulative GDP Impact (Indirect and Induced Effects Only) (Mil $) Total GDP Support activities for agriculture and forestry Real estate Wholesale trade Owner-occupied dwellings Monetary authorities and depository credit intermediation Insurance carriers Pesticide and other agricultural chemical manufacturing Extraction of natural gas and crude petroleum Management of companies and enterprises Hospitals Petroleum refineries Offices of physicians Insurance agencies, brokerages, and related activities Maintenance and repair construction of nonresidential structures Limited-service restaurants
$ 5,041.8 $ 632.9 $ 414.8 $ 368.6 $ 219.8 $ 144.0 $ 132.9 $ 122.5 $ 108.7 $ 102.1 $ 96.9 $ 70.7 $ 62.2 $ 62.0 $ 59.3 $ 53.2
Source: Informa Agribusiness Consulting
Exhibit 73: Top 15 US Industries Ranked by 5-Year Cumulative Sales Impact (Indirect and Induced Effects Only) (Mil $) Total Output/Business Sales Support activities for agriculture and forestry Real estate Wholesale trade Pesticide and other agricultural chemical manufacturing Owner-occupied dwellings Petroleum refineries Insurance carriers Extraction of natural gas and crude petroleum Phosphatic fertilizer manufacturing Monetary authorities and depository credit intermediation Nitrogenous fertilizer manufacturing Hospitals Management of companies and enterprises Maintenance and repair construction of nonresidential structures Grain farming
$ 9,625.4 $ 826.8 $ 588.7 $ 528.4 $ 356.2 $ 343.7 $ 328.0 $ 265.1 $ 200.1 $ 199.7 $ 189.8 $ 182.1 $ 176.5 $ 170.8 $ 143.9 $ 139.9
Source: Informa Agribusiness Consulting
96
The Impact of Delays in Chinese Approvals of Biotech Crops
2. Impacts to the Canadian Economy In the Canadian case, the impacts of delays in biotech approvals are driven only by grain farming and are substantially smaller than the US. Based on Statistics Canada input-output modeling, it is estimated that over the course of five years the direct impact would be approximately $375 million in output and over $230 million in GDP (Exhibit 31). Once the economic impacts of indirect and induced effects are included, the cumulative impacts increase to over $610 million in output and over $363 million in GDP. Exhibit 74: Cumulative Impact to Canadian Output Over Five Years, by Type of Effect
Source: Informa Agribusiness Consulting
Exhibit 75: Cumulative Impacts to the Canadian Economy over Five Years (Mil $) Aggregate Direct Indirect Induced Total
Employment 296 197 84 577
$ $ $ $
GDP 239.7 92.0 31.5 363.2
$ $ $ $
Output 374.3 180.7 55.1 610.1
Source: Informa Agribusiness Consulting
A breakout of these impacts is shown on a marketing year basis in Exhibit 32 and Exhibit 33. Peak impacts occur in MY 2018/19 at over $91 million in GDP and $153 million in output.
97
The Impact of Delays in Chinese Approvals of Biotech Crops
Exhibit 76: Canada Annual Impact to GDP (Mil $) GDP Direct Indirect Induced Total
$ $ $ $
2017/18 38.24 14.67 5.03 57.95
$ $ $ $
2018/19 60.29 23.14 7.94 91.37
$ $ $ $
2019/20 51.80 19.88 6.82 78.50
$ $ $ $
2020/21 48.77 18.72 6.42 73.91
$ $ $ $
2021/22 40.55 15.56 5.34 61.45
Source: Informa Agribusiness Consulting
Exhibit 77: Canada Annual Impact to Business Sales (Mil $) Output Direct Indirect Induced Total
$ $ $ $
2017/18 59.72 28.83 8.79 97.34
$ $ $ $
2018/19 94.16 45.45 13.85 153.47
$ $ $ $
2019/20 80.91 39.06 11.90 131.87
$ $ $ $
2020/21 76.18 36.77 11.21 124.15
$ $ $ $
2021/22 63.34 30.57 9.32 103.22
Source: Informa Agribusiness Consulting
3. Impacts to the Brazilian Economy While smaller than the US, the impacts of Chinese delays on the Brazilian economy are quite significant. Cumulatively over the next five years, the direct impact is expected to be over $2.6 billion in sales and nearly $1.5 million in GDP (Exhibit 35). Once indirect and induced effects are included, these impacts increase to nearly $5.8 billion in sales and over $3 billion in GDP. Exhibit 78: Cumulative Impact to Brazilian Output Over Five Years, by Type of Effect
Source: Informa Agribusiness Consulting
98
The Impact of Delays in Chinese Approvals of Biotech Crops
Exhibit 79: Cumulative Impacts to the Brazilian Economy over Five Years (Mil $) Direct Effect Indirect Effect Induced Effect Total Effect
Employment 46,184 14,096 5,950 66,230
Labor Income ($) $ 577.2 $ 382.0 $ 292.6 $ 1,251.8
Value Added ($) $ 1,462.4 $ 968.0 $ 652.6 $ 3,083.0
$ $ $ $
Output ($) 2,650.8 1,955.2 1,166.3 5,772.2
Source: Informa Agribusiness Consulting
A breakout of the counterfactual impacts is shown on a marketing year basis in Exhibit 36. Peak impacts occur in MY 2019/20 at nearly $870 million in GDP, over $1.6 billion in output and over 66,000 jobs supported by the additional sales registered in the counterfactual scenario. Exhibit 80: Annual Impacts to Brazil (Mil $) Jobs GDP Output
2017/18 2018/19 2019/20 2020/21 2021/22 44,534 66,112 66,230 34,758 24,684 $ 564.5 $ 852.2 $ 868.2 $ 463.4 $ 334.7 $ 1,055.5 $ 1,594.7 $ 1,625.9 $ 868.4 $ 627.7
Source: Informa Agribusiness Consulting
4. Impacts to the Argentine Economy Cumulatively over the next five years, the direct economic to Argentina from Chinese regulatory delays is expected to be nearly $1.4 billion in output and over $750 million in GDP (Exhibit 38). Including indirect and induced effects, these impacts increase to over $2.9 billion in output and over $1.6 billion in GDP.
99
The Impact of Delays in Chinese Approvals of Biotech Crops
Exhibit 81: Cumulative Impact to Argentine Output Over Five Years, by Type of Effect
Source: Informa Agribusiness Consulting
Exhibit 82: Cumulative Impacts to the Argentine Economy over Five Years (Mil $) Direct Effect Indirect Effect Induced Effect Total Effect
Employment 2,924 4,489 5,040 12,453
Labor Income ($) $ 283.2 $ 183.0 $ 190.8 $ 657.0
Value Added ($) $ 758.5 $ 474.1 $ 385.5 $ 1,618.1
$ $ $ $
Output ($) 1,370.5 896.4 658.6 2,925.6
Source: Informa Agribusiness Consulting
A breakout of the impacts on a marketing year basis is shown in Exhibit 39. Peak impacts occur in MY 2019/20 with nearly $420 million in GDP, over $756 million in output and over 12,400 jobs affected. Exhibit 83: Annual Impacts to Argentina (Mil $) Jobs GDP Output
2017/18 2018/19 2019/20 2020/21 2021/22 7,706 11,485 12,453 9,048 7,496 $ 250.4 $ 379.5 $ 418.5 $ 309.2 $ 260.5 $ 451.9 $ 685.5 $ 756.7 $ 559.6 $ 472.0
Source: Informa Agribusiness Consulting
Similar to the historical view, an important way in which agriculture will continue to affect the broader economy is via taxes. As discussed previously, President Mauricio Macri initiated significant changes to agricultural export taxes. Corn and wheat export taxes were eliminated, while soybean export taxes were lowered to 30% from 35%, and soybean meal and oil export
100
The Impact of Delays in Chinese Approvals of Biotech Crops
taxes were lowered from 32% to 27%. The announced intention was to reduce these rates by 5% on an annual basis until the target rates were achieved, but further reductions were put on hold for 2017. The most recent position by the Argentine government is to begin decreasing the export tax on soybeans and soybean products (meal and oil) by 0.5% per month beginning in January of 2018, until December of 2019 when it reaches the end target of 18% for soybeans and 15% for soybean meal and oil. Cumulatively over the next five years, the increased exports that would occur in the absence of Chinese delays could generate an additional $266 million in tax revenue to the Argentine government, with the greatest impact in the 2018/19 marketing year (Exhibit 40). The key assumption in this analysis is the government sticks to the current scheduled decrease. Exhibit 84: Argentine Export Tax Impacts (Mil $) Counterfactual Scenario 2017/18 Soybean Exports (MT) 74,380 Soybean Export Tax Revenue (Mil $) $ 8.10 SBM Exports (MT) 368,949 SBM Export Tax Revenue (Mil $) $ 34.04 SBO Exports (MT) 64,345 SBO Export Tax Revenue (Mil $) $ 12.99 Total Export Tax Revenue (Mil $) $ 55.12 Source: Informa Agribusiness Consulting
$ $ $ $
2018/19 183,764 17.93 557,869 42.81 103,527 17.90 78.64
$ $ $ $
2019/20 208,772 15.42 555,308 31.60 98,273 12.37 59.38
$ $ $ $
2020/21 270,575 17.72 408,144 21.11 67,456 7.43 46.26
$ $ $ $
2021/22 98,627 6.90 285,648 14.78 47,723 5.59 27.27
101
Informa Agribusiness Consulting 775 Ridge Lake Blvd Suite 400 Memphis, TN 38120 +1 901 202 4600
[email protected] www.agribusinessintelligence.com