Ecology, 86(7), 2005, pp. 1863–1872 q 2005 by the Ecological Society of America
THE IMPACT OF CROPPING ON PRIMARY PRODUCTION IN THE U.S. GREAT PLAINS JOHN B. BRADFORD,1,2,3 WILLIAM K. LAUENROTH,2
AND
INGRID C. BURKE2
1
Graduate Degree Program in Ecology, Colorado State University, Fort Collins, Colorado 80521-1472 USA 2Department of Forest, Rangeland and Watershed Stewardship, Colorado State University, Fort Collins, Colorado 80521-1472 USA
Abstract. Land use and altered carbon dynamics are two of the primary components of global change, and the effect of land use on carbon cycling is a crucial issue in regional scale biogeochemistry. Previous studies have shown that climate and soil conditions control net primary production (NPP) at regional scales, and that agricultural land use can influence NPP at local scales through altered water availability and carbon allocation patterns. However, few studies have attempted to quantify the effect of cultivation on NPP at regional scales, and no studies have examined this relationship for the most heavily cultivated region of the United States, the Great Plains. We quantified current regional aboveground and belowground productivity (including cultivation) for nine years on a county basis from (1) USDA agricultural census data, and (2) STATSGO range site production values. By comparing these data with values of native vegetation NPP (precultivation) derived from STATSGO, we estimated that cultivation is increasing regional NPP by ;10%, or 0.046 Pg C/yr. In addition, we examined the relationship between cultivation of particular crops and NPP change and characterized the influence of individual crops on primary productivity. Key words: scale.
agriculture; carbon; cropping; grassland; land use; primary production; regional
INTRODUCTION Land use and altered carbon cycling are two major components of global change (Vitousek 1994). Land use practices often include dramatic modification of vegetation and are therefore some of the most direct and common ways that humans impact ecosystems (Houghton 1995, Houghton et al. 1999). Cropping is a widespread component of land use, covering over 1.5 3 109 ha worldwide (Richards 1990). Although cropping has obvious effects on vegetation structure, it also influences ecosystem processes, including the magnitude and direction of the carbon flux between the atmosphere and the soil–vegetation system (Houghton et al. 1999). Despite the potential impact of land use on ecosystem processes, few studies have attempted to quantify changes in long-term primary productivity of cultivated areas over large scales. Many regional scale studies have focused on patterns in native plant production in relation to climatic and/or edaphic conditions (e.g., Lieth 1975, Sala et al. 1988, Epstein et al. 1997). Of the studies that have examined the relationship between land use and carbon cycling, most have either (1) exManuscript received 12 March 2004; revised 27 September 2004; accepted 9 November 2004. Corresponding Editor: S. D. Smith. 3 Present address: USDA Forest Service, Rocky Mountain Research Station, 240 West Prospect, Fort Collins, Colorado 80526 USA. E-mail:
[email protected]
amined carbon release from initial land conversion (either into or out of cultivation) at large scales, (2) quantified changes in carbon cycling processes at small scales, or (3) used ecological simulation models, remote sensing, and/or atmospheric models to estimate large-scale carbon cycling processes. The first type of studies combines information about the amount of land converted with results about gain or loss of carbon (soil carbon or standing biomass) as a result of conversion (e.g., Dale et al. 1991, Houghton 1995, Dale 1997, Paustian et al. 1999). For example, land conversion from native vegetation into cropping in the United States prior to 1945 is estimated to have released 27 Pg of carbon, whereas subsequent abandonment, forest regrowth, and fire suppression have sequestered ;2 Pg C (Houghton et al. 1999). Although this work provides insight into the initial impact of land conversion and subsequent carbon exchange, it does not help us to understand how land use practices influence primary productivity in areas already converted. The second type of studies relies on site-level measurements of productivity in cropped and uncropped comparisons to quantify the long-term changes in productivity. These results indicate that cropping in temperate grasslands typically increases aboveground productivity (Buyanovsky et al. 1987, Kucharik et al. 2001), can decrease belowground productivity (Smith 2003), and almost always decreases soil carbon (Burke et al. 1997). Although these studies provide valuable
1863
JOHN B. BRADFORD ET AL.
1864
site-level results and potential confirmation of larger scale studies, extrapolating these results to larger areas involves numerous scaling problems (Wiens 1989) and may ultimately require some estimates at multiple spatial scales (Wessman 1992). Modeling and remote sensing exercises have provided estimates of productivity and carbon flux at both global and regional scales (e.g., Parton et al. 1993, Law and Waring 1994, Field et al. 1995, Fan et al. 1998, Moulin et al. 1998, DeFries et al. 1999, Potter et al. 1999, Prince et al. 2001, Guerschman et al. 2003). Potter et al. (1993) used remotely sensed vegetation observation data constrained by weather observations to derive a global annual net primary productivity (NPP) estimate of 56.4 Pg C and DeFries et al. (1999) combined remotely sensed measurements of land cover change with modeled cover-type specific NPP approximations to estimate that conversion to agriculture has increased NPP by 0.102 Pg C in North America. Previously, these studies provided the only large-scale estimates of carbon cycling and, therefore, the only means for quantifying the impact of land use on these processes. However, these results include major assumptions about scaling site-level results (Wiens 1989) and have generally operated without validation of their large-scale estimates. In addition, these studies typically quantify processes under current conditions only, whereas understanding the impact of cropping on productivity requires accurate productivity estimates for current land use patterns and estimates in the absence of cultivation. Quantifying how cropping has modified carbon fluxes at large scales and over long time periods is crucial for understanding the potential consequences of this widespread land use practice. In this study, we quantified the relationship between cultivation and NPP in the U.S. Great Plains by characterizing regional productivity both with and without cropping. Our specific objectives were: (1) to estimate regional NPP and carbon allocation patterns in the absence of cropping; (2) to include cropping information in these calculations to estimate current productivity and allocation; (3) to combine results from objectives 1 and 2 to quantify the influence of cropping on regional NPP; and (4) to identify the direction and magnitude of influence of specific crops on productivity. METHODS
Study site Covering 23% of the contiguous United States, the Great Plains region extends from the Canadian border to central Texas, and from the Rocky Mountains to approximately the 95th meridian. Annual precipitation occurs primarily during summer months, and varies from ,400 mm in the west to ;1000 mm in the east. Mean annual temperature ranges from 38 to 218C from north to south (Lauenroth and Burke 1995). Native
Ecology, Vol. 86, No. 7
TABLE 1. Area harvested from each crop, as well as total areas harvested and unharvested in the U.S. Great Plains, expressed as a percentage of the total region. Crop
Area (%)
Wheat Corn Hay Soybeans Sorghum Cotton Barley Sunflowers Oats Beans Potatoes Rye Total crop area Total area without crops
10.02 4.50 3.39 2.60 1.62 0.95 0.89 0.57 0.33 0.21 0.04 0.02 25.14 74.86
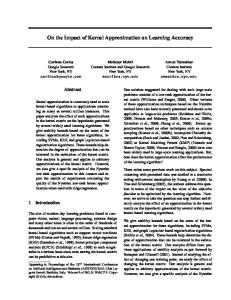
plant communities include southern mixed prairie, shortgrass steppe, tallgrass prairie, and northern mixed prairie (Lauenroth et al. 1999). Patterns of land use follow the precipitation gradient, with primarily grazed native grassland and limited dryland and irrigated cropland in the west, wheat in the central part of the region, and nearly contiguous cropland in the east (Table 1). For this study, we collected data for 1991–1999 for 630 counties that historically contained at least 70% of the following vegetation types: northern mixed grass prairie, shortgrass prairie, tallgrass prairie, tallgrass savanna, southern mixed grass prairie, desert savanna, and floodplain forests as defined by Kuchler (1964; see Fig. 1).
Precultivation productivity Total net primary productivity (NPP) is the sum of aboveground net primary productivity (ANPP) and belowground net primary productivity (BNPP). Native ANPP estimates were derived from the USDA STATSGO database (USDA Soil Conservation Service 1989). The U.S. Department of Agriculture has divided each state into ‘‘range sites,’’ and for states in the western United States it has provided estimates of range site production based on measurements of aboveground biomass (SCS 1976). We entered these values and spatial locations into a GIS and used ARCINFO (ESRI 1996) to overlay a county map onto the range site production map and to calculate the area-weighted average range site production value for each county. Measuring BNPP involves quantifying root growth, and consequently is much more difficult than estimating ANPP (Lauenroth 2000). Although no widespread empirical BNPP data sources exist, recent work (Gill et al. 2002) has indicated that BNPP in grassland systems can be calculated from three other variables: maximum yearly instantaneous belowground biomass (BGBtot), maximum proportion of BGBtot that is alive during the year (BGBlive/BGBtot), and root turnover (T) according to the following equation:
CROP IMPACTS ON PRIMARY PRODUCTIVITY
July 2005
1865
cropped areas, which we assumed to be native vegetation. The USDA National Agricultural Statistics Service (NASS 1998) maintains records of acreage and economic yield for most crops produced in the United States. Following the approach detailed in Prince et al. (2001), economic yield (i.e., bushels or tons per unit area) was translated into ANPP and BNPP by using moisture content information from Martin et al. (1976), harvest index values (ratio of biomass harvested to total aboveground biomass), and resource allocation ratios (ratio of belowground productivity to aboveground productivity; Appendix A). ANPP and BNPP for areas cropped in annual plants were calculated as ANPP 5 EY 3 (1 2 MC) 3 (1/HI) BNPP 5 ANPP 3 (RS)
FIG. 1. Cropping intensity (NASS 1998) for counties in the U.S. Great Plains and climatic conditions in the region.
BNPP 5 BGBtot 3
1 BGB 2 3 T. BGBlive tot
Gill et al. (2002) used these relationships along with reported pairs of BNPP and ANPP values to generate equations to predict BNPP from ANPP and temperature in grasslands. Their results indicated that BGBtot, BGBlive/BGBtot, and T can be estimated from peak annual aboveground biomass (AGBIO) and mean annual temperature (MAT) as BGBtot 5 79 3 AGBIO 2 33.3(MAT 1 10) 1 1289 BGBlive 5 0.6 BGBtot
T 5 0.2884 3 e 0.0463MAT . We utilized these relationships to represent BGBtot, BGBlive/BGBtot, and T, and calculated BNPP for each county. Since grassland ANPP in many areas can be equated to AGBIO (Lauenroth et al. 1986), we used our ANPP estimates as a surrogate for AGBIO. By dividing belowground production by aboveground production, we calculated a county-wide belowground to aboveground ratio that provides a simple indicator of how photosynthetic products are being allocated into plant components.
Current productivity To quantify current productivity, we represented each county as a mixture of cropped areas and un-
where EY is economic yield, MC is moisture content, HI is harvest index, and RS is the root to shoot allocation ratio. Since total county ANPP includes a mixture of cropped and uncropped areas, we calculated county ANPP as the area-weighted average of ANPP for each crop and native ANPP of the county in the absence of cropping (based on STATSGO data). To estimate whole county BNPP we estimated BNPP values for each crop and for native vegetation and calculated the areaweighted average. We used published crop ANPP and BNPP values to determine allocation ratios for cultivated areas and utilized county ANPP and BNPP estimates from the precultivation estimates to estimate allocation for the remainder of the county.
Comparison of current and precultivation productivity We calculated the effect of cropping on production in each county as current production minus native production. To further characterize the link between cropping and productivity change, we plotted change in ANPP, BNPP, and NPP against cropping intensity for all counties. To quantify the current proportion of productivity that is derived from cropping, we compared NPP estimates from cropped areas with total current county NPP estimates for every county. Proportions for the entire region were obtained by summing cultivated NPP across the entire region and comparing it to current regional NPP.
Characterization of productivity change To characterize the effect that specific crops have had on primary productivity, we performed separate multiple stepwise linear regressions (acceptance and rejection criteria of a 5 0.05 with order determined by significance) with NPP, ANPP, and BNPP as dependent variables and the proportion of the county planted in corn, wheat, soybean, sorghum, and hay as separate independent variables. These regression models take the following form:
JOHN B. BRADFORD ET AL.
1866
R 5 b1C1 1 b2C2 1 . . . 1 biCi where R is the response variable (NPP, ANPP, or BNPP), i is the number of crops included in the model, bi is coefficient for crop i, and Ci is the proportion of crop i harvested in each county. The crop coefficients produced by this process allowed us to identify both the direction of the influence that each crop has on productivity (positive sign indicates that the crop increases productivity and negative sign suggests that the crop decreases productivity), and the magnitude of the influence (since the crop variables are all proportions of the county, the size of the coefficients indicate the magnitude of the effect). We report both the partial R2 attributable to each crop (determined by type III errors) and the overall model R2 after each step. RESULTS
Precultivation productivity County level precultivation ANPP estimates averaged 164 g C/m2 and ranged from 39 g C/m2 in the western part of the Great Plains to 336 g C/m2 in the east (Figs. 2A, 3). Annual ANPP of native vegetation for the region was estimated at 0.253 Pg C/yr. Estimates of precultivation BNPP averaged 122 g C/m2 and ranged from 86 g C/m2 for counties in the southwest to 165 g C/m2 in the eastern part of the region (Figs. 2D, 4). We estimated yearly regional BNPP as 0.208 Pg C/yr. Combining native ANPP and BNPP produced native NPP estimates averaging 285 g C/m 2 and ranging from 125 g C/m2 to 501 g C/m2 (Fig. 4) with a yearly regional NPP estimate of 0.461 Pg C/yr. As expected in water-limited systems, precultivation NPP patterns were strongly linked to precipitation (Fig. 3A) and generally increased from west to east (Sala et al. 1988: Fig. 2G).
Ecology, Vol. 86, No. 7
95% (Appendix B) and the regional total is 0.173 Pg, or 34% of current productivity.
Comparison between precultivation and current productivity Comparing county values of total current productivity with and without cropping suggested that cropping has had more positive than negative influences on carbon uptake (Fig. 5). Comparison of aboveground productivity estimates from current crop statistics and native vegetation indicated that cropping has increased ANPP by an average of 37 g C/m2 with a minimum of 236 g and maximum of 1408 g C/m2 (Fig. 4). However, our results suggested a negative effect of cropping on BNPP, with an average change of 211 g C/m2 (range from 262 to 123 g C/m2; Fig. 4). ANPP and BNPP combined to produce a positive effect on total NPP averaging 26 g C/m2 (from 286 to 1411 g C/m2; Fig. 4). Not surprisingly, heavily cropped counties in the central part of the region displayed the greatest change (Fig. 2B, H). For the calculations used in this study, we assumed uncultivated areas to be native vegetation, so the maximum potential change in productivity is related to the proportion of the county that is cropped. Consequently, counties with a high proportion of cropping (Fig. 1) had a commensurately high potential for altered productivity in the form of increased ANPP or decreased BNPP (Fig. 6). The positive effect of cropping on ANPP and negative effect on BNPP combine to alter carbon allocation patterns to favor aboveground production. This result is especially evident in heavily cropped counties in the northeast part of the U.S. Great Plains (Appendix C). These results indicate a regional yearly increase of 0.066 Pg C/yr for ANPP, a decrease of 0.020 Pg C/yr for BNPP, and an increase of 0.046 Pg C/yr for NPP.
Current productivity Our estimates of current county ANPP averaged 177 g C/m2 with a range of 42–620 g C/m2 (Fig. 4) and displayed spatial patterns that generally increase with precipitation from west to east (Fig. 2C). However, precipitation had a much weaker relationship with current NPP (R2 5 0.289) than it did with native NPP ( R2 5 0.667; Fig. 3). County values of current ANPP combined to estimate a regional yearly ANPP of 0.319 Pg C/yr. Current BNPP estimates ranged from 59 to 157 g C/m2, averaged 105 g C/m2, and generally increased from southwest to northeast (Figs. 2E, 4). Summing county BNPP results over the entire region yielded regional annual BNPP estimate of 0.188 Pg C/yr. NPP estimates under current conditions averaged 282 g C/m2 and ranged from 129 to 749 g C/m2 (Fig. 4). Over the entire region, we estimated current yearly NPP as 0.507 Pg C/yr. Our data indicate that 25.1% of this region is currently cropped (Table 1), that the percentage of primary productivity accounted for by cropping for individual counties ranges between zero and
Characterization of productivity change All five of the major crops (corn, wheat, soybean, sorghum, and hay) were significantly related to the estimated change in NPP, ANPP, and BNPP between precultivation and postcultivation, with P , 0.01 in all cases except sorghum and NPP (Table 2). The complete models, which include all five crops and an intercept, explained 89% of the variance in ANPP change, 74% of the variance in BNPP change, and 83% of the NPP change, and all have 624 degrees of freedom. Corn, wheat, and sorghum are all positively related to ANPP change, with corn having the largest effect, followed by sorghum. Soybean and hay both have modest negative effects on ANPP (Table 2). BNPP change has small positive relationships with both corn and hay, but has negative relationships of larger magnitude with soybean, sorghum, and wheat (Table 2). Total NPP change shows a very large positive correlation with corn, and smaller positive effects of sorghum and wheat (Table 2). On the other hand, NPP is negatively related
July 2005
CROP IMPACTS ON PRIMARY PRODUCTIVITY
1867
FIG. 2. Precultivation, current, and change in aboveground, belowground, and total net primary productivity in the U.S. Great Plains, by county.
1868
JOHN B. BRADFORD ET AL.
Ecology, Vol. 86, No. 7
FIG. 3. Aboveground productivity as a function of mean annual precipitation (MAP) for counties in the U.S. Great Plains under (A) precultivation conditions and (B) native conditions. In panel (B), each number represents a county, and number values refer to the percentage class of cropped area in each county that is irrigated: 0 indicates 0–10% irrigated, 1 indicates 10–20% irrigated, and so forth.
FIG. 4. Box plots showing the distribution of county-level estimates of precultivation, current, and change in total net primary productivity (NPP), aboveground net primary productivity (ANPP), and belowground net primary productivity (BNPP). Solid lines in the boxes represent the median; dashed lines represent means. Box boundaries indicate 25th and 75th percentiles, while capped vertical lines show 10th and 90th percentiles. Dots show all outliers.
July 2005
CROP IMPACTS ON PRIMARY PRODUCTIVITY
1869
FIG. 5. Current net primary productivity vs. precultivation net primary productivity for counties in the U.S. Great Plains. Each data point represents a county, and number values refer to the percentage class of cropped area in each county that is irrigated: 0 indicates 0–10% irrigated, 1 indicates 10–20% irrigated, and so forth.
to soybean and hay, with soybean indicating a large negative effect and hay a much smaller effect. DISCUSSION
FIG. 6. Change in net primary production (g/m2) as a function of cropping intensity (proportion of the county that is cropped) for counties in the U.S. Great Plains. Each data point represents a county, and number values refer to the percentage class of cropped area in each county that is irrigated: 0 indicates 0–10% irrigated, 1 indicates 10–20% irrigated, and so forth.
We estimated that cultivation has increased aboveground net primary productivity (ANPP) by 0.066 Pg C/yr, decreased belowground net primary productivity (BNPP) by 0.020 Pg C/yr, and increased net primary productivity (NPP) by 0.046 Pg C/yr. These estimates represent a 26% increase in ANPP, a 10% decrease in BNPP, and a 10% increase in total NPP. DeFries et al. (1999) used independent data sources and concluded that conversion to agriculture has increased NPP in North America by 0.102 Pg C/yr. Our estimate of NPP increase in the U.S. Great Plains is roughly half of the continental estimate generated by DeFries et al. (1999), and appears reasonable considering the intensity of agriculture in the U.S. Great Plains when compared to much of the rest of the continent. By comparison, estimates of the net carbon sink (net primary production minus decomposition) are 0.3–0.6 Pg C/yr for the conterminous United States (Pacala et al. 2001). Our overall observation that cropping increases both NPP and ANPP is consistent with other observations (DeFries et al. 1999) for semiarid temperate areas (Guerschman et al. 2003), but may not apply to more mesic or subtropical regions (Paruelo et al. 2004) Our estimates of both native and current ANPP values and spatial patterns are consistent with prior studies of ANPP for native vegetation in the Great Plains (Sala et al. 1988, Epstein et al. 1997, Lauenroth et al. 1999). Similar to previous studies, we observed a positive linear relationship between precipitation and ANPP for grassland areas (Lauenroth 1979). The existence of a relationship between precipitation and current ANPP suggests that precipitation is still an important determinant of production, but the fact that the relationship is weaker than under native conditions indicates that cultivation is at least partially removing these grassland
JOHN B. BRADFORD ET AL.
1870
Ecology, Vol. 86, No. 7
TABLE 2. Results from stepwise linear regressions of the change in total net primary productivity (NPP), aboveground net productivity (ANPP), and belowground net productivity (BNPP) as a function of the cropping intensity of corn, soybeans, wheat, hay, and sorghum.
Pool NPP
ANPP
BNPP
Parameter estimate
Step
Partial R2
Model R2
P
intercept corn soybeans wheat hay sorghum
24.71 667.72 2302.05 70.43 2101.45 76.83
1 2 3 4 5
0.7343 0.0743 0.0146 0.0025 0.0016
0.7343 0.8086 0.8231 0.8257 0.8272
,0.0001 ,0.0001 ,0.0001 0.0027 0.0176
intercept corn wheat soybeans hay sorghum
21.97 631.53 131.21 2170.43 2122.52 191.07
1 2 3 4 5
0.7946 0.0583 0.0234 0.0095 0.0038
0.7946 0.8529 0.8763 0.8858 0.8896
,0.0001 ,0.0001 ,0.0001 ,0.0001 ,0.0001
intercept soybeans wheat sorghum corn hay
22.74 2131.62 260.78 2114.24 36.19 21.07
1 2 3 4 5
0.2578 0.3511 0.0796 0.0474 0.0029
0.2578 0.6088 0.6885 0.7359 0.7388
,0.0001 ,0.0001 ,0.0001 ,0.0001 0.0087
Variable
ecosystems from climatic constraints to productivity. Our BNPP estimates are also consistent with empirical grassland BNPP measurements (Gill et al. 2002). Our NPP values are very similar to those of Prince et al. (2001), who also used crop statistics to estimate production for counties in the eastern part of this region. Comparing these results to previous site-level studies is inherently difficult because values from this study represent entire counties containing diverse land use types, whereas other studies typically measure NPP for specific sites within a county that may represent one or a few land use types. Lauenroth et al. (2000) calculated ANPP of winter wheat in 19 counties across a transect between northeast Colorado and northern Kansas and estimated ANPP at ;150 g C/m2. Our wholecounty estimates for the same 19 counties averaged 144 g C/m2, slightly lower because we included uncropped areas that are likely to have slightly lower ANPP. Our results indicate that many of the counties with especially large changes in primary production (Figs. 5, 6) and high current NPP relative to mean annual precipitation (Fig. 3) are counties with substantial irrigation in cropped areas. This suggests that irrigation may be accounting for much of the change in primary productivity as a consequence of cropping practices. In semiarid areas, water availability is crucially important for vegetation dynamics (Noy-Meir 1973), so it is not surprising that widespread irrigation elevates primary production. Although our analysis did not explicitly address the affects of fertilization, it is also reasonable to expect that fertilizer additions in cropped areas may contribute to our observations of increased net primary productivity. Our results suggest that 34% of the total primary productivity in this region is now accounted for by cultivation. Global estimates suggest that approximately one-third of total primary production is utilized
by all human activities (Vitousek et al. 1986). However, more recent analyses of uncertainty have indicated that the actual value may lie somewhere between 10 and 55%, and have identified large-scale agricultural production as a primary source of the uncertainty (Rojstaczer et al. 2001). Our results provide a more accurate estimate of the fraction of regional primary production accounted for by cropping in this region. However, this estimate does not consider the primary production that is utilized by livestock grazing, a nearly ubiquitous practice in much of the uncultivated U.S. Great Plains, or other human endeavors. Consequently, we expect the actual value of total primary productivity appropriated by humans to be substantially .34% for the U.S. Great Plains. Our finding that approximately one-third of primary production is represented by cultivated crops raises important questions about the fate and sustainability of the observed 10% increase in regional production. Assuming that roughly 50% of primary production in cultivated crops is harvested and removed from the field (Appendix A), our results imply that 17% of net primary production is removed from the U.S. Great Plains. Continuous biomass removals of this magnitude will have important impacts on carbon storage and the longterm fertility of these ecosystems. Substantial data have accumulated documenting both losses of soil organic carbon and well as associated nutrients and these findings have resulted in a large number of experiments investigating alternative strategies to mitigate these losses (Paul et al. 1997). In addition to modifications of total primary production, our results indicate that cultivation is causing a large-scale alteration of carbon allocation patterns to favor aboveground biomass (Appendix C). This modification of allocation patterns as a result of cultivation
July 2005
CROP IMPACTS ON PRIMARY PRODUCTIVITY
has been previously observed at small scales (Smith 2003) and may have consequences for long-term carbon storage due to different decomposition rates for aboveground vs. belowground litter. The relationships between specific crops and changes in productivity are consistent with expectations based on life history strategies and previous results. Corn is one of the most productive cereal crops grown in this region (Goudriaan et al. 2001), is a frequent choice for irrigated fields, and is therefore likely to cause increased ANPP and NPP. In the western part of the region, irrigation is primarily concentrated on corn crops, because these have the highest potential for economic return. Since hay plants are perennial and, like native grasses, are likely to invest substantial resources in belowground structures, it is logical to expect hay to have minimal impact on both ANPP and BNPP compared to other annual crops. Soybean, sorghum, and wheat have intermediate biomass production, are not as commonly irrigated, and, because they are annuals, they are unlikely to invest substantial resources belowground. Thus the observed negative relationships between these crops and BNPP are not surprising. The positive relationship between both sorghum and wheat and the change in ANPP is likely a consequence of these crops allocating most of their growth to aboveground structures and taking advantage of fertilization. Soybean, on the other hand, has high energy content in the yield component and consequently has relatively small biomass production (Eastin et al. 1983), and is therefore most likely to have negative consequences for ANPP. The results suggest that the direction of relationships between specific crops and productivity change and the magnitude of the observed effects varies among crops; individual crops often can have different, even opposing relationships with aboveground and belowground productivity change. Consequently, the localized impact of cultivation on productivity depends on the area and type of crops grown in a particular region, as well as climatic (including irrigation) and edaphic (including fertilization) conditions. Characterizing the implications of these results for atmospheric carbon budgets requires an understanding of how cropping has influenced carbon storage and decomposition rates. Thus combining these results with large-scale estimates of soil carbon pools may provide insight into the overall carbon consequences of cropping. Nevertheless, this study suggests that cropping has altered, and continues to alter, primary productivity in the U.S. Great Plains. These results are rare in their quantification of largescale, long-term relationships between land use practices and ecosystem processes. ACKNOWLEDGMENTS We thank C. Bennett for assistance with spatial data processing and G. Peterson for valuable input on early drafts. This work was supported by a NSF graduate fellowship and a NASA ESS fellowship to J. B. Bradford. This research was
1871
also funded in part by National Science Foundation Grant DEB0217631 to the SGS LTER. LITERATURE CITED Burke, I. C., W. K. Lauenroth, and D. G. Milchunas. 1997. Biogeochemistry of managed grasslands in the Central Grasslands of the U.S. Pages 85–101 in E. Paul, K. Paustian, and E. T. Elliott, editors. Organic matter in U.S. agroecosystems. CRC Press, Boca Raton, Florida, USA. Buyanovsky, G. A., C. L. Kucera, and G. H. Wagner. 1987. Comparative analyses of carbon dynamics in native and cultivated ecosystems. Ecology 68:2023–2031. Dale, V. H. 1997. The relationship between land-use change and climate change. Ecological Applications 7:753–769. Dale, V. H., R. A. Houghton, and C. A. S. Hall. 1991. Estimating the effects of land-use change on global atmospheric CO2 concentrations. Canadian Journal of Forest Research 21:87–90. DeFries, R. S., C. B. Field, I. Fung, G. J. Collatz, and L. Bounoua. 1999. Combining satellite data and biogeochemical models to estimate global effects of human-induced land cover change on carbon emissions and primary productivity. Global Biogeochemical Cycles 13:803–815. Eastin, J. D., T. E. Dickinson, D. R. Krieg, and A. B. Maunder. 1983. Crop physiology in dryland agriculture. Pages 334– 364 in H. E. Dregne and W. O. Willis, editors. Dryland agriculture. Soil Science Society of America, Madison, Wisconsin, USA. Epstein, H. E., W. K. Lauenroth, and I. C. Burke. 1997. Effects of temperature and soil texture on aboveground net primary production in the U.S. Great Plains. Ecology 78: 2628–2631. ESRI. 1996. ARCINFO, Version 7.03. Environmental Systems Research Institute (ESRI). Redlands, California, USA. Fan, S., M. Gloor, J. Mahlman, S. Pacala, J. Sarmiento, T. Takahashi, and P. Tans. 1998. A large terrestrial carbon sink in North America implied by atmospheric and oceanic carbon dioxide data and models. Science 282:442–446. Field, C. B., J. T. Randerson, and C. M. Malmstrom. 1995. Global net primary production: combining ecology and remote sensing. Remote Sensing of Environment 51:74–88. Gill, R. A., R. H. Kelly, W. J. Parton, K. A. Day, R. B. Jackson, J. A. Morgan, J. M. O. Scurlock, L. L. Tieszen, J. V. Castle, D. S. Ojima, and X. S. Zhang. 2002. Using simple environmental variables to estimate belowground productivity in grasslands. Global Ecology and Biogeography 11:79–86. Goudriaan, J., J. J. R. Groot, and W. J. Uithol. 2001. Productivity of agro-ecosystems. Pages 301–314 in H. A. Mooney, editor. Terrestrial global productivity. Academic Press, San Diego, California, USA. Guerschman, J. P., J. M. Paruelo, and I. C. Burke. 2003. Land use impacts on the normalized difference vegetation index in temperate Argentina. Ecological Applications 13:616– 628. Houghton, R. A. 1995. Land-use change and the carbon cycle. Global Change Biology 1:275–287. Houghton, R. A., J. L. Hackler, and K. T. Lawrence. 1999. The U.S. carbon budget: contributions from land-use change. Science 285:574–578. Kucharik, C. J., K. R. Brye, J. M. Norman, J. A. Foley, S. T. Gower, and L. G. Bundy. 2001. Measurement and modeling of carbon and nitrogen cycling in agroecosystems of Southern Wisconsin: potential for SOC sequestration during the next 50 years. Ecosystems 4:237–258. Kuchler, A. W. 1964. Potential natural vegetation of the coterminous United States. Special Publications 36. American Geographical Society, New York, New York, USA. Lauenroth, W. K. 1979. Grassland primary production: North American grasslands in perspective. Pages 3–24 in N. R. French, editor. Perspectives in grassland ecology. Ecolog-
1872
JOHN B. BRADFORD ET AL.
ical Studies. Volume 32. Springer-Verlag, New York, New York, USA. Lauenroth, W. K. 2000. Methods of estimating belowground net primary production. Pages 31–43 in O. E. Sala, R. B. Jackson, H. A. Mooney, and R. W. Howarth, editors. Methods in ecosystem science. Springer-Verlag, New York, New York, USA. Lauenroth, W. K., and I. C. Burke. 1995. Great Plains, climate variability. Pages 237–249 in W. A. Nierenberg, editor. Encyclopedia of environmental biology. Academic Press, New York, New York, USA. Lauenroth, W. K., I. C. Burke, and M. P. Gutmann. 1999. The structure and function of ecosystems in the central North American grassland region. Great Plains Research 9:223–259. Lauenroth, W. K., I. C. Burke, and J. M. Paruelo. 2000. Pattern of production and precipitation-use efficiency of winter wheat and native grasslands in the Central Great Plains of the United States. Ecosystems 3:344–351. Lauenroth, W. K., H. W. Hunt, D. M. Swift, and J. S. Singh. 1986. Estimating aboveground net primary productivity in grasslands: a simulation approach. Ecological Modeling 33:297–314. Law, B. E., and R. H. Waring. 1994. Combining remote sensing and climatic data to estimate net primary production across Oregon. Ecological Applications 4:717–728. Lieth, H. 1975. Modeling the primary productivity of the world. Pages 237–263 in H. Lieth and R. H. Whittaker, editors. Primary productivity of the biosphere. SpringerVerlag, New York, New York, USA. Martin, J. H., W. H. Leonard, and D. L. Stamp. 1976. Principles of field crop production. Macmillan, New York, New York, USA. Moulin, S., A. Bondeau, and R. Delecolle. 1998. Combining agricultural crop models and satellite observations: from field to regional scales. International Journal of Remote Sensing 19:1021–1036. NASS. 1998. Acreage. Publication number Cr Pr 2–5 (6– 98). National Agricultural Statistics Service (NASS), USDA, Washington, D.C., USA. Noy-Meir, I. 1973. Desert ecosystems: environment and producers. Annual Review of Ecology and Systematics 4:25– 51. Pacala, S. W., et al. 2001. Consistent land- and atmospherebased U.S. carbon sink estimates. Science 292:2316–2320. Parton, W. J., J. M. O. Scurlock, D. S. Ojima, T. G. Gilmanov, R. J. Scholes, D. S. Schimel, T. Kirchner, J. C. Menaur, T. Seastedt, E. Garcia Moya, A. Kamnalrut, and J. I. Kinyamario. 1993. Observations and modeling of biomass and soil organic matter dynamics for the grassland biome worldwide. Global Biogeochemical Cycles 7:785–809. Paruelo, J. M., M. F. Garbles, J. P. Guerschman, and E. G. Jobbery. 2004. Two decades of normalized difference veg-
Ecology, Vol. 86, No. 7
etation index changes in South America: identifying the imprint of global change. International Journal of Remote Sensing 25:1–14. Paul, E., K. Paustian, E. T. Elliot, and C. V. Cole. 1997. Soil organic matter in temperate agroecosystems. CRC Press, Boca Raton, Florida, USA. Paustian, K., C. V. Cole, D. Sauerbeck, and N. Sampson. 1999. CO2 mitigation by agriculture: an overview. Climatic Change 40:135–162. Potter, C. S., S. Closter, and V. Brooks. 1999. Interannual variability in terrestrial net primary production: exploration of trends and controls on regional to global scales. Ecosystems 2:36–48. Potter, C. S., J. T. Randerson, C. B. Field, P. A. Matson, P. M. Vitousek, H. A. Mooney, and S. A. Closter. 1993. Terrestrial ecosystem production: a process model based on global satellite and surface data. Global Biogeochemical Cycles 7:811–841. Prince, S. D., J. Haskett, M. Steininger, H. Strand, and R. Wright. 2001. Net primary production of U.S. Midwest croplands from agricultural harvest yield data. Ecological Applications 11:1194–1205. Richards, J. F. 1990. Land transformations. Pages 163–201 in B. L. Turner, W. C. Clark, R. W. Kates, J. F. Richards, J. T. Mathews, and W. B. Meyer, editors. The Earth as transformed by human action. Cambridge University Press, Cambridge, UK. Rojstaczer, S., S. M. Sterling, and N. J. Moore. 2001. Human appropriation of photosynthesis products. Science 294: 2549–2552. Sala, O. E., W. J. Parton, L. A. Joyce, and W. K. Lauenroth. 1988. Primary production of the central grassland region of the United States. Ecology 69:40–45. SCS. 1976. National range handbook. U.S. Department of Agriculture, Soil Conservation Service, Washington, D.C., USA. Smith, D. 2003. Primary production and soil water dynamics in the shortgrass steppe and summer fallow winter wheat. Thesis. Colorado State University, Fort Collins, Colorado, USA. USDA Soil Conservation Service. 1989. State soil geographic data base, STATSGO. National Cartographic Center, Fort Worth, Texas, USA. Vitousek, P. M. 1994. Beyond global warming: ecology and global change. Ecology 75:1861–1876. Vitousek, P. M., P. R. Ehrlich, A. H. Ehrlich, and P. A. Matson. 1986. Human appropriations of the products of photosynthesis. Bioscience 36:368–373. Wessman, C. A. 1992. Spatial scales and global change: bridging the gap from plots to GCM grid cells. Annual Review of Ecology and Systematics 23:175–200. Wiens, J. A. 1989. Spatial scaling in ecology. Functional Ecology 3:385–397.
APPENDIX A Values and references for allocation ratios and harvest indices for agricultural crops in the U.S. Great Plains are available in ESA’s Electronic Data Archive: Ecological Archives E086-098-A1.
APPENDIX B A figure showing the proportion of current net primary production that is accounted for by cropping in counties of the U.S. Great Plains is available in ESA’s Electronic Data Archive: Ecological Archives E086-098-A2.
APPENDIX C A figure showing carbon allocation ratio, expressed as belowground productivity divided by aboveground productivity for counties in the U.S. Great Plains under native and current (cropped) conditions is available in ESA’s Electronic Data Archive: Ecological Archives E086-098-A3.