The Housing Market and Europe's Unemployment: A Non-Technical Paper
May 1999
Andrew J Oswald Department of Economics University of Warwick CV4 7AL United Kingdom Email
[email protected] Tel. (44) 01203 523 510
Andrew Oswald is Professor of Economics at Warwick University in England. He has also taught at Oxford and the London School of Economics, and in the United States at Dartmouth and Princeton. His book The Wage Curve, published by MIT Press, recently won Princeton University's Lester Prize.
1
The Housing Market and Europe's Unemployment Andrew Oswald 1. Introduction This paper argues that the housing market lies at the heart of the European unemployment problem. It describes a practical suggestion to reduce joblessness in Europe's nations -- that our continent should revive private renting and try to make the housing market function more smoothly. We can put Europe back to work, the essay argues, by reducing home ownership. It is worth beginning with three background facts. Of the major industrial nations • Spain has the highest unemployment, and also the highest rate of home ownership • Switzerland has the lowest unemployment, and the lowest rate of home ownership • In the 1950s and early 60s, the United States had the highest unemployment, and at that time had the highest rate of home ownership. The underlying argument in the paper is that an economy's 'natural rate' of unemployment depends on the ease with which its citizens can move around to find jobs. Fluid societies have efficient economies. Although Milton Friedman pointed this out in his famous American Economic Association address of 1967, few European economists have thought hard about labour mobility and different forms of accommodation. Yet we know the housing market is likely to have an influence on the degree of labour mobility. By making it expensive to change location, high levels of home-ownership foster spatial mis-match between workers' skills and the available jobs. Friedman does not mention the housing market in his Address. However, the data in Figure 1 for 1960, suggesting a remarkable correlation between ownership and unemployment levels, were available when he was preparing his lecture. If Milton Friedman had stumbled upon the graph, and published it in his AEA address paper, it is possible European history would have been different. With the exception of Switzerland (which has had lower unemployment than almost all other Western countries), the nations of Europe have, by conscious design, seen strong growth in home-ownership since the 1950s. Spain is a good example: it now has a home ownership rate of 80% compared to less than 40% after the Second World War. European governments today continue to offer subsidies to try to persuade their people to give up rental housing and become owner-occupiers. The evidence in this paper, however, raises doubts about the wisdom of providing tax breaks to those who own homes. 2
2. The Main Ideas and Evidence Economies need to be adaptable. In an ever-changing world, countries require workers to be able to move around to find new jobs. Private rental housing helps. Renting allows people to be mobile: it provides a way for a square peg in Zurich to drop into a square hole in Geneva. In the period from 1950 to 1960, most European nations had low owner-occupation rates and low unemployment rates. The United States then had relatively high owner-occupation of 60%. At that time -- this fact tends to be forgotten by young economists -- the US had the highest unemployment rate in the industrialized world. Americans gazed in wonder at the low joblessness across the Atlantic and pondered if they too should aim for a generous welfare state and strong trade unions. Since then, US home ownership has been constant through the years (like the trend in its unemployment). All the other industrialized nations except Japan and Switzerland have witnessed a large increase in home ownership. Unemployment rates have risen most quickly in the nations with the fastest growth in home ownership. The graphs at the end of the essay provide an informal look at the evidence. Figures 2 and 3 illustrate the current position: nations where many people rent have less joblessness than nations where home-ownership is the norm. According to the slope in Figure 3, a rise of ten percentage points in the extent of private renting is associated with a rise of four percentage point in the proportion of men working (statistics on females' work are a less reliable indicator because they are influenced by national cultures). Figures 4 and 5 show that similar patterns are found even inside countries. The link between housing and jobs appears to hold across space within a country as well as across different countries. This relationship can be found in many nations' regions, but only two are presented here. Figure 4 is for the cantons of Switzerland. It is included because it might be thought this is the least likely country where the paper's ideas would fit the data. Figure 5 is for the United States and is included here for a similar reason, and to show that the mechanisms run deeper than being specific to Europe's institutions. 3. What Are the Likely Mechanisms? The processes behind these correlations are not fully understood, but there are five likely links in the chain. First, there is a direct effect from home ownership. Selling a home and moving is expensive. For this reason, indeed, many home owners who lose their jobs are 3
willing to commute long distances to find work. Hence owner occupiers are less mobile than renters, and therefore more vulnerable to economic douwnturns in their region. Neverthless, this probably cannot be the whole story. If we look at countries like Spain and the UK, a key part of the problem is young unemployed people living at home, unable to move out because the rental sector hardly exists. Therefore, second, part of the difficulty is not that unemployed people are themselves the home owners; it is that unemployed men and women cannot move into the right places. High home ownership levels block young people's ability to enter an area to find a job. Those without capital to buy are at a particular disadvantage in a world where ownership is the dominant form of housing tenure. Third, in an economy in which people are immobile, workers do jobs for which they are not ideally suited. This inefficiency is harmful to everyone: it raises costs of production and lowers real incomes in a country. Prices thus have to be higher, and real wages lower, than in a more mobile society. Jobs get destroyed -- or more precisely priced out of existence -- by such inefficiences. Fourth, areas with high home ownership levels may act to deter entrepreneurs from setting up new operations. Planning laws and restrictions on land development, enforced by the local political power of groups of home owners, may discourage business start-ups. Fifth, we know from survey data that home owners commute much more than renters, and over longer distances, and this may lead to transport congestion that makes getting to work more costly and difficult for everyone. Technically speaking, this acts like higher unemployment benefits, because it reduces the gain from having a job. If getting to work is more expensive, that has the same net effect as raising the attractiveness of not working. 4. Comparing the Strength of the Home-Ownership Theory with Other Explanations Economists have tried for a long time to understand why OECD joblessness has risen from around 2% in the 1950s to approximately 10% today. The standard explanations are that trade unions have become too powerful, unemployment benefits are now too generous, and labour markets are too highly taxed and not sufficiently flexible. It is probable these ideas have some role to play in the whole answer. However, if we look in detail at nations, the data do not provide much support for these otherwise plausible ideas. Those countries with the worst unemployment problems, for example, do not have especially high unemployment benefits or strong unions. Conventional wisdom is more the result of theoretical preconception than a weighing of hard evidence. Figures 6, 7 and 8 provide an informal illustration of the empirical difficulty faced by 4
orthodox arguments. There is a little evidence that high-benefits countries have slightly greater unemployment (in Figure 6), but the size of the effect is not large. The other two graphs show the correlations between unemployment and labour taxes, and unemployment and unionism. Both are weak. On a final and more technical point, it is straightforward to estimate so-called fixedeffects and random-effects models on large panels of European countries and panels of regions within countries, to use micro data, and to do further more complex checks. These regressions hold constant other variables (including the proportion of women working, age structure of the population, and the so-called Layard-Nickell variables). Housing variables continue to have large estimated effects and to be statistically significant at normal confidence levels. Allowing for interest-rate and other macroeconomic effects also leaves the correlations unaffected. It might be thought, finally, that reverse causality is a possibility -- that high levels of unemployment lead to large amounts of home ownership. Apart from the instrisic implausibility of this kind of argument, it can be shown using two-stage least squares methods that there are reasons to doubt such a view. All this technical material is omitted. 5. Conclusion Although much remains to be learned, the housing market may contain the key to a puzzle that has defied us for a long time. We can put Europe back to work, this essay suggests, by reducing home-ownership. Renting worked in the 1950s and can work again. Europe can too.
5
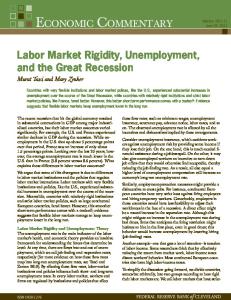
Figure 1 Home-Ownership and Unemployment Rates Forty Years Ago: The Countries of North America and Europe in 1960
6
Unemployment % 1960
5
4
3
2
1
0 20
30
40
50
60
70
Home ownership % 1960
Each dot is a country. The countries are Austria (u = 2%, h = 38%), Belgium (2.4, 50), Canada (4.7, 66), Denmark (1.5, 43), France (1.7, 41), West Germany (0.7, 29), Ireland (5, 60), Italy (3.6, 45), Netherlands (1.1, 29), Norway (2, 53), Spain (2.4, 52), Sweden (1.6, 36), Switzerland (0.1, 34), United Kingdom (2.6, 42) and United States (4.7, 64). The unemployment rates are from the OECD and are as close as can be obtained to standardized data for that era. I have omitted Finland from the Figure because I have doubts about the reliability of its data: it has the lowest male employment/population ratio in the sample while recording ostensibly low unemployment. I have omitted the Communist bloc because data are not available. The home ownership rates are so-called 'owner-occupation' proportions from national censuses, and were generously provided by Francis Castles of the Political Science Program, RSSS, Australian National University, Canberra.
6
Figure 2 Unemployment Rates and Owner-Occupation Rates Today: The Main European Nations in the 1990s
Unemployment % c.1998
20
10
0 20
30
40
50
60
70
80
90
Home ownership % 1990s Each dot is a country. The observations are Austria (h=54%, u=5%), Belgium (65, 12), UK (65, 6), Denmark (55, 6), France (56, 11), W. Germany (42, 7), Italy (68, 12), Netherlands (45, 4), Spain (80, 18), Sweden (56, 6), Switzerland (28, 3), Ireland (76, 10), Finland (78, 13). Data for transition nations are not reliable and are omitted. The unemployment data are the latest OECD numbers, and the owner-occupation rates are as recent as possible and are taken from UN census or similar sources.
7
Figure 3 The Relationship Between Countries' Employment Rates and the Size of their Privated Rented Housing Markets: 25 Industrial Nations in the 1990s y = 65.391 + 0.38972x R^2 = 0.443
Employ/Popn Males c.1992
100
90
80
70
60
50 0
10
20
30
40
50
60
70
1990s Private Renting % (balch) The vertical axis is the male employment rate, expressed as a proportion of population. This is for men of ages 15-65. These data are for circa 1992 and come mostly from the OECD Employment Outlook, July 1995, Table A, 1992 column, p.204. For the Czech Republic, Hungary and Poland, the data are for 1993, and come from Table B, p.164, of OECD Employment Outlook July 1997. The horizontal axis is the proportion of people who rent. The data on housing are principally from Table 1.12, page 11, of Housing Policy in Europe, edited by Paul Balchin, Routledge, London and New York, 1996. For the Czech Republic, Hungary and Poland, the data come from the later pages of Balchin, including p.286. For New Zealand and Australia, the data are taken from p.184 of From Public Housing to the Social Market, edited by J. Kemeny, Routledge, London and New York, 1995. Marion Steele of the University of Guelph provided helpful information about Canada. Japanese and US data were imputed by making a small adjustment to (1 - home ownership rate), calculated from UN census data. The countries are Canada (renting % = 34, Employ/pop % = 69.5), Switzerland (60, 91.4), Japan (38, 87.8), Sweden (16, 76.7), Norway (18, 77.3), France (21, 68.5), Australia (20, 75.7), USA (32, 78.8), Netherlands (17, 76.5), UK (10, 73.6), W Germany (36, 74), Austria (22, 77.8), Belgium (30, 67.3), Denmark (24, 80.7), Finland (11, 66.6), Luxembourg (31, 76.8), New Zealand (20, 74), Ireland (9, 67.8), Italy (8, 72.9), Spain (16, 64.6), Greece (26, 69.1), Czec Rep (11, 78.1), Hungary (2, 55.6), Portugal (28, 79.4), Poland (3, 65.9). [ Technical note This graph is not greatly influenced by outliers. Omitting the two most favourable observations, Switzerland and Hungary, alters the gradient to 0.26 with a well-defined t statistic. ]
8
Figure 4 The Correlation Between the Growth of Home-Ownership and Unemployment Across the Cantons of Switzerland from the 1970s to the 1990s
Change in unem % '72-97
8 7 6 5 4 3 2 1 -10
0
10
Change in home owner % '70-90 Each dot is a Swiss canton. The horizontal axis gives the twenty-year change for home ownership, that is, the 1990 figure minus the 1970 figure. The vertical axis is the change in the unemployment rate from 1972 to 1997. The observations are Zurich (∆h=3.1%, ∆u=5.2%), Bern (1.4, 4.4), Luzern (2.1, 4.3), Uri (1.3, 2.4), Schwyz (0.6, 2.8), Obwalden (-7.1, 2.3), Nidwalden (-3.9, 2.6), Glarus (-2.8, 2.9), Zug (4.1, 3.9), Freiburg (1.7, 4.7), Solothurn (4.0, 6.0), Basel-Stadt (-0.4, 4.9), Basel-Land (2.2, 3.7), Schaffhausen (4.3, 5.3), Appenzell a. Rh (-1.1, 2.5), Appenzell i. Rh (-4.9, 1.9), St Gallen (0.6, 4.0), Graubunden (-0.6, 3.2), Aargau (1.2, 4.7), Thurgau (0.4, 4.3), Tessin (3.6, 7.8), Waadt (5.3, 7.2), Wallis (3.7, 6.9), Neuenburg (8.2, 6.3), Genf (4.8, 7.8). The data sources are BFS and BWA. The axes are in percentage points; thus a canton that went from 2% to 3% unemployment and from 40% home-ownership to 46% home-ownership would appear as (6, 1).
9
Figure 5 The Correlation Between the Growth of Home-Ownership and Unemployment Across the States of the USA: 1970 to 1990
Change in unemployment '70-90
6
4
2
0
-2
-4 -10
0
10
20
Change in home-ownership '70-90
Each dot is a state of the US. These are twenty-year changes, that is, the 1990 figure minus the 1970 figure. There are 49 observations, one for each of the mainland states of the US (Hawaii and Alaska are omitted) plus DC. The axes are in percentage points; thus a state that went from 4% to 6% unemployment and from 40% home-ownership to 48% home-ownership would appear as (8, 2). The data are from the BLS and the Statistical Abstract of the US. Note: Removing the outlier points in the lower left hand portion of this graph does not eliminate a statistically significant upward-sloping line. The reason, intuitively, is that within the central clump of points there is a strong upward-sloping cluster.
10
Figure 6 Countries with More Generous Unemployment Benefits Have Only Slightly More Unemployment y = 5.5745 + 8.1891e-2x R^2 = 0.066
Unemployment rate '89-94
20
10
0 0
10
20
30
40
50
60
Benefit generosity oecd 1991
Each dot is a country. The unemployment data are standardized OECD rates and average over the years 1989-94. The benefit generosity variable is taken from the OECD Database on Unemployment Benefit Entitlements and Replacement Rates. It is a summary measure of benefit entitlement before tax as a percentage of previous earnings before tax. It thus combines a country's amount and length of benefits, because the data are averages over different earnings levels, length of unemployment spells, and family situations. The countries are Austria (unemployment = 3.7%, benefits = 31.0 per cent), Belgium (8.1, 42.3), Denmark (10.8, 51.9), Finland (10.5, 38.8), France (10.4, 37.2), West Germany (5.4, 28.1), Ireland (14.8, 29.3), Italy (8.2, 2.5), Netherlands (7.0, 51.3), Norway (5.5, 38.8), Portugal (5.0, 34.4), Spain (18.9, 33.5), Sweden (4.4, 29.4), Switzerland (2.3, 21.9), UK (8.9, 17.5), Canada (9.8, 27.8), US (6.2, 11.1), Japan (2.3, 9.9), Australia (9.0, 26.5), New Zealand (8.9, 30.4).
11
Figure 7 Countries Which Tax Labour Highly Do Not Have More Unemployment
Unemployment rate '89-94
20
10
0 0
10
20
30
40
50
Payroll tax rate %
Each dot is a country. The unemployment data are standardized OECD rates, and the payroll tax data were generously provided by Steve Nickell of the London School of Economics. The countries are Austria (unemployment = 3.7%, payroll tax rate = 22.6 per cent), Belgium (8.1, 21.5), Denmark (10.8, 0.6), Finland (10.5, 25.5), France (10.4, 38.8), West Germany (5.4, 23.0), Ireland (14.8, 7.1), Italy (8.2, 40.2), Netherlands (7.0, 27.5), Norway (5.5, 17.5), Portugal (5.0, 14.5), Spain (18.9, 33.2), Sweden (4.4, 37.8), Switzerland (2.3, 14.5), UK (8.9, 13.8), Canada (9.8, 13.0), US (6.2, 20.9), Japan (2.3, 16.5), and Australia (9.0, 2.5). Data on payroll taxes in New Zealand were unavailable. Fitting a line through the scatter produces a horizontal slope. The R-squared is less than 0.01.
12
Figure 8 Countries with High Trade Union Density Do not Have More Unemployment
Unemployment rate '89-94
20
10
0 0
20
40
60
80
100
Proportion unionized 1990s Each dot is a country. The unemployment data are standardized OECD rates, and the unionizedproportion variable is the proportion of workers in the country who are members of trade unions, which was generously provided by Steve Nickell. The countries are Austria (unemployment = 3.7%, unionized proportion = 46.2 per cent), Belgium (8.1, 51.2), Denmark (10.8, 71.4), Finland (10.5, 72.0), France (10.4, 9.8), West Germany (5.4, 32.9), Ireland (14.8, 49.7), Italy (8.2, 38.8), Netherlands (7.0, 25.5), Norway (5.5, 56.0), Portugal (5.0, 31.8), Spain (18.9, 11.0), Sweden (4.4, 82.5), Switzerland (2.3, 26.6), UK (8.9, 39.1), Canada (9.8, 35.8), US (6.2, 15.6), Japan (2.3, 25.4), Australia (9.0, 40.4), New Zealand (8.9, 44.8). Fitting a line through the scatter produces a negative slope. The R-squared is less than 0.01.
13