1166
J. Phys. Chem. B 2006, 110, 1166-1171
The Electronic Structure of the Hydrated Proton: A Comparative X-ray Absorption Study of Aqueous HCl and NaCl Solutions Christopher D. Cappa,†,‡,§ Jared D. Smith,†,‡ Benjamin M. Messer,†,‡ Ronald C. Cohen,† and Richard J. Saykally*,†,‡ Department of Chemistry, UniVersity of California, Berkeley, California 94720-1460, and Chemical Sciences DiVision, Lawrence Berkeley National Laboratory, Berkeley, California 94720 ReceiVed: June 25, 2005; In Final Form: NoVember 28, 2005
The oxygen K edge X-ray absorption spectra of aqueous HCl and NaCl solutions reveal distinct perturbations of the local water molecules by the respective solutes. While the addition of NaCl leads to large spectral changes, the effect of HCl on the observed X-ray absorption spectrum is surprisingly small. Density functional theory calculations suggest that this difference primarily reflects a strong blue shift of the hydrated proton (in either the Eigen (H9O4+) or Zundel (H2O5+) forms) spectrum relative to that of H2O, indicating the tighter binding of electrons in H3O+. This spectral shift counteracts the spectral changes that arise from direct electrostatic perturbation of water molecules in the first solvation shell of Cl-. Consequently, the observed spectral changes effected by HCl addition are minimal compared to those engendered by NaCl. Additionally, these results indicate that the effect of monovalent cations on the nature of the unoccupied orbitals of water molecules in the first solvation shell is negligible, in contrast to the large effects of monovalent anions.
1. Introduction The nature of the hydrated proton in water and the evolution of molecular geometric and electronic structure during ionic solvation by liquid water are fundamental to understanding the behavior of ions in chemical and biological systems and processes. Unlike most cations (e.g., Na+, K+), the solvated proton does not exist as a free H+ ion, but readily forms highly fluxional covalent complexes with water molecules.1 In the limiting case, H+ exists in water in either the Eigen form2,3 (H9O4+), wherein a central H3O+ moiety donates hydrogen bonds to three water molecules and a fourth water molecule correlated with the H9O4+ complex may exist in the vicinity of the oxygen atom,4 or in the Zundel form5,6 (H5O2+), where the excess proton is shared equally between two water molecules. In the Eigen form, the excess charge of the hydrated proton is delocalized equally over three hydrogen atoms, whereas in the Zundel form, the excess charge is localized on a single hydrogen. Fluctuations in the hydrogen bond network around these complexes lead to charge redistribution among the hydrogen atoms, thereby allowing the proton to be efficiently transported through water. In contrast, the sodium ion is solvated by four to six water molecules in a geometrical arrangement intermediate between trigonal bipyramidal and square pyramidal and does not form covalent bonds with neighboring water molecules.7,8 The influence of these dissolved ions (H+ vs Na+) on the surrounding water structure and dynamics (and vice versa) is thus very different, which has potentially important consequences for aqueous phase reactivity both in the bulk liquid and at the liquid surface. Here, we report on measurements of the effect of dissolved H+ and Na+ cations (and the Cl- counterion) on the electronic * Corresponding author:
[email protected]. † University of California, Berkeley. ‡ Lawrence Berkeley National Laboratory. § Present address: NOAA Earth System Research Laboratory, Chemical Sciences Division, Boulder, Colorado 80305.
structure of liquid water using X-ray absorption (XA) spectroscopy. XA spectroscopy is an element-specific technique that provides information on the local electronic environment of atomic sites within molecules by probing the nature of the unoccupied orbitals. The XA spectrum of liquid water has been shown to be very sensitive to changes in the local electronic environment experienced by the water molecules.9-12 Specifically, the addition of solutes to liquid water engenders distinct changes in the oxygen K edge XA spectrum due to perturbation of the water electronic structure from both direct electrostatic interactions and from geometric distortion of the hydrogen bonding network. The observed spectral variation is unique to the solvated molecule or ions and can be interpreted in terms of the specific interactions between water molecules and the particular solute. We have previously determined the effect of dissolved sodium halide salts on the liquid water XA spectrum, focusing primarily on the influence of the anion.9 These results conclusively demonstrated that interactions between the halide anions and the solvation shell water molecules precipitate changes in the XA spectrum of liquid water. Here, the role of cations in altering the electronic structure of liquid water is explicitly considered by the comparison of experimental and calculated spectra of pure water and HCl(aq) and NaCl(aq) solutions. Our results indicate that the differences between the observed XA spectra of aqueous HCl and NaCl solutions results primarily from a balance between the spectral effects of direct electrostatic perturbation of water molecules by the Cl- ion and the unique spectrum of H3O+ (and H5O2+) compared to H2O. 2. Experimental Section The experiment has been described in detail.13,14 Briefly, the total electron yield (TEY) soft XA spectra from pure water and aqueous NaCl and HCl solutions were measured on Beamline 11.0.2 at the Advanced Light Source, Lawrence Berkeley National Laboratory. The TEY was measured by collecting the electrons produced from interaction of the X-rays with the liquid
10.1021/jp0534582 CCC: $33.50 © 2006 American Chemical Society Published on Web 12/24/2005
Electronic Stucture of Hydrated Proton
J. Phys. Chem. B, Vol. 110, No. 3, 2006 1167
sample on a copper electrode biased at +90 V. XA spectra of liquid water and aqueous solutions measured via TEY provide a probe of the bulk electronic structure.15 All comparisons between experimental spectra were made using spectra obtained under constant experimental conditions. Under these conditions, the experimental spectra are highly reproducible. Liquid microjets are used to introduce the liquid sample (Tliq ≈ 285 K) into the high vacuum environment, thereby allowing for detection of the electrons and for rapid renewal of the liquid sample on a millisecond time scale. XA spectra were collected from 531560 eV at a step size of 0.1 eV, with a resolution of E/∆E ≈ 5000. The aqueous solutions used had nominal concentrations of 2 and 4 M for HCl(aq) and 4 M for NaCl(aq). All spectra were normalized to the incident X-ray flux, as measured on goldcoated slits located ∼0.5 m from the interaction region. 3. Computational Section The calculated XA spectra were generated using the StoBeDeMon 2.0 program16 to calculate oscillator strengths of specific oxygen K edge transitions. The oscillator strengths and energies were calculated from density functional theory (DFT) using a linear combination of Gaussian-type orbitals (LCAO) approach. The RPBE gradient-corrected exchange functional and the PBE correlation functional were used as provided.17 Calculations of XA spectra and core-level ionization potentials were performed using the transition potential method under the half core hole approximation.18,19 For all molecules besides the molecule of interest, an effective core potential20 was used to simplify the definition of the core hole and allow determination of the XA spectrum of the central molecule. For the XA spectra, the calculated energies were shifted to lower energy by 1.7 eV for comparison with experiment. This value was chosen in order to align the first calculated transition for the H2O molecule with the first experimental gas-phase feature (534.1 eV). It is not possible to calculate transition widths a priori, and therefore, a broadening scheme, based on previous experience, was chosen for presentation of the spectra and for comparison with experiment.9 For the calculated spectra of H3O+, H5O2+, H9O4+, and H2O, a constant broadening of 0.8 eV was used. For the larger molecular clusters (g17 molecules), a fwhm of 0.6 eV is used below 538 eV (unshifted energy), and a fwhm of 3 eV is used above 540 eV (unshifted). The fwhm is linearly varied from 0.6 to 3 eV from 538 to 540 eV. 4. Results The TEY-XA spectra of pure liquid water, 2 and 4 m HCl(aq), and 4 m NaCl(aq) have been measured (Figure 1). All spectra have been area-normalized over the range 531-560 eV, and energy calibration is obtained by comparison to the gas-phase water XA spectrum. The XA spectrum of 4 m NaCl(aq) is identical to that previously measured on Beamline 8.0.1 at the ALS by our group,9 and similar to the recently reported X-ray absorption spectrum of a 4 m aqueous KCl solution measured by the total fluorescence yield (TFY).21 The addition of NaCl to liquid water engenders a strong increase in spectral intensity at the pre-edge (535 eV) and main-edge (∼537 eV) regions, and a decrease at the postedge (∼541 eV). In contrast, the addition of HCl to liquid water leads to a decrease in intensity in the pre-edge, an increase in the postedge, and has only a minor effect on the main-edge, consistent with measurements of TFY-XA spectra of aqueous HCl solutions.22 Comparison of the observed TEY-XA spectra of pure water, 2 m HCl(aq), and 4 m HCl(aq) demonstrates that the spectral intensity in the pre-edge, main-edge, and postedge regions vary linearly with
Figure 1. (a) TEY-XA spectra of pure liquid water (dotted line), 4 m HCl(aq) (black line) and 4 m NaCl(aq) (gray line). (b) TEY-XA spectra of pure liquid water (dotted line), 4 m HCl(aq) (black line) and 2 m HCl(aq) (gray line).
the HCl concentration up to 4 m concentrations. Linear variation of spectral intensity with addition of salt was previously observed for the aqueous sodium halide systems9 and is consistent with a lack of variation with concentration in the observed binding energies of dissolved ions, even up to 12 m concentrations.23,24 5. Discussion The interpretation of the observed changes in the oxygen K edge XA spectrum of water upon addition of HCl and NaCl is guided by calculations of the XA spectra. We have previously demonstrated that much of the effect of NaCl on the oxygen K edge XA spectrum is driven by direct electrostatic perturbation of the electronic structure of water molecules that lie adjacent to the Cl- ion, and only secondarily by geometric rearrangement of the liquid water structure (e.g., via distortion or “breaking” of hydrogen bonds).9 The observed perturbation is large, because each Cl- ion will directly affect the electronic structure of approximately six water molecules,7 and because the interaction between anions and solvation-shell water molecules occurs primarily through the donor hydrogen bonds. Further experimental studies of the effect of monovalent vs divalent cations on the liquid water XA spectrum indicate that the spectral perturbation due to monovalent cation addition (such as Na+) is small.25 However, for H3O+ the situation is more complicated because the solvated H3O+ ion has a unique spectrum which is fundamentally different from that of H2O and relatively independent of the extent of hydrogen bonding, as we will demonstrate below. 5.1. The Electronic Structure of Solvated Protons. For simplicity, we begin by considering calculated XA spectra of unhydrated H2O and H3O+ molecules, as well as the complexes H5O2+ and H9O4+ (Figure 2). The spectra of H2O and H3O+ will undoubtedly change upon solvation; however, consideration of the bare molecules provides a first estimate of the spectral differences between these species. It is evident that the main
1168 J. Phys. Chem. B, Vol. 110, No. 3, 2006
Cappa et al.
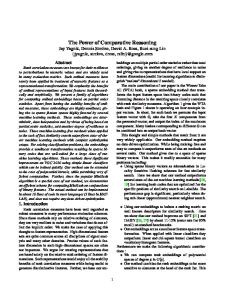
Figure 3. Representative larger clusters used in calculation of “solvated” XA spectra taken from the MD snapshot. The XA spectrum was calculated for the lighter gray molecule. (a) H3O+ calculation. (b) H3O+ near-neighbor H2O calculation.
Figure 2. Calculated spectra of H3O+, H5O2+, H9O4+, and H2O (black lines, from bottom to top) and the associated stick spectra. The experimental XA spectra of liquid water (gray) and 4 m HCl(aq) (dotted) are shown for comparison.
spectral features of the bare H3O+ ion (and its complexes) are blue-shifted from those of the H2O molecule, by ∼5 eV. Accordingly, H3O+ has essentially zero spectral intensity in the pre-edge region, with most of the spectral intensity of H3O+ located near the postedge region. Although based on calculations for the unhydrated species, this suggests that the loss of spectral intensity at the pre-edge and at the beginning of the main-edge, and the gain at the postedge upon addition of HCl to liquid water, is predominately due to the formation of H3O+ (and its complexes) and is not necessarily indicative of the formation of more strong hydrogen bonds by water molecules in the acid solution compared to pure water. The above XA spectra were calculated using either unhydrated H2O and H3O+ molecules or small, unhydrated H3O+/ H2O complexes. To assess the effect of hydration and hydrogen bonding, XA spectra have also been calculated for larger H3O+/ H2O clusters taken from a molecular dynamics (MD) simulation “snapshot” of HCl in H2O.26 Note that in the MD simulation a classical force field for the H3O+ molecules, modified to account for proton hopping in a stochastic way, was used. This model does not allow for formation of the Zundel form, and therefore, the XA calculations of these larger clusters focus specifically on the effect of Eigen-like complexes. Two sets of calculations were performed using molecule configurations taken from the HCl/H2O MD simulation: In the first, spectra of hydrated H3O+ molecules were calculated, and in the second, spectra of H3O+ near-neighbor water molecules were calculated. To consider the effect of the cation specifically, only those configurations
containing one cation and no anions were used in calculating the average XA spectrum. In all cases, a central H3O+ or H2O molecule was selected along with the 16 near-neighbor molecules, as determined by the ROO distance. The positions of the atoms in these 17 molecule clusters were used as input for the XA calculation. Representative H3O+/H2O clusters are shown in Figure 3. The average of 16 H3O+ XA spectra and 37 nearneighbor H2O spectra have been determined (Figure 4). The average spectrum of “solvated” H3O+ is blue-shifted relative to the average “solvated” H2O spectrum, similar to the above calculations on unsolvated H2O and H3O+. Comparison between the calculated unsolvated and solvated H3O+ spectra (at a constant broadening) demonstrates that the effect of solvation is to broaden the H3O+ spectrum somewhat (because of the variety of local bonding environments), but the overall spectral shape is not significantly affected (Figure 4). The relative insensitivity of the H3O+ XA spectrum to solvation environment can be contrasted with the strong changes observed upon solvation of H3O+ in the infrared Ar predissociation spectra of small protonated water clusters.27 These calculations support the above conclusion, derived from the unsolvated spectra, that the observed spectral variation upon HCl addition primarily arises from H3O+ having a fundamentally different spectrum than H2O. Distortions of the water hydrogen bonding network due to the presence of the dissolved H3O+ may also make some small contribution to the observed spectral variations. The strong similarity of the HCl(aq) spectrum to that of pure water should therefore not be interpreted as an indication that the addition of HCl only minimally perturbs the electronic structure of water. Instead, the similarity results from cancellation between the spectral perturbations on water molecules induced by the presence of Cl- anions,9 which tends to increase the pre-edge and main-edge and decrease the postedge, and the overall blue shift of the H3O+ spectrum, which has the opposite effect. The XA spectrum of the bare H5O2+ complex, wherein the excess proton is equally shared by the two water molecules, is calculated to be at slightly lower energy than the bare H9O4+
Electronic Stucture of Hydrated Proton
Figure 4. The experimental pure liquid water XA spectrum (bottom trace) compared to the average calculated spectrum for “solvated” H3O+ molecules in 17 molecule water clusters (top trace) and H3O+ nearneighbor H2O molecules in water clusters (middle trace). The solid lines were calculated using the normal broadening scheme (see text) and the dotted lines using a constant fwhm of 0.8 eV. The dashed line in the top trace is the bare H3O+ spectrum calculated using the same broadening scheme for comparison. The shaded area indicates the 1σ variation between the calculated spectra.
complex, where a H3O+ core is surrounded by three water molecules (Figure 2). The excess proton in liquid water is thought to actually exist as a “fluxional defect”, without welldefined structures.1 We nonetheless suggest that the observed spectral changes can be interpreted as arising from complexes in which the proton is more localized (H9O4+) or less localized (H5O2+) on a specific water molecule, although we note the limitations in this interpretation as it is based on spectra calculated for two specific unsolvated complexes. However, these two structures should provide a reasonable estimate of the effect of localization of the excess proton. H5O2+-like complexes may be responsible for the increase in spectral intensity of the HCl(aq) spectrum compared to the NaCl(aq) spectrum in the near postedge region (∼540-541 eV). However, the increase in spectral intensity of HCl(aq) compared to both the pure water and NaCl(aq) spectra at higher energies (∼541544 eV) may indicate that both H9O4+ and H5O2+ complexes absorb strongly in this region. The blue shift of the H3O+ XA spectrum compared to H2O can be understood by comparing the calculated 1s ionization potential (IP) of the two excited-state molecules. For the H2O molecule, the calculated IP is 540.7 eV, whereas for the unsolvated H3O+ ion, the calculated IP is 553.5 eV, a difference of 12.8 eV. (All calculated IPs are reported using their unshifted values, as opposed to the calculated spectra which have been shifted to lower energy to facilitate comparison with experiment.) Similarly, the threshold binding energy (i.e., the energy
J. Phys. Chem. B, Vol. 110, No. 3, 2006 1169 required to remove an electron from the highest occupied molecular orbital (HOMO)) of the ground-state molecule is larger for H3O+ (24.7 eV)28,29 than for H2O (12.6 eV)30,31 by 12.1 eV; it is as expected more difficult to remove an electron from H3O+ than from H2O. Solvation leads to a decrease of the IP of both the water molecule and the H3O+ ion. The calculated average IP for solvated water molecules (using the 17 molecule clusters) is 1.9 eV lower in energy (538.8 ( 0.7 eV) than for the bare molecule, the difference being in excellent agreement with experiment.32 Although DFT methods, such as that employed here, may not yield accurate values for corelevel ionization potentials, this result confirms that valid comparisons between IPs calculated at the same level of theory can be made. For the H3O+ ion, the associated solvation-induced red shift of the average calculated IP is much larger, changing by ∼10.5 eV to 543.0 ( 2.8 eV. This larger calculated shift of the H3O+ ion core-level IP is consistent in magnitude with experimentally determined solvation-induced shifts of core- and valence-level IPs of other monovalent cations.23,24,33 Thus, even after accounting for the effects of solvation, the core-level IP of H3O+ is ∼3.8 eV higher in energy than that for H2O. The spectroscopic difference between H5O2+ and H3O+ (or H9O4+) likely arises because the excess proton is less localized on a particular water molecule in the case of H5O2+, and therefore, this complex is spectroscopically more similar to H2O, although the calculated core-level IP of the unsolvated H5O2+ (548.9 eV) is still much higher than that of the H2O molecule. 5.2. Aqueous Solvation of H+ vs Na+. The average spectrum of H2O molecules in the first solvation shell of Na+ cations has also been calculated using 17 water molecule/1 Na+ clusters. The atom positions for each cluster considered were obtained from a MD simulation of 1.2 M NaCl in water at 300 K, where polarization of both the solvent and the solvated ions are explicitly included.34 As with H3O+, only configurations containing one cation and no anions were considered in order to simplify the interpretation of the calculated spectra. Additionally, XA spectra of the central water molecule in 17 molecule pure water clusters, taken from an MD simulation of pure water,34 and in 17 water molecule/1 Cl- clusters, taken from the 1.2 M NaCl simulation, were calculated. To focus specifically on the direct electrostatic perturbation induced by the cations on the unoccupied water orbitals, we compare, as an example, the average spectrum for only those cation near-neighbor water molecules that make two donor hydrogen bonds (i.e., “double donor” molecules). For the water/ anion clusters, we consider only water molecules that make one donor hydrogen bond, because the second “hydrogen bond” is already made with the Cl- anion. Geometric distortion of donor hydrogen bonds can engender changes in the calculated XA spectra;10,35,36 however within a given class of hydrogen bonding types (e.g., double donors), the calculated spectra are generally similar. Therefore, each water molecule considered in these calculations exists in a similar state with respect to the formation of donor hydrogen bonds, which allows us to ignore, to first order, differences in the hydrogen bonding environment between the first solvation shell and the bulk liquid that might be induced by the different ions (i.e., structure “making” and structure “breaking”). We note that whether a water molecule is considered as forming a hydrogen bond or not is only meaningful in terms of the particular criteria used to define a hydrogen bond.37 However, comparisons made using consistent criteria can still provide information on the relative hydrogen bonding nature of molecules. Here, we have used the hydrogen bond criteria of Wernet et al. (2004).36
1170 J. Phys. Chem. B, Vol. 110, No. 3, 2006
Figure 5. The average calculated XA spectrum for pure water and for Na+ and H3O+ near-neighbor H2O molecules. Only those molecules that make two donor hydrogen bonds to other water molecules have been considered. Shown for comparison is the calculated XA spectrum of Cl- near-neighbor water molecules that make one donor hydrogen bond with other water molecules. A total of 24 (H2O), 21 (H3O+), 11 (Na+), and 21 (Cl-) individual spectra were used in determining the average. The shaded area indicates the 1σ variation between the calculated spectra.
An important result from these calculations is that the average spectrum for double donor water molecules in the vicinity of H3O+ or Na+ ions are nearly identical to the average double donor bulk water spectrum (Figure 5). This indicates that the direct electrostatic perturbation of the unoccupied orbitals of water molecules around both of these (monovalent) cations is small. In contrast, the calculated average spectrum for single donor water molecules in the first solvation shell of Cl- is very different, exhibiting a strong increase in intensity in the mainedge region, consistent with our previous results.9 Despite the small calculated spectroscopic perturbation induced by the cations, the calculated average core-level IP is somewhat larger for water molecules adjacent to the monovalent cations (542.0 ( 0.4 eV and 541.7 ( 0.7 eV for H3O+ and Na+, respectively) than for pure water (538.8 ( 0.7 eV). For water molecules adjacent to Cl-, the calculated average core-level IP (535.7 ( 0.7 eV) is lower than that for pure water, demonstrating the differences in the perturbations induced by dissolved halide anions and monovalent cations. Thus, although both cations and anions affect the core-level IPs of near-neighbor water molecules, only anions engender significant spectral changes due to direct electronic distortion. This conclusion is in direct contrast to that of Na¨slund et al. who concluded from measurements of XA spectra of aqueous NaCl, KCl, and AlCl3 solutions that dissolved Cl- has no influence on the XA spectrum of liquid water.21 We believe this difference arises because, in their analysis, Na¨slund et al. neglected entirely the role of direct perturbation of the liquid water electronic structure by the dissolved ions, focusing their interpretation instead entirely on geometric distortion of the hydrogen bond network. We posit
Cappa et al. that the observed spectral differences between aqueous NaCl and AlCl3 solutions reflect a combination of differences in geometric distortion, as already noted by Na¨slund et al., and perhaps more importantly of differences in the direct interactions of dissolved Na+ ions and (highly charged) Al3+ ions with the solvating water molecules. Although geometric distortion will undoubtedly play a role, the observed spectral perturbations will be determined by a combination of effects. The small direct electronic perturbation of Na+ cations on the XA water spectrum can be understood by recognizing that anions interact with water molecules on the hydrogen (donor) side of the molecule, whereas cations interact through the lone pairs (acceptor side)si.e., water molecules donate “hydrogen bonds” to anions and accept “hydrogen bonds” from cations.7 This is consistent with the idea that, for pure water, the XA spectrum is particularly sensitive to geometric distortions of donor hydrogen bonds, while geometric distortions on the acceptor side affect the XA spectrum to a much smaller extent.35 However, unlike for pure water, changes in the liquid water XA spectrum due to the presence of dissolved ions are not necessarily solely the result of geometric distortion of the hydrogen bond network. Recent ab initio MD simulations of Na+ in water indicate that the formation of donor hydrogen bonds by Na+ nearneighbor water molecules is not significantly disrupted by the presence of the cation, whereas the number of acceptor bonds rises slowly as the distance from the cation increases, attaining the bulk value at the first minimum in the Na-O radial distribution function.8 If the nature of the donor hydrogen bonds is not significantly affected by dissolved Na+ ions, as indicated by these ab initio MD results,8 and also the direct electronic perturbation by Na+ ions is small, as we have shown above, then the presence of Na+ ions in liquid water consequently has almost no effect on the observed XA spectrum. Therefore, the changes to the liquid water XA spectrum upon NaCl addition are determined principally by interactions between the Cl- ion and water molecules. This conclusion is consistent with other experimental work comparing the influence of numerous monovalent and divalent cation chlorides on the liquid water XAS.25 Finally, we specifically consider here the differences in the observed XA spectra of NaCl and HCl solutions. Upon NaCl addition, both the pre-edge and main-edge regions increase in intensity, and the postedge region decreases. Furthermore, the degree of “intensity modulation” between the pre-edge maximum and the minimum between the pre-edge and main-edge at 535.4 eV increases with added NaCl, indicating that the intensity increases more in the pre-edge than in the main-edge region. If the observed spectral changes are indeed primarily the result of perturbations due to Cl-, then the difference between the NaCl and HCl solution spectra are predominately due to the conversion of some of the H2O molecules to H3O+ ions. In the HCl solution spectra, the degree of intensity modulation is only slightly different from that of pure water. This suggests that more intensity must be lost in the pre-edge region than the main-edge region upon H3O+ formation in order to negate the effect of Cl- to some extent. This is wholly consistent with the calculated spectrum for H3O+. Although intensity is lost in both the pre-edge and main-edge regions relative to H2O, the intensity loss is greater in the pre-edge region; thus, the preedge intensity decreases to a greater extent than the main-edge intensity and tends to counteract the effect of Cl- on the intensity modulation.
Electronic Stucture of Hydrated Proton Ideally, we could distinguish between the different contributions to the observed aqueous solution XA spectrum (e.g., direct electrostatic effects, geometric distortion, formation of new species with a unique spectrum such as H3O+). However, all of these perturbations tend to affect the XA spectrum in a generally similar mannersengendering changes in intensity in the pre-edge, main-edge, and postedge regionssthereby limiting our ability to quantitatiVely separate the effects. Further studies that compare the influence of different cations on the liquid water XA spectrum will help to distinguish between the different spectral perturbations, in particular, with respect to the role of geometric distortion. 6. Conclusions The oxygen K edge XA spectrum of aqueous HCl solutions have been measured and compared to pure water and aqueous NaCl solution spectra. The observed spectral changes upon HCl addition are different from those upon NaCl addition, because the hydrated proton forms covalent bonds with the nascent water molecules, whereas Na+ does not. The H3O+ ion, considered either as a free or solvated ion, has a XA spectrum that is strongly blue-shifted from the H2O spectrum. As such, the changes in the observed liquid water XA spectrum upon addition of HCl are small because of opposing effects of Cl- and H3O+ on the spectrum. The blue shift of the H3O+ spectrum is the result of the core-level IP of H3O+ being higher than that of H2O. Additionally, comparison of calculated average XA spectra of Na+ and H3O+ near-neighbor water molecules to bulk water indicates that direct electronic perturbation of the unoccupied orbitals of near-neighbor water molecules by monovalent cations is small, in strong contrast to the effects of monovalent anions.9 Acknowledgment. This research was supported by the Chemical Sciences, Geosciences and Biosciences Division, Office of Basic Energy Sciences, U.S. Department of Energy (R.J.S.) and by the National Science Foundation Atmospheric Chemistry Program under grant no. ATM-0138669 (R.C.C.). The Advanced Light Source is supported by the Director, Office of Science, Office of Basic Energy Sciences, Materials Sciences Division, of the U.S. Department of Energy under contract no. DE-AC03-76SF00098 at Lawrence Berkeley National Laboratory. C.D.C. was supported by the ALS Doctoral Fellowship in Residence and the National Defense Science and Engineering Graduate Fellowship. We thank the Advanced Light Source support staff, especially Kevin Wilson, Mary Gilles, Bruce Rude, Tolek Tyliszczak, Hendrik Bluhm, and David Shuh for their support. We also thank Doug Tobias (UC Irvine) for providing us with the pure water and NaCl MD snapshots and Pavel Jungwirth (Academy of Sciences of the Czech Republic) for the HCl MD snapshots. References and Notes (1) Marx, D.; Tuckerman, M. E.; Hutter, J.; Parrinello, M. Nature (London) 1999, 397, 601. (2) Eigen, M. Angew. Chem., Int. Ed. 1964, 3, 1. (3) Wicke, E.; Eigen, M.; Ackermann, T. Z. Phys. Chem. 1954, 1, 340. (4) Botti, A.; Bruni, F.; Imberti, S.; Ricci, M. A.; Soper, A. K. J. Mol. Liq. 2005, 117, 77. (5) Zundel, G. In The Hydrogen BondsRecent DeVelopments in Theory and Experiments. II. Structure and Spectroscopy; Schuster, P., Zundel, G., Sandorfy, C., Eds.; North-Holland: Amsterdam, 1976; p 683.
J. Phys. Chem. B, Vol. 110, No. 3, 2006 1171 (6) Zundel, G.; Metzger, H. Z. Phys. Chem. Neue Fol. 1968, 58, 225. (7) Ohtaki, H.; Radnai, T. Chem. ReV. 1993, 93, 1157. (8) White, J. A.; Schwegler, E.; Galli, G.; Gygi, F. J. Chem. Phys. 2000, 113, 4668. (9) Cappa, C. D.; Smith, J. D.; Wilson, K. R.; Messer, B. M.; Gilles, M. K.; Cohen, R. C.; Saykally, R. J. J. Phys. Chem. B 2005, 109, 7046. (10) Myneni, S.; Luo, Y.; Naslund, L. A.; Cavalleri, M.; Ojamae, L.; Ogasawara, H.; Pelmenschikov, A.; Wernet, P.; Vaterlein, P.; Heske, C.; Hussain, Z.; Pettersson, L. G. M.; Nilsson, A. J. Phys.: Condens. Matter 2002, 14, L213. (11) Na¨slund, L. A.; Cavalleri, M.; Ogasawara, H.; Nilsson, A.; Pettersson, L. G. M.; Wernet, P.; Edwards, D. C.; Sandstrom, M.; Myneni, S. J. Phys. Chem. A 2003, 107, 6869. (12) Smith, J. D.; Cappa, C. D.; Wilson, K. R.; Messer, B. M.; Cohen, R. C.; Saykally, R. J. Science 2004, 306, 851. (13) Wilson, K. R.; Rude, B. S.; Catalano, T.; Schaller, R. D.; Tobin, J. G.; Co, D. T.; Saykally, R. J. J. Phys. Chem. B 2001, 105, 3346. (14) Wilson, K. R.; Rude, B. S.; Smith, J.; Cappa, C.; Co, D. T.; Schaller, R. D.; Larsson, M.; Catalano, T.; Saykally, R. J. ReV. Sci. Instrum. 2004, 75, 725. (15) Smith, J. D.; Cappa, C. D.; Messer, B. M.; Cohen, R. C.; Saykally, R. J. Science 2005, 308. (16) Hermann, K.; Pettersson, L. G. M.; Casida, M. E.; Daul, C.; Goursot, A.; Koester, A.; Proynov, E.; St-Amant, A.; Salahub, D. R.; Carravetta, V.; Duarte, H.; Godbout, N.; Guan, J.; Jamorski, C.; Leboeuf, M.; Malkin, V.; Malkina, O.; Nyberg, M.; Pedocchi, L.; Sim, F.; Triguero, L.; Vela, A. StoBe Software v.2.0, 2004; available at http://w3.rzberlin.mpg.de/∼hermann/StoBe/. (17) For all oxygen atoms, the A2 (4, 3; 4, 3) auxiliary basis set, and for all hydrogen atoms, the A1 (3, 1; 3, 1) auxiliary basis set and the DZVP2 (41/1*) orbital basis set were used. For the central oxygen, the IGLO III orbital basis set was used, while for all other oxygen atoms, the effective core potential (311/211/1) orbital basis set and (3, 1; 10, 0) model core potential were used. For chlorine and sodium atoms, the effective core potential (3, 4; 3, 4) and (5, 2; 5, 2) auxiliary basis sets and (41/31/1) and (311/211/1) orbital basis sets were used, respectively. (18) Triguero, L.; Pettersson, L. G. M.; Agren, H. Phys. ReV. B 1998, 58, 8097. (19) Sto¨hr, J. NEXAFS spectroscopy; Springer-Verlag: Berlin, 1992. (20) Pettersson, L. G. M.; Wahlgren, U.; Gropen, O. J. Chem. Phys. 1987, 86, 2176. (21) Na¨slund, L. A.; Edwards, D. C.; Wernet, P.; Bergmann, U.; Ogasawara, H.; Pettersson, L. G. M.; Myneni, S.; Nilsson, A. J. Phys. Chem. A 2005, 109, 5995. (22) Cavalleri, M. Local Structure of Hydrogen-Bonded Liquids. Ph.D. Thesis, Stockholm University, 2004. (23) Weber, R.; Winter, B.; Schmidt, P. M.; Widdra, W.; Hertel, I. V.; Dittmar, M.; Faubel, M. J. Phys. Chem. B 2004, 108, 4729. (24) Winter, B.; Weber, R.; Hertel, I. V.; Faubel, M.; Jungwirth, P.; Brown, E. C.; Bradforth, S. E. J. Am. Chem. Soc. 2005, 127, 7203. (25) Cappa, C. D.; Smith, J. D.; Messer, B. M.; Cohen, R. C.; Saykally, R. J. J. Phys. Chem. B 2006, in press. (26) Mucha, M.; Frigato, T.; Levering, L. M.; Allen, H. C.; Tobias, D. J.; Dang, L. X.; Jungwirth, P. J. Phys. Chem. B 2005, 109, 7617. (27) Headrick, J. M.; Diken, E. G.; Walters, R. S.; Hammer, N. I.; Christie, R. A.; Cui, J.; Myshakin, E. M.; Duncan, M. A.; Johnson, M. A.; Jordan, K. D. Science 2005, 308, 1765. (28) Bahati, E. M.; Jureta, J. J.; Cherkani-Hassani, H.; Defrance, P. J. Phys. B 2001, 34, L333. (29) Irikura, K. K.; Kim, Y. K.; Ali, M. A. J. Res. Natl. Inst. Stand. (U.S.) 2002, 107, 63. (30) Hwang, W.; Kim, Y. K.; Rudd, M. E. J. Chem. Phys. 1996, 104, 2956. (31) Tonkyn, R. G.; Wiedmann, R.; Grant, E. R.; White, M. G. J. Chem. Phys. 1991, 95, 7033. (32) Lundholm, M.; Siegbahn, H.; Holmberg, S.; Arbman, M. J. Electron Spectrosc. 1986, 40, 163. (33) Siegbahn, H.; Lundholm, M.; Holmberg, S.; Arbman, M. Phys. Scr. 1983, 27, 431. (34) Jungwirth, P.; Tobias, D. J. J. Phys. Chem. B 2002, 106, 6361. (35) Cavalleri, M.; Ogasawara, H.; Pettersson, L. G. M.; Nilsson, A. Chem. Phys. Lett. 2002, 364, 363. (36) Wernet, P.; Nordlund, D.; Bergmann, U.; Cavalleri, M.; Odelius, M.; Ogasawara, H.; Naslund, L. A.; Hirsch, T. K.; Ojamae, L.; Glatzel, P.; Pettersson, L. G. M.; Nilsson, A. Science 2004, 304, 995. (37) Smith, J. D.; Cappa, C. D.; Wilson, K. R.; Cohen, R. C.; Geissler, P. L.; Saykally, R. J. PNAS, 10.1073/pnas.0506899102.