The Credit Channel of Fiscal Policy Transmission∗ Andrew Bird, Stephen A. Karolyi, Stefan Lewellen, Thomas Ruchti March 16, 2018
Abstract We propose and test a new channel through which fiscal policy changes can affect the supply of intermediated credit and the real economy. Banks that have greater exposure to firms expected to repatriate a significant amount of foreign income as a result of a 2004-2005 U.S. tax holiday subsequently increase lending to other, purely domestic firms during the period of the tax holiday, leading to higher investment at these firms. Our results complement the existing literature on the credit channel of monetary policy transmission and highlight an important indirect spillover effect of fiscal policy changes on credit-constrained firms.
∗
Tepper School of Business, Carnegie Mellon University. 5000 Forbes Avenue, Pittsburgh, PA 15213, USA. Emails:
[email protected],
[email protected],
[email protected],
[email protected].
1
Introduction
How do fiscal policy changes affect the real economy? A large literature has studied numerous channels through which government spending and taxation policies affect economic outcomes.1 However, the vast majority of these studies focus on either aggregate outcomes or on direct linkages between fiscal policies and the agents most affected by such policies. In this paper, we propose and test a new channel for how fiscal policy changes can affect the real economy. Our argument has three components. First, some firms in the economy directly benefit from a fiscal policy change–in our case, a repatriation tax holiday on foreign earnings. Second, firms enable some of these “windfall” benefits to be intermediated through the banking system. Third, banks redistribute these “windfall” gains (in part) by increasing the supply of credit to other firms in the economy that did not directly benefit from the fiscal policy change. Hence, we argue that financial intermediaries can help to amplify fiscal policy changes by spilling over these changes to other firms in the economy through increases in the supply of credit. We refer to this channel as the credit channel of fiscal policy transmission. The fiscal policy change that we consider in this paper is the 2004 American Jobs Creation Act (“AJCA”). The AJCA temporarily reduced the taxes owed by U.S. multinational firms on foreign income repatriated to the United States in 2004 and 2005. We focus on the AJCA because this fiscal policy change has several appealing empirical properties. First, the temporary tax holiday created under the AJCA was largely unexpected, and was hence plausibly unrelated to both firms’ and banks’ domestic investment opportunities. Second, 1
See, e.g., Blanchard and Leigh (2013), Cohen, Coval, and Malloy (2011), Duchin and Sosyura (2014), Ilzetzki, Mendoza, and Vegh (2013), Mertens and Ravn (2014), Nakamura and Steinsson (2014), RieraCrichton, Vegh, and Vuletin (2016), Romer and Romer (2010), and Serrato and Wingender (2016). Ramey (2011) provides a more comprehensive overview of this literature.
1
the temporary nature of the holiday created a large increase in the amount of repatriated foreign earnings, thereby allowing us to measure the effects of a large “windfall” on affected firms. Finally, since the AJCA only affected a subset of U.S. firms, we can isolate spillover effects on firms that were not directly affected by the AJCA. Our results suggest that fiscal policy changes can produce large spillover effects on the real economy through changes in the supply of credit. We find that banks with significant preAJCA lending exposures to firms with foreign earnings subsequently increase lending during the AJCA’s tax holiday period. The magnitude of this effect is large: lending increases by approximately 1%, or approximately $9 billion. Banks then use this “windfall” funding to expand lending across the board. In particular, in addition to lending more to existing clients that are affected by AJCA, banks also increase lending to other firms that were not directly affected by the AJCA, such as firms with only domestic operations. Loan terms also improve: loan amounts are greater, spreads are lower, maturity is longer, and loans are more likely to be unsecured, to have few covenants, and to include a revolving credit facility when they are originated by banks with significant exposure to AJCA-eligible borrowers. Finally, we find evidence that firms increase their investment after receiving additional credit. Hence, our results suggest the existence of a credit channel through which fiscal policy changes can affect the supply of credit to firms that are not directly affected by the policy change. The spillover effects we document are distinct from, but are related to, the credit channel of monetary policy transmission (Bernanke and Gertler, 1995). In the monetary policy version of the credit channel, interest rate changes can have two effects on the real economy. First, in both direct and indirect ways, a tightening of monetary policy (that is, an increase in interest rates) can weaken firms’ balance sheets, thereby affecting firms’ ability to finance 2
investment through internal cash flows and impacting their ability to borrow from lenders (the so-called “balance sheet channel”).2 Second, a tightening of monetary policy can reduce the supply of bank loans, particularly at small banks (the “bank lending channel”).3 Like the credit channel of monetary policy transmission, our proposed channel relates fiscal policy changes to both firms’ balance sheets and the supply of bank loans. However, our proposed channel differs from the monetary policy credit channel in two distinct ways. First, in our channel, changes in firms’ balance sheets are transmitted through the banking system to affect other firms’ balance sheets. Hence, the credit channel mechanism we document is different from the traditional credit channels of monetary policy transmission. Second, our proposed channel is purely cross-sectional in nature – a policy change affecting some firms spills over through the banking sector to affect other firms. In contrast, changes in monetary policy affect all firms (and banks) in the economy, though heterogeneity exists in the strength of these effects. To estimate the credit channel of fiscal policy transmission, we begin by calculating a pre-AJCA measure of lenders’ exposure to firms with foreign earnings (net of foreign taxes paid) using data from Dealscan and Compustat. We refer to this time-invariant, lender-level measure as Exposure. Using syndicated loan data from Dealscan, we then examine whether loan origination volumes during the AJCA tax holiday period are larger at lenders with high levels of Exposure. Consistent with the hypothesis that “windfall” benefits from the tax holiday were intermediated (in part) through the banking system, we find that lenders with high values of Exposure increase credit supply following the passage of the AJCA. 2
See, e.g., Gertler and Gilchrist (1993, 1994) and Bernanke, Gertler, and Gilchrist (1996). See, e.g., Bernanke and Blinder (1988), Kashyap and Stein (2000), Khwaja and Mian (2008), and Williams (2018). 3
3
The spike in credit supply coincides exactly with the beginning of the tax holiday period and ends immediately after the temporary holiday expires. Parallel trends tests confirm that there are no material differences in lending volumes between high- and low-Exposure lenders prior to the beginning of the AJCA tax holiday in 2004. Loan-level tests also indicate that firms borrowing from high-Exposure banks receive more favorable loan terms during the tax holiday. In addition, consistent with our proposed intermediation channel, we find that high-Exposure commercial banks account for the entirety of the increase in post-AJCA lending. In contrast, lending during the tax holiday actually drops at high-Exposure nonbank institutions (such as insurance companies) relative to similar low-Exposure institutions. These results are robust across five different definitions of Exposure and across a variety of specifications with differing fixed effects. Our next set of tests attempts to identify which borrowers benefit from the increase in credit supply at high-Exposure lenders. We construct a borrower-lender-time panel that allows us to include borrower × time and borrower × lender fixed effects in our empirical specifications. These fixed effects help us to separate changes in credit supply from changes in credit demand, and to account for any preferential lender treatment awarded to certain borrowers. We then separate our sample along three dimensions. First, and most importantly, we split our sample into borrowers with foreign earnings (who might expect to benefit from the AJCA) and purely domestic borrowers with no foreign earnings. This latter group of borrowers should not be directly affected by the AJCA, and hence, did not directly benefit from its passage. However, consistent with the existence of a credit channel of fiscal policy transmission, we find that high-Exposure banks increased lending to even purely domestic borrowers. Furthermore, domestic borrowers obtained more credit from high-Exposure 4
lenders than firms with foreign earnings during the AJCA tax holiday. Hence, we find evidence that fiscal policy changes (in this case the AJCA) can be transmitted through the financial system to affect firms that were not directly affected by the policy change itself. Our evidence also suggests that lenders expanded credit access to marginal, creditconstrained borrowers that might not have received credit in the absence of the AJCA tax holiday. First, firms with purely domestic operations are likely to be smaller and more credit-constrained than the large, multinational firms that benefited from the passage of the AJCA. As such, our results on domestic firms are supportive of the idea that credit supply increased for marginal borrowers with weaker pre-AJCA access to credit markets. To supplement these tests, we also examine differences in post-AJCA credit access across public and private firms. Private firms tend to be smaller than public firms and arguably do not possess the same level of access to capital markets. Hence, private firms are likely more subject to financial constraints than public firms. Following the passage of AJCA, we find that high-Exposure banks expanded lending to private firms relative to low-Exposure banks. Furthermore, private firms also obtained larger amounts of credit from high-Exposure banks relative to public firms during the tax holiday. Collectively, these results provide strong support for the hypothesis that the AJCA allowed high-Exposure banks to expand credit supply in a manner that benefited marginal, credit-constrained borrowers. Finally, we estimate the effects of increased credit supply on borrowers’ subsequent investment. Since borrowers’ investment opportunities (and hence, their demand for credit) are endogenous, we instrument for credit supply using a borrower’s exposure to high-Exposure lenders. Intuitively, a borrower’s exposure to high-Exposure lenders might affect the borrower’s post-AJCA access to credit, but this measure should be unrelated to the borrower’s 5
post-AJCA investment opportunities or credit demand. We find strong evidence that the credit channel of fiscal policy transmission has real economic effects: borrowers with higher instrumented access to credit during the AJCA tax holiday subsequently increase their capital expenditures, R&D spending, and spending on acquisitions. The magnitudes of these effects are also large: for every dollar of additional lending to domestic firms, these firms increase their investment by $0.14. In addition, consistent with our other evidence on fiscal policy spillovers through financial intermediaries, we find that even purely domestic borrowers with higher instrumented access to credit increase their investment. Hence, the credit channel of fiscal policy transmission appears to be associated with economically-significant real effects. Our study contributes to at least four areas of the literature. First, we contribute to the literature on the real effects of fiscal policy changes (see Ramey (2011) for an overview of this literature). In particular, our paper joins a number of other papers that have focused on the outcomes of the AJCA (see, e.g., Blouin and Krull (2009), Dharmapala, Foley, and Forbes (2011), Faulkender and Peterson (2012), and Dyreng and Hills (2017).4 However, all of these studies look at effects of the holiday on the exposed firms themselves, such as how the repatriated funds were used. We instead study how the effects spill over from the directly affected firms through financial intermediaries to the rest of the corporate sector. Second, our results contribute to the literature on bank lending. Unlike the existing literature, which has primarily focused on adverse shocks to bank funding to explore the effects of bank financial health on lending outcomes (see, e.g., Khwaja and Mian (2008)), 4
Other studies of the effects of the AJCA include Albring, Mills, and Newberry (2011), Brennan (2014), Graham, Hanlon, and Shevlin (2010), Morrow and Ricketts (2014), and Oler, Shevlin, and Wilson (2007).
6
we exploit a unique situation in which a “windfall” gain by some bank customers results in additional lending to other, non-affected borrowers.5 Third, our results suggest that “credit channels” can extend beyond the realm of monetary policy transmission. While existing studies of fiscal stimulus policies such as TARP have also focused on bank lending (see, e.g., Duchin and Sosyura (2014)), both the nature of the stimulus we study and the mechanism through which the stimulus passes through the banking sector differentiate our paper from the existing literature. Finally, our paper relates to the literature on tax policy decisions and how such policies affect business outcomes. We document a spillover of tax law changes through the financial system that affect the real economy, which we believe is new.
2
Data and Summary Statistics
2.1
Corporate loan data
We obtain detailed data on syndicated corporate loans from Loan Pricing Corporation’s Dealscan database. Our primary sample period spans Q3 2003 to Q2 2005, which represents the period from one year before the passage of the AJCA to one year after the AJCA’s passage. We exclude loan facilities with unidentified lenders, so, for a given loan in our sample, we have data on the identities of the borrower and lender(s) as well as loan terms such as spread, maturity, and covenants, and information on the type and purpose of the loan. Our final sample includes 22,574 loan facilities (14,375 loan packages) covering 4,646 5
Agarwal et al. (2018) also examine how borrowers benefit from credit expansions. However, the focus of their paper (credit card borrowers) differs significantly from our focus, and they do not examine lending spillovers from one set of borrowers to another set of borrowers.
7
borrowers and 1,336 financial institutions. Financial institutions with at least one bank subsidiary comprise 701 of these lenders. Of these borrowers, 54.9% are public firms, and, for the subset that are public, we identify 71.2% of them as domestic-only or multinational based on their exposure to the repatriation tax holiday. We access data on the money terms (i.e., spread, amount, maturity, and collateral) and covenant package for these loans and we construct indicator variables to identify loans by their type (i.e., revolver, term loan, etc.) and purpose (i.e., capital expenditures, debt repayment, etc.).
2.2
Borrower accounting data
We obtain annual data on borrowers’ earnings, investment, R&D spending, acquisition spending, and other accounting variables from Compustat for the sample period 2003–2005. We map annual accounting data by fiscal year end to the Q3 2003–Q2 2004 pre-AJCA period and the Q3 2004–Q2 2005 post-AJCA period. Using this mapping, we construct a measure of potential repatriated earnings as the difference between the cumulative foreign earnings between Q3 2001 and Q2 2003 and cumulative foreign taxes paid during the same period, and we censor this measure (from below) at zero.
2.3
Summary statistics
Table 1 provides summary statistics for our main data samples. Panel A shows that while most of the borrowers in our sample are large, a significant amount of heterogeneity exists in terms of borrower size and loan size. The median borrower in our sample takes out a loan of $200 million, and has total annual investment (the sum of capital expenditures, R&D
8
spending, and acquisitions) of approximately $14 million. Panel B presents summary statistics for our sample of lenders. The median lender in our sample participates in 4 loans per year, but this distribution is highly skewed, as the average lender participates in 44 loans per year. Only a subset of these lenders are active lead arrangers in the syndicated loan market; the average lender leads 13 syndicates per year. The average lender supplies $1.6 billion in loan capital per year, but, consistent with the skewed distribution in loan participation, the median lender supplies $35 million per year. The median lender is not exposed to borrowers with potential repatriated earnings, but the mean exposure across lenders is $187 million. Panel C presents summary statistics for the loans that underlie the borrower- and lenderlevel statistics. These loans are representative of the Dealscan universe of syndicated loans. The median loan has a maturity of five years, a spread of 150 basis points over the base rate (i.e., Treasuries or LIBOR), and, conditional on having a covenant package, three covenants. The median loan facility is $125 million, or 62.5% of the median loan amount issued in a median borrower-year observation. This is consistent with borrowers issuing loan packages comprised of multiple loan facilities or issuing multiple loan packages in a given year.
3
Empirical Strategy and Identification
We are interested in determining whether firms’ exposure to the AJCA tax holiday led to increased credit availability, particularly for firms that were not directly affected by the AJCA. To examine this hypothesis, we begin by combining loan-level data from Dealscan with a measure, Exposure, that captures the strength of a lender’s relationship with borrowers
9
that are likely to benefit from passage of the AJCA. We then perform a number of tests to link our Exposure measure with the pre- and post-AJCA characteristics of borrowers and lenders. The sample period for our tests is Q3 2003 to Q2 2005. For each lending institution in Dealscan, we construct annual measures of the lender’s participation in syndicated loan originations (in any role) and use those measures as our outcome variables. To better align our tests with the exact timing of the AJCA legislation, we define Q3 2003 - Q2 2004 as the pre-AJCA period and Q3 2004 - Q2 2005 as the post-AJCA period (the law passed Congress on July 15, 2004 and was signed by President Bush on October 22, 2004).6 Specifically, for an outcome variable Y , we aggregate lender l’s originations for the periods Q3 2003 - Q2 2004 (which corresponds to the 12 months prior to the passage of AJCA) and Q3 2004 - Q2 2005 (which corresponds to the 12 months following the passage of AJCA). We measure Exposure as of Q2 2004, just before the passage of the AJCA. This variable is then held constant for each lender across our sample period. We define Exposure as the cumulative foreign income net of foreign taxes paid across all of a lender’s borrowers for the three years prior to Q2 2004. For example, if Citibank had outstanding loans to three firms (A, B, and C) as of Q2 2004, Citibank’s Exposure would be calculated as the cumulative foreign income net of foreign taxes paid for firms A, B, and C in the three years prior to Q2 2004. Hence, if firm A possessed $1 billion in net foreign income, firm B possessed $100 million in net foreign income, and firm C possessed no foreign income, Citibank’s Exposure would be calculated as $1 billion + $100 million + $0 = $1.1 billion. Our definition of 6
Dharmapala, Foley, and Forbes (2011) and Faulkender and Peterson (2012) provide more details about the goals and legislative process associated with the AJCA.
10
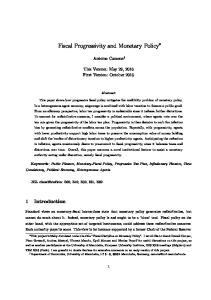
exposure is similar to the approach taken by Dharmapala, Foley, and Forbes (2011), who use a similar definition to instrument for whether firms repatriated income under the AJCA.7 The distribution of our Exposure measure is reported in Figure 1. The figure shows that significant variation exists across lenders in their pre-AJCA exposure to borrowers with foreign earnings. For robustness, we also examine alternative definitions of Exposure. First, for each lender, we scale our main Exposure variable by total borrower assets and total borrower revenue, respectively. These scaled measures should reduce variation in Exposure caused by differences in lender size.8 We also construct Exposure using different definitions of foreign income. In addition to our primary measure, we examine cumulative foreign earnings (ignoring foreign taxes paid) and cumulative net foreign income (where taxes are netted within rather than across years).
3.1
Lender-Year Panel
Our first set of tests examines whether lenders with high Exposure subsequently change their lending patterns in the immediate period following the passage of AJCA. Under the fiscal policy version of the credit channel, a lender with higher exposure to repatriating firms (i.e. high Exposure) should be able to supply more credit to borrowers following the passage of the AJCA. In particular, the credit channel postulates that credit availability 7
Faulkender and Peterson (2012) question the approach used by Dharmapala, Foley, and Forbes (2011). They advocate for comparing firms that actually did repatriate income under the AJCA versus firms that could have repatriated income, but chose not to. However, the decision to repatriate is endogenous, and if anything, our definition would lead us to arrive at less precise estimates than if we used the methodology in Faulkender and Peterson (2012) (with appropriate corrections for endogeneity). 8 Not surprisingly, our baseline Exposure measure – which is reported in dollars – is strongly correlated with lenders’ total origination volumes (which are a proxy for lender size). However, Figure 2 shows that significant variation in Exposure still exists even among lenders of similar size.
11
should improve not only for repatriating firms, but also for purely domestic firms that were not directly affected by the AJCA’s repatriation tax holiday. To explore these hypotheses, we construct a lender-year panel using data from Dealscan by aggregating various outcome variables across all of the loans originated by a lender (in any role) within a given year. We focus on three outcome variables: loan origination amounts, the number of new loan originations, and the number of borrowers in a lender’s portfolio that subsequently default on their loans. To examine the link between Exposure and post-AJCA lending outcomes, we employ a differences-in-differences specification of the form:
ln Ylt = α + βExposurel + δP ostt + φExposure × P ostlt + ΓF E + εlt ,
(1)
where Ylt represents an outcome (such as loan origination volume) for lender l at time t, Exposurel represents a lender’s pre-AJCA exposure to borrowers with foreign income, P ostt is a dummy variable taking the value of one following the passage of AJCA, F E represents a variety of fixed effects (discussed below), and εlt represents the error term. Our main variable of interest is the interaction term Exposure × P ost, which captures the differential change in outcomes following the passage of AJCA between lenders with larger or smaller pre-AJCA foreign income exposure. For example, a positive value of φ would indicate that lenders with larger pre-AJCA foreign income exposure subsequently increased lending volumes (or the number of new loans) following the passage of AJCA relative to other lenders with lower pre-AJCA exposures. Since we use annual data that does not correspond to calendar years, the variable P ost takes the value of zero for the “year” 2003 (Q3 2003 - Q2 2004) and one for the “year” 2004 (Q3 2004 - Q2 2005). 12
We employ a number of different fixed effects in our main tests. First, we include lender fixed effects to capture any lender-specific trends such as differences in origination volumes between small and large lenders. We also include lender-type fixed effects to capture timeinvariant differences in lending preferences across different types of lending institutions (for example, commercial banks versus insurance companies). Finally, we include time fixed effects to capture any common trends in loan origination across the different time periods in our sample. Since our primary specification includes both lender and time fixed effects, the Exposurel and P ostt variables are absorbed by our fixed effects. Hence, the actual specification that we estimate takes the form:
ln Ylst = α + φExposure × P ostlst + µl + µs + µt + εlst ,
(2)
where s represents lender type and µl , µs , and µt represent lender, lender type, and time fixed effects, respectively. As a robustness check, we also construct an interacted fixed effect Bank Size×Y ear that is used in some of our tests. Bank Size is measured as the log of a lender’s total origination volume in 2003 (the year before the AJCA was passed). The inclusion of this fixed effect helps to alleviate any remaining concerns that our Exposure variable is simply proxying for lender size. Our primary identifying assumption in these tests is that lenders did not set Exposure prior to the AJCA based on expectations that the AJCA would be introduced and would later become law. This assumption is similar to the main identifying assumption in other studies of the AJCA, which take the bill’s introduction (and subsequent passage) as an exogenous, 13
unexpected event. In our setting, given significant stickiness in lending relationships, we this assumption seems particularly innocuous. Consistent with our identifying assumption, parallel trends tests in Figures 3 and 4 show that there were no material differences in loan origination volumes or average borrower riskiness for high-Exposure and low-Exposure lenders prior to the passage of the AJCA in 2004.
3.2
Borrower-Lender-Year Panel
While the tests described above attempt to measure the effects of Exposure on post-AJCA lending outcomes, one might be concerned that differences in lending outcomes could be caused by changes in credit demand rather than changes in credit supply. To address this concern, we also construct a borrower-lender-year panel in which we recompute loan origination metrics for every borrower-lender pair that is active in a given year. This allows us to saturate our previous regression specification with both borrower × year and borrower × lender fixed effects. In particular, we estimate the regression:
ln Yblt = α + φExposure × P ostblt + µb × µt + µb × µl + εblt ,
(3)
where b represents borrowers, µb × µt represents a borrower × year fixed effect, and µb × µl represents a borrower × lender fixed effect. The inclusion of borrower × year fixed effects allows us to account for a given borrower’s time-varying demand for credit, ensuring that any effects we observe are caused by shifts in loan supply rather than loan demand (Khwaja and Mian, 2008). Identification in this setting comes from comparing changes in loan amounts (or other outcome variables) across 14
low- and high-Exposure banks making loans to the same borrower at the same point in time. Similarly, the inclusion of borrower × lender fixed effects accounts for any preferential (or deferential) treatment that a lender might give to certain borrowers. We also exploit heterogeneity in post-AJCA lending outcomes across different types of borrowers. First, we construct a dummy variable, Relationship, that takes the value of one if a lender lent money to a borrower at any time prior to Q2 2004. This variable captures whether a borrower-lender pair have an existing relationship prior to the passage of the AJCA. Second, we code a dummy variable called Domestic that takes the value of one if a borrower did not have any cumulative foreign earnings (net of foreign taxes paid) in the three years prior to Q2 2004. Finally, we construct a third dummy variable, P rivate, that takes the value of one if the borrower does not appear in the Compustat database. We then examine whether our regression estimates differ in the cross-section across borrowers in the three categories described above. Our tests take two forms. First, we re-estimate equation 3 after restricting our borrower-lender-year sample to only include borrower-lender pairs with prior relationships, borrowers that are domestic, and borrowers that are private, respectively. Second, we interact the Relationship, Domestic, and P rivate variables (respectively) with our main effect (Exposure × P ost) in a series of tripledifference specifications. Both sets of tests allow us to determine whether certain types of borrowers are more likely to receive additional credit from high-Exposure lenders following the passage of the AJCA. In particular, these tests allow us to ascertain whether purely domestic borrowers benefited from increased credit availability following the passage of the AJCA.
15
3.3
Lender-Loan Panel
We also hypothesize that high-Exposure lenders might supply credit to borrowers at more favorable terms following the passage of the AJCA. To test this hypothesis, we perform a differences-in-differences analysis on a series of loan terms including all-in-drawn credit spreads, loan maturities, collateral requirements, covenants, and fixed versus revolving credit agreements. For robustness, we also examine loan amounts to ensure that the results from our other specifications continue to hold at the level of an individual loan. The specification we estimate is:
Ylnprt = α + φExposure × P ostlt + µl + µp + µr + µt + εlnprt ,
(4)
where n represents a loan, p represents the purpose of the loan as indicated by the Loan Purpose field in Dealscan, r represents the loan type as indicated by the Loan Type field in Dealscan, µp represents a loan purpose fixed effect, and µr represents a loan type fixed effect. Similar to our lender-year panel, identification in this setting comes from variation in lenders’ Exposure prior to the passage of the AJCA.
3.4 3.4.1
Real Effects Compustat Sample
Next, we examine whether changes in the availability of credit following the passage of the AJCA are associated with changes in borrowers’ post-AJCA investment levels. Since investment is not observable for private firms, the sample for these tests is restricted to
16
borrowers with data in Compustat. We evaluate three measures of investment: capital expenditures, research and development expenses, and acquisitions. We also combine these variables to obtain a measure of total investment at the borrower-year level. We employ an instrumental variables approach to identify the effects of credit supply changes on borrowers’ post-AJCA investment. Since credit demand and credit supply are not determined at random, na¨ıve OLS regressions would potentially suffer from selection issues, omitted variables issues, and reverse causality problems. To address these concerns, we instrument for credit supply using the total level of Exposure across all of a borrower’s banks, which we refer to as T otalExposure. Intuitively, a high level of T otalExposure should be correlated with increased credit availability, but should be unrelated to the borrower’s investment opportunities or other factors affecting credit demand. We then run specifications of the form:
\ bt + µt + εbt , ln Investmentbt = α + β ln Amount
(5)
\ bt represents the instrumented level of credit availability. where ln Amount In addition, we examine cross-sectional heterogeneity in investment responses for domestic versus multinational firms. This test allows us to examine whether the fiscal credit channel allows purely domestic firms to increase their investment levels following the passage of the AJCA.
17
3.4.2
Dealscan Sample
In our last set of tests, we use the Loan Purpose field in Dealscan to provide additional evidence on how post-AJCA changes in credit availability affect real outcomes. In particular, we identify loans with a stated purpose of capital expenditures, acquisition (or takeover) financing, working capital investment, or debt repayment. For every borrower, we then aggregate the total volume of loans earmarked for each purpose. While these variables are not exact measures of firms’ total capital expenditures, acquisition expenses, working capital investments, or debt repayment, the use of the Loan Purpose variable allows us to include all borrowers (and not just Compustat borrowers) in our sample. This allows us to separately examine the real effects of credit supply shocks on public and private borrowers using the same instrumental variables procedure described above.
4 4.1
Results Fiscal policy and lender-level credit supply
We begin testing the credit channel of fiscal policy transmission by first estimating the extent of the effect of exposure to the AJCA tax holiday on loan amounts and the number of loans made by lenders during the holiday. In Table 2, we present fixed effect regression estimates of this exposure based on equation 1. In these tests (and all remaining tests), we measure exposure as the log of cumulative foreign income net of foreign taxes paid across all of a lender’s borrowers for the years 2001-2003 (i.e. we use ln Exposure rather than Exposure). Our explanatory variable is interacted with Post, an indicator variable taking the value of
18
one in the year following the tax holiday. In columns (1) and (2) of Table 2, we find that a 100% increase in exposure is associated with a 4.6 to 4.7% increase in the dollar volume of lending during the tax holiday. From Table 1, this relative increase in exposure is less than a standard deviation of exposure for both an average and a median lender within our sample. In column (1), we include lender and year fixed effects, controlling for any correlation across lenders in exposure and loan amounts, and year-over-year changes in average loan amounts, respectively. We further include lender type indicators9 in column (2), confirming that our effect is not driven by the types of lenders making loans. In columns (3) and (4), we find that a 100% increase in exposure is associated with a 1.2 to 1.3% increase in the number of loans made, depending on the inclusion of fixed effects. Overall, our findings indicate that lenders with more exposure to firms that can take advantage of the 2004-2005 tax holiday subsequently increase their lending volumes, both when measured by the dollar volume of loans, and by the number of loans made. In particular, our results suggest that not only are lenders with more exposure to the tax holiday making more loans, but the loans they are making are larger.10 In Table 3, we document the robustness of our results to different measures of exposure to the AJCA tax holiday. In Panel A, we investigate loan amounts, and in Panel B, we investigate the number of loans made. In column (1), we depart from our baseline measure of Exposure by measuring this variable as the log of cumulative foreign income of the lenders’ borrowers, without netting out taxes paid. Taxes paid is correlated with a firm’s tax strategy, so one would want to control for this endogeneity in any tests of the effects of exposure on 9
These variables equal to one if the lender has at least one subsidiary of the respective lender type of the set {Mutual fund, Institution, Insurance Company, Corporation, Trust, Bank }. 10 This is because the percentage increase in loan amounts is greater than the percentage increase in the number of loans.
19
lending outcomes. We find quantitatively similar effects in column (1) of both Panels A and B to the respective coefficients in columns (2) and (4) of Table 2, indicating that our results do not appear to be driven by measurement. In calculating tax exposure net of taxes paid, we take the cumulative income subtracting cumulative taxes paid over the three years 2001-2003. In column (2), we instead measure exposure by instead first netting by year, and then summing net foreign income over years, for each borrower of a given lender. We again find quantitatively similar coefficients. Our main specifications use the sum of a lender’s Exposure, but proportional exposure to the size of the lender may be important for lending decisions. To address this issue, in column (3) of Panels A and B, we instead measure exposure by dividing our measure by the assets of the firm. We find slightly larger coefficients using this measure, but calculated as a proportion of assets in this way introduces noise, so our standard errors go up as well. In column (4), we instead divide our baseline measure by sales of the borrower, and recover coefficients that are similar to that of our specifications in Table 1, columns (2) and (4), with similar significance. Finally, there may be trends in lending across lender size, so in column (5), we introduce lender size-by-year fixed effects into our baseline specification to allow loan growth to differ by the size of the bank from before to after the reform. In this specification, we find that a 100% increase in exposure for a lender leads to a 21.1% increase in the dollar volume of loans and a 3.7% increase in the number of loans, both of which are larger effects than we find without the inclusion of size-by-year fixed effects. Because these fixed effects control for bank size-related trends in lending, it appears that large banks face more exposure to the tax holiday, and that without this exposure, their change in lending from before to after would be relatively negative. 20
We are also interested in understanding which institutions are engaging in increased lending as a result of exposure to the tax holiday through their borrowers. In Table 4, we include in our sample all non-bank lenders as well. Here, we introduce a triple interaction for exposure and the post-tax holiday period. This third interaction term is Bank, which is an indicator that equals one if the lender has at least one subsidiary that is a bank, and zero otherwise. We find that lenders exposed to this shock with no banking subsidiaries actually reduce lending, both in dollar loan volume and in the number of loans, whereas lenders with a bank subsidiary increase their lending, as indicated by adding up the two effects for each column. In particular, in columns (1) and (2), we show that the effect of a 100% increase in exposure for lenders without a bank subsidiary corresponds with an 8.5% decrease in dollar volume of lending during the tax holiday, but relative to that, lenders with a bank subsidiary increase this amount by over 13%, whether controlling for lender type or not. In columns (3) and (4), we find a similar result for the number of loans made. Namely, a 100% increase in exposure for lenders without a bank subsidiary have a 6% decrease in dollar volume of lending, but incremental to that, lenders with a bank subsidiary see a 7.4% increase. These findings are suggestive that banks respond by making more and larger loans, whereas nonbank lending institutions invest their money elsewhere in response to their exposure to the holiday. We next measure the effect of the tax holiday on credit supply by lenders, while fixing the demand for loans. In Table 5, we measure loan amounts at the firm-lender-year level, which both substantially increases our sample size and focuses the identifying variation we use within borrower. In column (1), we include no fixed effects, and find that a 100% increase in exposure is associated with a 0.79% increase in the loan(s) that a particular lender gives to 21
a borrower. This indicates that loan amounts are driven, at least in part, by the supply-side exposure of lenders to the tax holiday. In columns (2) and (3), we add bank, firm, and year fixed effects, and then bank by firm fixed effects. In both specifications we get similar results, meaning that the effects are not due to specific bank-firm relationships. Finally, in column (4) we employ firm by year fixed effects, as in Khwaja and Mian (2008), which controls for any time-varying loan demand at the borrower level. In particular, our results show that within-borrower trends in borrowing are not driving our findings, further indicating that differences in exposure across lenders affects the amount loaned. A 100% increase in exposure is associated with a 0.96% increase in loan amounts. Effects of the policy may depend on aspects of the borrower, and the borrower’s relationship with the lender. In Table 6, we use Khwaja and Mian (2008) fixed effects regressions to uncover what drives increased lending in the cross-section. In column (1), in the subsample of loans for which the borrower has a prior relationship with the lender, we find that a 100% increase in exposure is associated with a 15.5% increase in loan amounts. This coefficient is comparatively much larger than in the full population of lenders, for which we find an effect of 0.96% in Table 5, column (4). This is intuitive, as it is consistent with a lender responding to the tax holiday by loaning more, but especially to borrowers with whom a prior relationship exists. Similarly, we find a coefficient of 1.10% in column (2) looking at only the subsample of private firms, and 0.84% for the subsample of only public domestic firms in column (3). In columns (4), (5), and (6) of Table 7, we perform similar tests using the entire sample and an employing a triple-difference specification to isolate the incremental effects of Exposure based on whether borrowers have an existing relationship with their lender, are 22
private, and only have domestic operations, respectively. In column (4), we find a substantial marginal response due to exposure for borrowers and lenders for which a prior relationship exists. In column (5), we find an incremental effect of being a private firm. Private firms are more likely to be those that banks lend to when they have excess funds because they are not exposed in the same ways as public firms are on average. First, the tax holiday affected most private firms differently than it did public firms (Redmiles, 2008). Further, private firms are less likely than public firms to have foreign income. In column (6), we restrict our sample to loans taken out by public firms in order to estimate the incremental effect of the holiday for domestic firms (i.e., firms with no after-tax foreign income). We find that the incremental effects of the policy for domestic firms is roughly 50% greater than for public firms in general. Domestic firms see no direct benefits from the tax holiday, like many private firms, and so are more likely to need additional money in loans. As such, the effect of exposure of the lender is more relevant to these borrowers. When lenders are affected indirectly by the tax holiday, we have shown that they increase lending, particularly to private, domestic firms, with which they have a prior lending relationship. We now investigate changes to the loan contracts themselves as a result of exposure to the tax holiday. In Table 7, we estimate equation 1 while including bank and year, as well as loan purpose and loan type fixed effects to control for any aspects of loans that may be correlated with these characteristics. In column (1) of Table 7, we find that a 100% increase in exposure to the tax holiday leads to loan spreads that are 1.98% lower. This is consistent with lenders affected by the holiday being able to offer cheaper financing. Further, after controlling for loan purpose as well as loan type, in column (2) we find that the effect of exposure on loan amounts is still 23
positive and statistically significant at 2.82%. We also see in column (3) that the maturity of these loans increases by 1.70%, and in column (4) that the likelihood the loan is secured goes down by -0.90%. Exposed lenders are more willing to accept longer maturity loans, and are less concerned with receiving collateral for the loans they make. In column (5), restricting to loans with covenants, we find that the number of covenants decreases by -5.50%, meaning lenders are less concerned with contracting on borrowers’ post-origination financial health. Finally, lenders are more willing to offer revolving lines of credit to their borrowers. In column (6), we show a 1.20% increase in the probability of a loan being a revolver.
4.2
Real effects of fiscal policy transmission
So far we have shown that exposure to the tax holiday of 2004-2005 through existing borrowers led lenders to increase their dollar volume of lending as well as loans made. Further, these effects are concentrated in banks, where other lending institutions are actually responding in the opposite fashion, by decreasing their lending in response to exposure to the channel. We have also found that prior relationships between borrowers and lenders as well as private and domestic status have incrementally positive effects on loan amounts, and that other terms of the loan are affected by the tax holiday. We now investigate whether this increased loan activity, much of which we have shown to be driven by credit supply, leads to real behavior changes by corporate borrowers. Here, we study the effects of increased loan amounts on various types of corporate investment: namely, capital expenditures, R&D, and acquisition activity. Because we are interested in the effect of the policy, rather than simply the effect of higher loan amounts, we
24
instrument for loan amount using our first stage model, equation 1. This gives us predicted loan amounts, as a function of a lender’s exposure to the tax holiday through its borrowers. We then regress the log of capital expenditures, and our other variables of interest, on predicted loan amounts, to understand the degree to which increased loan amounts (via the tax holiday exposure channel) change these outcomes. In Table 8, Panel A, we first regress the log of variables of interest on the log of predicted loan amounts for public firms. This allows us to interpret our findings in percent terms, similar to our previous tables. In column (1), we study the effects of loan amount on capital expenditures. We find that a 100% increase in loan amounts leads to roughly a 31% increase in capital expenditures. This relative increase in predicted loan amounts is substantially less than a standard deviation for both an average and a median borrower within our sample. In column (2), we find that this increase in loan amounts leads to an 8.4% increase in R&D. We also see a 7.6% increase in acquisition expenditures in column (3). In column (4), we estimate the effect of increased loan amounts on total investment, or the sum of these three variables, and find that it results in a 29.9% increase in total investment. Of note, the previous three percentages need not sum to the fourth, given that in Panel A we measure changes in percentage terms. While percentage changes may be illustrative, they do not directly show how the policy affects actual dollar spending. In Panel B of Table 8, we model dollar expenditures on dollar loan amounts to find the per-dollar spending induced by additional loans. In column (1), we find that one dollar increase in loan amounts leads to 10.2 cents of additional capital expenditures. We further find an increase in R&D of 1.9 cents in column (2) and an increase in acquisition spending of 2.1 cents in column (3). Summing these three expenditures together, 25
we get a total investment effect of 14.3 cents of increased investment for every additional dollar in loan funds. These numbers show that the actual pass through of increased lending in dollar terms is substantive. Different types of firms may respond differently to an increase in loan amounts. We next investigate the effects of the policy on domestic and multinational public firms. In Panel A of Table 9, we find that a one dollar increase in loan amounts for a firm we classify as only domestic (it has no foreign income net of foreign taxes paid) sees increases of 10.8 cents in capital expenditures, 1.7 cents of R&D, and 1.6 cents of acquisitions spending, in columns (1), (2), and (3), respectively. In column (4), we show that this totals to 14.1 cents of increased investment by domestic public firms. In Panel B, we see much larger effects for multinational firms. In column (1) we show that multinational firms respond with 26 cents of increased capital expenditures to each dollar increase in loan amounts. While the relative difference is larger for capital expenditures, in columns (2) and (3) we show that the increases in R&D and acquisitions spending are proportionally much larger for multinational firms, at 7.0 cents and 10.2 cents, respectively. In column (4), we show that total investment for multinational firms increases 43.2 cents for every additional dollar of loaned funds. We see here that multinational firms appear to do much different things with loans than do domestic firms. We are also interested in the differences in loan use between private and public firms, but we cannot observe spending by private firms. We therefore use stated loan purpose as a proxy for what is done with loaned funds. In Table 10, we model the proportion of loaned funds under a loan purpose category on instrumented loan amounts. In Panel A, we investigate loan purpose for private firms. In column (1), we see that an increase in loan 26
amounts of one dollar is associated with 4.7 cents of loans purposed for capital expenditures. In columns (2) and (3) we see 7.6 cents of these loans are used on average for acquisitions, and 24.0 cents of these loans are taken out for the purpose of increasing working capital. In column (4), we observe that the predominant stated use of loaned funds for private firms is debt repayment, or 63.7 cents. In Panel B, we find similar stated uses from public firms. Public firms are less likely to state that the purpose of a loan is for capital expenditures, at only 1.8 cents out of an additional dollar of loans, in column (1). However, public firms are just as likely to state that acquisitions or working capital are the purpose of the loan, with a one dollar increase leading to 8.6 cents of loans purposed for acquisitions in column (2), and 23.4 cents purposed for working capital in column (3). Finally, debt repayment accounts for 66.1 cents of every dollar increase in loan amounts, on average, for public firms.
4.3
Mechanism for the fiscal policy channel
The AJCA tax holiday provided a potential windfall for companies with foreign income. Namely, the policy allowed for repatriation of foreign income at a maximum tax rate of 5.25% rather than 35%. This windfall should have some ostensible benefits for these firms, but in a way that actually benefits their banks. In Table 11, we investigate the degree to which exposure to the tax holiday improves outcomes for the portfolio of borrowers of a lender. We measure the count of future defaults to determine whether or not lenders have a reason to increase their lending. In columns (1) and (2), we investigate defaults one year ahead, and find that a 100% increase in exposure to the tax holiday for a lender leads to roughly a 5.9% decline in the number of defaults. In columns (3) and (4), we find that the
27
decrease in the number of defaults three years after the tax holiday is roughly 4.2%. We include bank, year, and then lender type fixed effects in our regressions, and the reduction in default risk stays the same. This finding is clearly illustrated in Figure 4. In particular, we see that the difference in pre-period default rates is statistically insignificant. However, during and following the tax holiday, we see that default rates in the loan portfolios of lenders with above median exposure to the tax holiday are statistically significantly smaller, and this is maintained for three years. Overall, exposure to this windfall provides direct impetus to lenders to increase lending, as their respective loan portfolios are now less risky. This finding is consistent with Oler et al. (2007), who look at the market response to the announcement of the AJCA and find that the market values of the affected firms increased by approximately the amount of the potential tax savings from the holiday. Notably, this price effect occurred in advance of any announcements by firms concerning their plans for repatriation under the holiday, and so suggests that market participants were sufficiently sophisticated to anticipate how the holiday would affect firms.
5
Conclusion
We propose and test a channel through which fiscal policy changes affect the supply of intermediated credit and the real economy. Banks that have greater exposure to firms expected to repatriate a significant amount of foreign income as a result of a 2004-2005 U.S. tax holiday subsequently increase lending to other domestic, private firms during the period of the tax holiday, leading to higher investment at these firms. Our results complement the existing literature on the credit channel of monetary policy transmission and highlight an
28
important indirect spillover effect of fiscal policy changes on firms that might otherwise have difficulty accessing credit markets.
29
References Agarwal, Sumit, Souphala Chomsisengphet, Neale Mahoney, and Johannes Stroebel (2018), “Do Banks Pass through Credit Expansions to Consumers Who Want to Borrow?” Quarterly Journal of Economics, 133, 129–190. Albring, Susan M., Lillian F. Mills, and Kaye J. Newberry (2011), “Do Debt Constraints Influence Firms Sensitivity to a Temporary Tax Holiday on Repatriations?” Journal of the American Tax Association, 33, 1–27. Bernanke, Ben S. and Alan Blinder (1988), “Credit, Money, and Aggregate Demand.” American Economic Review, 78, 435–439. Bernanke, Ben S. and Mark Gertler (1995), “Inside the Black Box: The Credit Channel of Monetary Policy Transmission.” Journal of Econonmic Perspectives, 9, 27–48. Bernanke, Ben S., Mark Gertler, and Simon Gilchrist (1996), “The Financial Accelerator and the Flight to Quality.” Review of Economics and Statistics, 78, 1–15. Blanchard, Olivier J. and Daniel Leigh (2013), “Growth Forecast Errors and Fiscal Multipliers.” American Economic Review Papers and Proceedings, 103, 117–120. Blouin, Jennifer and Linda Krull (2009), “Bringing It Home: A Study of the Incentives Surrounding the Repatriation of Foreign Earnings under the American Jobs Creation Act of 2004.” Journal of Accounting Research, 47, 1027–1059. Brennan, Thomas J. (2014), “Where the Money Really Went: A New Understanding of the AJCA Tax Holiday.” Working Paper, Northwestern University. Cohen, Lauren, Joshua Coval, and Christopher Malloy (2011), “Do Powerful Politicians Cause Corporate Downsizing?” Journal of Political Economy, 119, 1015–1060. Dharmapala, Dhammika, C. Fritz Foley, and Kristin J. Forbes (2011), “Watch What I Do, Not What I Say: The Unintended Consequences of the Homeland Investment Act.” Journal of Finance, 66, 753–787. Duchin, Ran and Denis Sosyura (2014), “Safer Ratios, Riskier Portfolios: Banks’ Response to Government Aid.” Journal of Financial Economics, 113, 1–28. Dyreng, Scott and Robert Hills (2017), “Evidence that Corporate Repatriations under the American Jobs Creation Act of 2004 Benefited the Domestic Economy.” Working Paper, Duke University. Faulkender, Michael and Mitchell Peterson (2012), “Investment and Capital Constraints: Repatriations Under the American Jobs Creation Act.” Review of Financial Studies, 25, 3351–3388. Gertler, Mark and Simon Gilchrist (1993), “The Role of Credit Market Imperfections in the Transmission of Monetary Policy: Arguments and Evidence.” Scandinavian Journal of Economics, 95, 43–64. 30
Gertler, Mark and Simon Gilchrist (1994), “Monetary Policy, Business Cycles, and the Behavior of Small Manufacturing Firms.” Quarterly Journal of Economics, 109, 309–340. Graham, John R., Michelle Hanlon, and Terry Shevlin (2010), “Barriers to Mobility: The Lockout Effect of U.S. Taxation of Worldwide Corporate Profits.” National Tax Journal, 63, 1111–1144. Ilzetzki, Ethan, Enrique G. Mendoza, and Carlos A. Vegh (2013), “How Big (Small?) are Fiscal Multipliers?” Journal of Monetary Economics, 60, 239–254. Kashyap, Anil and Jeremy Stein (2000), “What Do A Million Observations on Banks Say About the Transmission of Monetary Policy?” American Economic Review, 90, 407–428. Khwaja, Asim Ijaz and Atif Mian (2008), “Tracing the Impact of Bank Liquidity Shocks: Evidence from an Emerging Market.” American Economic Review, 98, 1413–1442. Mertens, Karel and Morten O. Ravn (2014), “A Reconciliation of SVAR and Narrative Estimates of Tax Multipliers.” Journal of Monetary Economics, 68, S1–S19. Morrow, Michaele and Robert C. Ricketts (2014), “Financial Reporting versus Tax Incentives and Repatriation under the 2004 Tax Holiday.” Journal of the American Tax Association, 36, 63–87. Nakamura, Emi and Jon Steinsson (2014), “Fiscal Stimulus in a Monetary Union: Evidence from U.S. Regions.” American Economic Review, 104, 753–792. Oler, Mitchell, Terry Shevlin, and Ryan Wilson (2007), “Examining Investor Expectations Concerning Tax Savings on the Repatriations of Foreign Earnings under the American Jobs Creation Act of 2004.” Journal of the American Taxation Association, 29, 25–55. Ramey, Valerie (2011), “Can Government Purchases Stimulate the Economy?” Journal of Economic Literature, 49, 673–685. Redmiles, Melissa (2008), “The One-time Received Dividend Deduction.” Statistics of Income Bulletin, 27, 103–117. Riera-Crichton, Daniel, Carlos A. Vegh, and Guillermo Vuletin (2016), “Tax Multipliers: Pitfalls in Measurement and Identification.” Journal of Monetary Economics, 79, 30–48. Romer, Christina D. and David H. Romer (2010), “The Macroeconomic Effects of Tax Changes: Estimates Based on a New Measure of Fiscal Shocks.” American Economic Review, 100, 763–801. Serrato, Juan Carlos Suarez and Philippe Wingender (2016), “Estimating Local Fiscal Multipliers.” NBER Working Paper No. 22425. Williams, Emily (2018), “Monetary Policy Transmission and the Funding Structure of Banks.” Working Paper, Harvard Business School.
31
Figure 1. Bank Exposure to Potential Repatriated Income This figure presents a histogram of bank exposure to the repatriation tax holiday, which we measure as the natural log of their borrowers’ cumulative foreign income net of foreign taxes paid in between 2001 and 2003.
Figure 2. Bank Size and Exposure to Potential Repatriated Income This figure presents a scatter plot of bank exposure to the repatriation tax holiday, which we measure as the natural log of their borrowers’ cumulative foreign income net of foreign taxes paid in between 2001 and 2003, against bank size, which we measure as the natural log of the bank’s total loan supply in 2003.
32
Figure 3. Parallel Trends in Bank Credit Supply This figure plots estimates from the dynamic parallel trends test for each year around the repatriation tax holiday, which passed in 2004. The estimates are based on median splits in bank exposure to the repatriation tax holiday via their borrowers’ cumulative foreign income net of foreign taxes paid. The dependent variable is the natural log of credit supply, which is measured in dollar volume of loans. The difference in coefficients between 2003 and 2004 correspond to a 20.6% increase in credit supply for banks with above-median exposure to the repatriation tax holiday relative to banks with below-median exposure to the repatriation tax holiday.
33
Figure 4. Parallel Trends in Bank Portfolio Defaults This figure plots estimates from the dynamic parallel trends test for each year around the repatriation tax holiday, which passed in 2004. The estimates are based on median splits in bank exposure to the repatriation tax holiday via their borrowers’ cumulative foreign income net of foreign taxes paid. The dependent variable is the natural log of the count of portfolio defaults, which are measured using S&P long-term credit ratings. The difference in coefficients between 2003 and 2004 correspond to a 28.4% decrease in portfolio defaults for banks with above-median exposure to the repatriation tax holiday relative to banks with below-median exposure to the repatriation tax holiday.
34
Table 1. Summary statistics This table presents summary statistics for the main regression variables of interest for the three samples used in the paper. First, we present the borrower sample, for which we observe total borrowing, multiple dimensions of investment, and time-invariant characteristics. Second, we present summary statistics for the lenders in the sample, which comprise syndicates in any role (e.g., lead arranger or syndicate participant). We observe their exposure to the repatriation tax holiday via their borrowers’ cumulative foreign income net of foreign taxes paid, their credit supply in dollar and loan volume, and various time-invariant characteristics, including indicators for whether a subsidiaries of the lender include banks or other lender types. Third, we present summary statistics for loans issued during the sample period. For these loans, we observe the money terms of the loan as well as the covenant package.
Panel A. Borrowers Mean SD P25 P50 P75 Loan Amount ($M) 1,374.94 6,324.41 19.01 200 808.13 Total Investment ($M) 509.50 2,404.54 0 14.08 213.61 CAPEX ($M) 363.97 1,554.33 0 6.80 128.23 R&D ($M) 78.87 526.23 0 0 0 Acquisitions ($M) 66.66 1,353.01 0 0 1.23 Domestic 71.18% Panel B. Banks Mean SD P25 P50 P75 Exposure ($M) 187.21 837.57 0 0 37.27 Loan Supply ($M) 1,577.61 10,660.02 11.03 34.78 164.34 Number of Loans 44.21 211.43 2 4 13 Number of Loans as Lead 13.20 95.34 0 0 0 1[Non-Bank = 1] 52.83% 1[Domestic Lender = 1] 55.29% 1[Private Lender = 1] 32.95% Panel C. Loans Mean SD P25 P50 P75 Spread (bps) 178.81 158.55 55 150 250 Amount ($M) 392.45 931.09 37.92 125 386.32 Maturity (months) 59.69 48.66 36 60 72 Secured 78.73% #Covenants 2.65 1.15 2 3 3
35
Table 2. Fiscal Policy Effect on Bank-level Credit Supply This table presents fixed effects regression estimates of the effect of bank exposure to the repatriation tax holiday on credit supply. The bank-year sample includes 701 lenders, all of which have at least one subsidiary that is a bank, and covers the period spanning 2003Q3 to 2005Q2. Exposure is defined as the cumulative foreign income net of foreign taxes paid of all of the banks’ borrowers as of 2004Q2, immediately before the repatriation tax holiday was voted on in congress. Post is an indicator that equals one if the observation is from the 2004Q3—2005Q2 period and zero otherwise. Credit supply is measured using the natural log of total dollar volume of loans, lnAmount, or total number of loans, lnLoans. Both measures of credit supply are comprised of loans in which the lender takes any role in the syndicate. Lender type fixed effects refers to a series of indicator variables that equal one if the lender has at least one subsidiary of the respective lender type of the set {Mutual fund, Thrift, Institution, Insurance Company, Corporation, Finance Company, Trust, Bank}. Robust standard errors are clustered at the bank level and reported in parentheses. ***, **, and * represent statistical significance at the 1%, 5%, and 10% levels, respectively.
lnAmount (1) (2) Exposure × Post 4.599*** 4.737*** (1.703) (1.725)
lnLoans (3) (4) 1.267* 1.343** (0.662) (0.677)
Fixed effects: Lender type Bank Year R2 Obs.
No Yes Yes 0.9689 1,402
No Yes Yes 0.8891 1,402
Yes Yes Yes 0.8892 1,402
36
Yes Yes Yes 0.9689 1,402
Table 3. Fiscal Policy Effect on Bank-level Credit Supply: Measurement Robustness This table presents fixed effects regression estimates of the effect of bank exposure to the repatriation tax holiday on credit supply. Panel A measures credit supply using the total dollar volume of loans, lnAmount, and Panel B measures credit supply using the total number of loans, lnLoans. Both measures are comprised of loans in which the lender takes any role in the syndicate. The bank-year sample includes 701 lenders, all of which have at least one subsidiary that is a bank, and covers the period spanning 2003Q3 to 2005Q2. Whereas Exposure is defined as the cumulative foreign income net of foreign taxes paid of all of the banks’ borrowers as of 2004Q2 in all other tables, this table provides robustness for this measurement choice. In each panel of this table, column (1) uses cumulative foreign earnings, column (2) uses cumulative net foreign income (i.e., tax netting within rather than across years), column (3) uses cumulative net foreign income scaled by the total assets of the bank’s borrowers, column (4) uses cumulative net foreign income scaled by the total revenue of the bank’s borrowers, and column (5) saturates the baseline model with lnAmount × Year fixed effects. Post is an indicator that equals one if the observation is from the 2004Q3—2005Q2 period and zero otherwise. Lender type fixed effects refers to a series of indicator variables that equal one if the lender has at least one subsidiary of the respective lender type of the set {Mutual fund, Thrift, Institution, Insurance Company, Corporation, Finance Company, Trust, Bank}. Robust standard errors are clustered at the bank level and reported in parentheses. ***, **, and * represent statistical significance at the 1%, 5%, and 10% levels, respectively.
Exposure × Post
Exposure measure: Fixed effects: Lender type Bank Year Bank Size × Year R2 Obs.
Exposure × Post
Exposure measure: Fixed effects: Lender type Bank Year Bank Size × Year R2 Obs.
(1) 4.804*** (1.650)
Panel A. lnAmount (2) (3) 4.503** 5.607** (1.762) (2.396)
(4) 3.879*** (1.305)
(5) 21.114*** (5.662)
Cumulative For. Inc. (CFI)
Cumulative Net For. Inc. (CNFI)
Baseline/Assets
Baseline/ Sales
Baseline
Yes Yes Yes No 0.8893 1,402
Yes Yes Yes No 0.8891 1,402
Yes Yes Yes No 0.8888 1,402
Yes Yes Yes No 0.8890 1,402
Yes Yes Yes Yes 0.9030 1,402
(4) 1.523** (0.644)
(5) 3.700*** (0.948)
(1) 1.390** (0.647)
Panel B. lnLoans (2) (3) 1.495** 2.215 (0.666) (1.640)
Cumulative For. Inc. (CFI)
Cumulative Net For. Inc. (CNFI)
Baseline/Assets
Baseline/ Sales
Baseline
Yes Yes Yes No 0.9690 1,402
Yes Yes Yes No 0.9690 1,402
Yes Yes Yes No 0.9689 1,402
Yes Yes Yes No 0.9690 1,402
Yes Yes Yes Yes 0.9696 1,402
37
Table 4. Fiscal Policy Effect on Credit Supply: Banks vs. Non-Bank Intermediaries This table presents fixed effects regression estimates of the effect of bank exposure to the repatriation tax holiday on credit supply. The lender-year sample includes 1,336 lenders, including non-bank lenders, and covers the period spanning 2003Q3 to 2005Q2. Exposure is defined as the cumulative foreign income net of foreign taxes paid of all of the banks’ borrowers as of 2004Q2, immediately before the repatriation tax holiday was voted on in congress. Post is an indicator that equals one if the observation is from the 2004Q3—2005Q2 period and zero otherwise. Bank is an indicator that equals one if the lender has at least one subsidiary that is a bank and zero otherwise. Credit supply is measured using the natural log of total dollar volume of loans, lnAmount, or total number of loans, lnLoans. Both measures of credit supply are comprised of loans in which the lender takes any role in the syndicate. Lender type fixed effects refers to a series of indicator variables that equal one if the lender has at least one subsidiary of the respective lender type of the set {Mutual fund, Thrift, Institution, Insurance Company, Corporation, Finance Company, Trust, Bank}. Robust standard errors are clustered at the lender level and reported in parentheses. ***, **, and * represent statistical significance at the 1%, 5%, and 10% levels, respectively.
lnAmount (1) (2) Exposure × Post -8.451*** -8.519*** (3.174) (3.186) … × Bank 13.050*** 13.371*** (3.602) (3.622) Fixed effects: Lender type Bank Year R2 Obs.
No Yes Yes 0.8767 2,672
Yes Yes Yes 0.8768 2,672
38
lnLoans (3) (4) -6.107*** -5.996*** (1.348) (1.343) 7.375*** 7.369*** (1.502) (1.510)
No Yes Yes 0.9572 2,672
Yes Yes Yes 0.9574 2,672
Table 5. Fiscal Policy Effect on Credit Supply Within Borrower This table presents fixed effects regression estimates of the effect of bank exposure to the repatriation tax holiday on credit supply for borrowers. Because these regressions are performed using within borrower variation in exposure, this essentially holds borrowing demand as fixed. The firm-bank-year sample matches every active bank to every active borrower during the 2003Q3—2005Q2 period. Exposure is defined as the cumulative foreign income net of foreign taxes paid of all of the banks’ borrowers as of 2004Q2, immediately before the repatriation tax holiday was voted on in congress. Post is an indicator that equals one if the observation is from the 2004Q3—2005Q2 period and zero otherwise. Credit supply is measured using the natural log of total dollar volume of loans, lnAmountijt, between the borrower i and bank j pair in year t, and is comprised of loans to borrower i in which bank j takes any role in the syndicate. Column (4) includes Firm ×Year fixed effects as in Khwaja and Mian (2008), which controls for timevarying loan demand at the borrower level. Robust standard errors are clustered at the bank level and reported in parentheses. ***, **, and * represent statistical significance at the 1%, 5%, and 10% levels, respectively.
(1) Exposure × Post 0.788*** (0.140) Exposure 3.417*** (0.653) Post -0.609*** (0.230) Fixed effects: Bank Firm Year Bank × Firm Firm × Year R2 Obs.
No No No No No 0.0066 3,993,400
lnAmount (2) (3) 0.788*** 0.958*** (0.140) (0.181)
(4) 0.958*** (0.181)
Yes No No Yes No No Yes Yes No No Yes Yes No No Yes 0.0562 0.7237 0.7271 3,993,400 2,938,880 2,938,880
39
Table 6. Fiscal Policy Effect on Credit Supply: Cross-sectional Heterogeneity This table presents Khwaja Mian (2008) fixed effects regression estimates of the effect of bank exposure to the repatriation tax holiday on credit supply. The firm-bank-year sample matches every active bank to every active borrower during the 2003Q3—2005Q2 period. Exposure is defined as the cumulative foreign income net of foreign taxes paid of all of the banks’ borrowers as of 2004Q2, immediately before the repatriation tax holiday was voted on in congress. Post is an indicator that equals one if the observation is from the 2004Q3—2005Q2 period and zero otherwise. Credit supply is measured using the natural log of total dollar volume of loans, lnAmountijt, between the borrower i and bank j pair in year t, and is comprised of loans to borrower i in which bank j takes any role in the syndicate. Columns (1)—(3) condition the sample on inclusion criteria based on characteristics of the borrower. Columns (4)—(6) use the full sample, but interact these borrower characteristics in a triple difference design. The characteristics are Relationship, an indicator if bank j participated in at least one of borrower i’s syndicates prior to 2004Q2, Private, an indicator that equals one if the borrower is a privately-held firm, and Domestic, an indicator that equals one if the borrower has no cumulative foreign income net of foreign taxes paid. These characteristics capture the borrower’s direct exposure to the repatriation tax holiday, and the intensity of their exposure to lenders with and without indirect exposure to the repatriation tax holiday via their corporate loan portfolios. The regressions concerning Domestic include observations only if the associated borrower is publicly listed. Robust standard errors are clustered at the bank level and reported in parentheses. ***, **, and * represent statistical significance at the 1%, 5%, and 10% levels, respectively.
Exposure × Post … × Relationship
lnAmount Domestic Full sample only (3) (4) (5) (6) 0.841*** 1.640*** 0.850*** 0.586*** (0.203) (0.275) (0.168) (0.154) 39.930*** (10.605) 0.250*** (0.092) 0.248** (0.116)
Relationship only (1) 15.485** (6.832)
Private only (2) 1.100*** (0.209)
Yes Yes 0.8445 24,350
Yes Yes 0.6984 1,263,456
… × Private … × Domestic
Fixed effects: Firm × Year Bank × Firm R2 Obs.
40
Yes Yes 0.7632 702,576
Yes Yes 0.7331 2,938,880
Yes Yes Yes Yes 0.7271 0.7679 2,938,880 1,035,496
Table 7. Fiscal Policy Effect on Loan Terms This table presents fixed effects regression estimates of the effect of bank exposure to the repatriation tax holiday on loan terms and types. The sample includes loans from the 2003Q3—2005Q2 period. Exposure is defined as the cumulative foreign income net of foreign taxes paid of all of the banks’ borrowers as of 2004Q2, immediately before the repatriation tax holiday was voted on in congress. Post is an indicator that equals one if the observation is from the 2004Q3—2005Q2 period and zero otherwise. Spread is the all-in-drawn spread (in bps) over the base rate, Amount is the dollar amount of the loan facility, Maturity is the time (in months) until the loan facility matures, Secured is an indicator that equals one if the loan is backed by some form of collateral, #Covenants is the number of covenants in the covenant package, and Revolver is an indicator variable that equals one if the loan type is a revolving credit facility. Observation counts vary due to the availability of data on outcome variables. Robust standard errors are clustered at the loan level and reported in parentheses. ***, **, and * represent statistical significance at the 1%, 5%, and 10% levels, respectively.
Exposure × Post
Fixed effects: Bank Year Loan purpose Loan type Sample restriction R2 Obs.
lnSpread lnAmount lnMaturity Secured (1) (2) (3) (4) -1.975*** 2.824*** 1.704*** -0.904** (0.663) (1.029) (0.426) (0.426)
Yes Yes Yes Yes
Yes Yes Yes Yes
Yes Yes Yes Yes
Yes Yes Yes Yes
0.5029 25,122
0.2831 40,777
0.5157 39,734
0.2947 11,923
41
ln#Covenants (5) -5.496** (2.455)
Revolver (6) 1.195*** (0.247)
Yes Yes Yes Yes #Covenants > 0 0.2622 5,803
Yes Yes Yes No 0.1262 40,997
Table 8. Real Effects of Fiscal Policy Transmission: Instrumental Variables This table presents instrumental variables regression estimates of the effect of bank exposure to the repatriation tax holiday on borrower investment. We instrument for the total loan amount issued by borrower i using the total exposure to the repatriation tax holiday of borrower i’s banks, interacted with Post, an indicator variable that equals one if the borrower-year observation is during the 2004Q3—2005Q2 period. The firm-year sample includes 2,742 borrowers and covers the period spanning 2003Q3 to 2005Q2. TotalExposure is defined as the cumulative Exposure of borrower i’s banks as of 2004Q2, immediately before the repatriation tax holiday was voted on in congress. Investment is measured as lnCAPEX, the natural log of capital expenditures, lnR&D, the natural log of research and development expense, lnAcquisitions, the natural log of acquisition expenditures, or lnTotalInvestment, the natural log of the sum of these three components. Total credit supply to borrower i is measured using the natural log of total dollar volume of loans issued by borrower i, lnAmount. Panel A presents estimates in which each variable is measured in logs, and, for quantification, Panel B presents estimates in which each variable is measured in dollars. Robust standard errors are clustered at the firm level and reported in parentheses. ***, **, and * represent statistical significance at the 1%, 5%, and 10% levels, respectively.
� ln𝐴𝐴𝐴𝐴𝐴𝐴𝐴𝐴𝐴𝐴𝐴𝐴
Panel A. Logs (coefficients reported ×100) lnCAPEX lnR&D lnAcquisitions lnTotalInvestment (1) (2) (3) (4) 31.191*** 8.477*** 7.617*** 29.903*** (2.910) (1.561) (1.588) (3.017)
Fixed effects: Year First-Stage F Obs.
� 𝐴𝐴𝐴𝐴𝐴𝐴𝐴𝐴𝐴𝐴𝐴𝐴 Fixed effects: Year First-Stage F Obs.
Yes 123.96 5,484
Yes
Yes
Yes
5,484
5,484
5,484
Panel B. Dollars CAPEX R&D Acquisitions TotalInvestment (1) (2) (3) (4) 0.102*** 0.019*** 0.021* 0.143*** (0.016) (0.006) (0.011) (0.024)
Yes 327.160 5,484
Yes
Yes
Yes
5,484
5,484
5,484
42
Table 9. Real Effects of Fiscal Policy Transmission: Domestic vs Multinational This table presents instrumental variables regression estimates of the effect of bank exposure to the repatriation tax holiday on borrower investment for domestic-only and multinational firms. We instrument for the total loan amount issued by borrower i using the total exposure to the repatriation tax holiday of borrower i’s banks, interacted with Post, an indicator variable that equals one if the borrower-year observation is during the 2004Q3—2005Q2 period. The firm-year sample includes 3,404 borrower-year observations, 2,423 are from domestic-only borrowers and 981 are from multinational borrowers, and covers the period spanning 2003Q3 to 2005Q2. TotalExposure is defined as the cumulative Exposure of borrower i’s banks as of 2004Q2, immediately before the repatriation tax holiday was voted on in congress. Investment is measured as lnCAPEX, the natural log of capital expenditures, lnR&D, the natural log of research and development expense, lnAcquisitions, the natural log of acquisition expenditures, or lnTotalInvestment, the natural log of the sum of these three components. Total credit supply to borrower i is measured using the total dollar volume of loans issued by borrower i, Amount. Panel A presents estimates for domestic-only borrowers, and Panel B presents estimates for multinational firms. Robust standard errors are clustered at the firm level and reported in parentheses. ***, **, and * represent statistical significance at the 1%, 5%, and 10% levels, respectively.
� 𝐴𝐴𝐴𝐴𝐴𝐴𝐴𝐴𝐴𝐴𝐴𝐴 Fixed effects: Year First-Stage F Obs.
� 𝐴𝐴𝐴𝐴𝐴𝐴𝐴𝐴𝐴𝐴𝐴𝐴 Fixed effects: Year First-Stage F Obs.
Panel A. Domestic-only firms CAPEX R&D Acquisitions TotalInvestment (1) (2) (3) (4) 0.108*** 0.017*** 0.016 0.141*** (0.020) (0.007) (0.012) (0.026)
Yes 200.75 2,423
Yes
Yes
Yes
2,423
2,423
2,423
Panel B. Multinational firms CAPEX R&D Acquisitions TotalInvestment (1) (2) (3) (4) 0.260*** 0.070** 0.102** 0.432*** (0.077) (0.034) (0.051) (0.104)
Yes 59.89 981
Yes
Yes
Yes
981
981
9181
43
Table 10. Real Effects of Fiscal Policy Transmission: Public vs Private This table presents instrumental variables regression estimates of the effect of bank exposure to the repatriation tax holiday on borrower investment. We instrument for the total loan amount issued by borrower i using the total exposure to the repatriation tax holiday of borrower i’s banks, interacted with Post, an indicator variable that equals one if the borrower-year observation is during the 2004Q3—2005Q2 period. The firm-year sample includes 8,308 borrower-year observations, including 3,809 from private firms and 4,499 from public firms, and covers the period spanning 2003Q3 to 2005Q2. TotalExposure is defined as the cumulative Exposure of borrower i’s banks as of 2004Q2, immediately before the repatriation tax holiday was voted on in congress. We capture borrower usage using the loan purpose field from Dealscan, aggregating loan amounts by purpose. We identify loans with capital expenditure (CAPEX), acquisition or takeover (Acquisitions), working capital or corporate purposes (WorkCap), and debt repayment or recapitalization (DebtRepay). Total credit supply to borrower i is measured using the natural log of total dollar volume of loans issued by borrower i, lnAmount. Panel A presents estimates in which each variable is measured in logs, and, for quantification, Panel B presents estimates in which each variable is measured in dollars. Robust standard errors are clustered at the firm level and reported in parentheses. ***, **, and * represent statistical significance at the 1%, 5%, and 10% levels, respectively.
� 𝐴𝐴𝐴𝐴𝐴𝐴𝐴𝐴𝐴𝐴𝐴𝐴 Fixed effects: Year First-Stage F Obs.
� 𝐴𝐴𝐴𝐴𝐴𝐴𝐴𝐴𝐴𝐴𝐴𝐴 Fixed effects: Year First-Stage F Obs.
Panel A. Private firms CAPEX Acquisitions WorkCap DebtRepay (1) (2) (3) (4) 0.047* 0.076** 0.240*** 0.637*** (0.027) (0.034) (0.093) (0.094)
Yes 114.64 3,809
Yes
Yes
Yes
3,809
3,809
3,809
Panel B. Public firms CAPEX Acquisitions WorkCap DebtRepay (1) (2) (3) (4) 0.018** 0.086** 0.234*** 0.661*** (0.008) (0.037) (0.045) (0.046)
Yes 257.41 4,499
Yes
Yes
Yes
4,499
4,499
4,499
44
Table 11. The Credit Channel: Future Default Rates This table presents fixed effects regression estimates of the effect of bank exposure to the repatriation tax holiday on future default rates. The bank-year sample includes 701 lenders, all of which have at least one subsidiary that is a bank, and covers the period spanning 2003Q3 to 2005Q2. Exposure is defined as the cumulative foreign income net of foreign taxes paid of all of the banks’ borrowers as of 2004Q2, immediately before the repatriation tax holiday was voted on in congress. Post is an indicator that equals one if the observation is from the 2004Q3—2005Q2 period and zero otherwise. Future default rates are measured using S&P long-term credit ratings data; Defaults1yr is the count of borrowers in the bank’s portfolio within the next year that have a default rating, and Defaults3yrs is the count of borrowers in the bank’s portfolio over the next 3 years with a default rating. These measures incorporate defaults based on borrower exposures via any syndicate role. Lender type fixed effects refers to a series of indicator variables that equal one if the lender has at least one subsidiary of the respective lender type of the set {Mutual fund, Thrift, Institution, Insurance Company, Corporation, Finance Company, Trust, Bank}. Robust standard errors are clustered at the bank level and reported in parentheses. ***, **, and * represent statistical significance at the 1%, 5%, and 10% levels, respectively.
lnDefaults1yr (1) (2) Exposure × Post -5.965*** -5.878*** (0.591) (0.603) Fixed effects: Lender type Bank Year R2 Obs.
No Yes Yes 0.9565 1,402
Yes Yes Yes 0.9570 1,402
45
lnDefaults3yr (3) (4) -4.252*** -4.228** (0.541) (0.559)
No Yes Yes 0.9695 1,402
Yes Yes Yes 0.9697 1,402