COP_Arnone_Iliopulos
22-05-2007
8:20
Pagina 1
MARCO ARNONE ELENI ILIOPULOS
The cost of corruption Economic, institutional and social effects ECONOMIA | RICERCHE
© 2007 Vita e Pensiero
Foreword by Vito Tanzi Introduction by Gabrio Forti
PP Arnone_Iliopulos
21-05-2007
17:21
Pagina 1
www.vitaepensiero.it © 2007 Vita e Pensiero - Largo A. Gemelli, 1 - 20123 Milan ISBN 978-88-343-1470-8 All rights reserved. This copy is sold for personal use only. Reproductions not intended for personal use, as well as unauthorized copying, hiring, lending are prohibited and will be punished in accordance with the provisions of the law.
indice.qxd
22/05/2007
8.19
Pagina
II
SUMMARY
Foreword by Vito Tanzi Aknowledgements Introduction by Gabrio Forti
© 2007 Vita e Pensiero
I.
VII XIII XV
Corruption: overview of causes, effects, and policies 1. Corruption: definitions and characteristics 2. Preconditions for corruption 3. Governance 4. Structure of the book 5. The data 6. Policies
2 2 5 6 9 11 12
II. Corruption, firms, and markets 1. Markets and “rules” 2. Corruption and distorsions 2.1. Impact on new market entrants 2.1.1. Advantages and inefficiencies of politically-connected firms 2.2. Competitiveness: effects on firms in corrupt environments 2.2.1. Obstacles to businesses 2.2.2. Dangers and costs for firms 2.2.3. Regulated competition 2.3. Corruption and its impact on markets 2.4. Small and medium size firms 2.5. The allocation of talents 2.6. Economic development and corruption
16 16 19 20 23 26 26 27 30 33 36 37 38
© 2007 Vita e Pensiero
indice.qxd
22/05/2007
8.19
Pagina
III
SUMMARY
III
III. Corruption and macroeconomic performance 1. Domestic product 1.1. Economic growth 2. Corruption and effects on growth: an analysis of causal relations 2.1. Indirect causation: investments, risk, and interest rates 2.1.1. Foreign direct investment 2.1.2. Capital flows and exported corruption 2.2. Indirect causation: international trade 2.3. Indirect causation: political instability 2.4. Indirect causation: education 2.4.1. Education and corruption 2.5. Direct and indirect causation: corruption and growth 3. Inflation 4. The public sector 4.1. Public revenues and domestic corruption 4.2. Public spending 4.3. Public investments 4.4. Size of the public sector 5. Economic inequality 6. Corruption and persistence
40 40 44
IV. Governance, corruption, and effects on institutions 1. Supervision and regulation 1.1. Regulatory quality 1.2. Quality and quantity of regulation 1.3. Supervisory agencies 1.4. Financial supervision 1.4.1. Banking supervision 1.4.2. Securities markets supervision 1.4.3. Insurance markets supervision 2. Monetary policy and transparency 3. Corruption and governance 3.1. Istitutions and governance indicators 3.1.1. Accountability 3.1.2. Political stability 3.1.3. The rule of law
48 49 53 56 60 61 61 63 65 66 68 68 71 75 76 79 80 82 84 84 86 88 89 90 92 94 96 98 99 100 102 103
indice.qxd
28/05/2007
11.52
Pagina
IV
IV
SUMMARY
3.1.4. Control of corruption 3.1.5. Government effectiveness 3.2. Parliament and laws 4. Democracy and corruption
105 106 108 109
V. Social costs of corruption: human development and social exclusion 1. Corruption and human development 2. Public spending on health 3. Gender discrimination and corruption 4. Immigration 5. Freedom of the media 6. Equity of justice
111 112 113 116 119 124 126
© 2007 Vita e Pensiero
VI. International Financial Institutions and their role in strengthening the “rule of law” 129 1. Introduction 129 2. International, non-governmental, and multilateral organization, and the “rule of law” 130 3. The World Bank initiatives 130 3.1. World Bank strategies and instruments to strengthen the “rule of law” 131 4. The role of the International Monetary Fund 133 4.1. The Financial Action Task Force, the IMF, anti-money laundering and the international financial standards 134 136 5. The role of the G8 Box 6.1. Fighting corruption and increasing transparency – G8 Declaration 136 APPENDIX I Notes on Figures
138
APPENDIX II Data sources
159
List of Figures
162
References
165
Authors
173
dedica.qxd
22/05/2007
8.19
Pagina
V
© 2007 Vita e Pensiero
To our parents
epigrafe.qxd
22/05/2007
8.19
Pagina
VI
Crimes are only to be measured by the injury done to society. Ch. 7 The great and rich should by no means have it in their power to set a price on the security of the weak and indigent; for then riches, which, under the protection of the laws, are the reward of industry, would become the aliment of tyranny. Liberty is at an end whenever the laws permit that, in certain cases, a man may cease to be a person, and become a thing. Then will the powerful employ their address to select from the various combinations of civil society all that is in their own favour. This is that magic art which transforms subjects into beasts of burden, and which, in the hands of the strong, is the chain that binds the weak and incautious. Thus it is that in some governments, where there is all the appearance of Liberty, tyranny lies concealed, and insinuates itself into some neglected corner of the constitution, where it gathers strength insensibly. Mankind generally oppose, with resolution, the assaults of barefaced and open tyranny, but disregard the little insect that gnaws through the dike, and opens a sure though secret passage to inundation. Ch. 20
© 2007 Vita e Pensiero
Cesare Beccaria, Of crimes and punishments, 1764
presentazione.qxd
22/05/2007
8.19
Pagina
VII
© 2007 Vita e Pensiero
Foreword
Corruption is not a new phenomenon. It has been around for thousands of years and it can be assumed that it will be around for the next thousands. However, it is a phenomenon that keeps changing and acquiring new forms and shapes. It seems to have become more widespread and more damaging in recent decades when it has taken new and more insidious forms in economies with large public sector and private markets. Economies in which private markets become more widespread and efficient are likely to be more damaged by corruption. The reason is that explicit policy obstacles play less than a role compared with markets in which many significant policy distortions are present. The same is likely to be true for political systems. Over the last century there has been a long-term movement toward democratic forms of government. Democracies are more likely to be damaged by corruption than political systems that were already greatly distorted by non democratic institutions. In the past the prevalent aspect was bureaucratic corruption. Now another worry is “state capture”, in presumably democratic societies. In other words the concern that in democratic societies lobbies or other vested interest will manage to use the apparatus of the state for their own benefit. We also begin to worry about forms of corruption that did not exist or were rare before, but that are becoming common in private market activities. These new forms of corruption appear especially when private markets create the equivalent of “public space” for some individuals. This for example is the case in large corporation in which thousands of absentee shareholders end up having little say in the running of the enterprises that they legally own. Managers or other employee can take advantage of power that they acquire within the enterprises. State capture is not a new form of corruption but
presentazione.qxd
© 2007 Vita e Pensiero
VIII
22/05/2007
8.19
Pagina
VIII
VITO TANZI
it was supposed to have vanished when authoritarian governments became democratic. Lobbying has become more prevalent and has intensified to the point where it begins to threaten the representativenesss of democratic institutions and the extent to which policymakers are truly promoting the true public interests. Corruption can involve single and random acts by individual bureaucrats, or involve integrated acts by groups of strategically placed public employees or political appointees. Occasionally it involves political leaders who have the power to approve and control various activities and actions. Corruption can thus act like a randomly imposed excise tax or like a multiple stage sales tax that systematically adds to the cost of each transaction. In some cases the financial cost of a bribe is known ex ante in the sense that one knows who to contact and how much it will cost to get a specific favor that has economic value. In other cases it is not, so that there is more uncertainty and search costs. Economists have debated which form of corruption is more damaging to economic activities. Generally they have concluded that when the cost of corruption is known ex ante and is thus predictable is less damaging economically than corruption that is not predictable and that does not come with a known price. For this reason some economists have argued that the corruption that was common in Indonesia during Suharto’s times was less damaging than the corruption that, for example, takes place in several African or transition countries. During the Suharto’s regime one knew who to contact and how much to pay to obtain a particular favor. Furthermore, and perhaps as importantly, once a bribe was paid to the right person those who paid the bribe could be assured that the terms of the implicit contract would be respected. Nobody would come along and demand a new bribe. Therefore, some form of assurance followed the payment of the bribe. In some corrupt countries the price of corruption is not well known ex ante and there is less certainty on whether the implicit contract will be honored. Other officials might step forward and also demand additional payments or the person receiving the bribe might renege on the promise. An intriguing question is why the rate of growth of China has not slowed down in spite of the still widespread corruption. This book by Arnone and Iliopulos provides a fascinating sur-
presentazione.qxd
22/05/2007
© 2007 Vita e Pensiero
FOREWORD
8.19
Pagina
IX
IX
vey of the now large and growing literature dealing with corruption. Some of this literature is well-known. Some is less so. The great merit of this book is to bring to the reader a huge amount of literature in a highly reachable way. The authors themselves have contributed to this literature. Until the 1990s the writing on corruption had been largely theoretical or anecdotal. In more recent years there has been an explosion of empirical studies that, using recently developed survey data on corruption, have tried to establish empirically-based relationships between various measurements of corruption and several important economic variables. Corruption can never be measured directly for a whole economy. In fact it is not even clear what one would measure: number of acts of corruption? Number of bribes paid? Number of people involved? Amount of bribes paid? Thus the measures are generally and inevitably indirect. They often refer to “perceptions” or “impressions”. One could question the extent to which “perception” of corruption reflects the reality of corruption. And one could question how comparable, across countries, or across time are data based on country surveys. Nevertheless the new data, though “soft”, have been widely used and have proven useful in allowing scholars to do empirical work and to draw important lessons from their analyses. This book by Arnone and Iliopulos report on many of these studies thus providing a comprehensive picture of the ways in which acts of corruption can damage economic activities and even political systems. The economic literature of the past few decades has stressed the role that clear and firm economic rules play in market economies. It has stressed that, over the long run, market performance can be damaged by the absence of firm and shared rules. Corruption has the effect of bending and distorting the existing rules making them more flexible for some individual than for others. Inevitably this has an impact of distorting competition. It eliminates the possibility of a level playing field in which individuals and enterprises can compete fairly. Thus, corruption leads to economic inefficiencies and raises questions about the fairness of the outcome. When corruption is prevalent, property rights are not firmly established, rules are not universally enforced, and prices no longer contain the traditional full information attributed to them
presentazione.qxd
© 2007 Vita e Pensiero
X
22/05/2007
8.19
Pagina
X
VITO TANZI
by economists. They no longer send the necessary and useful signals that should guide market decisions. Corruption changes the outcome of economic activity favoring the corrupt over the efficient. Corruption and not efficiency select the winners. Corruption may also act as a regressive tax by especially retarding the creation and the growth of new and small enterprises that have less political power to protect themselves against corrupt public officials. Corruption also distorts the allocation of talent because, in a corrupt society, talented individuals tend to channel their energy and to choose rent-providing activities where corruption may be the main ingredient for success. The damaging impact on growth associated with this misuse of talent has been shown for some countries. Using the available empirical data on corruption the book shows that over the long run more corruption is associated with less economic growth. Therefore, it leads to lower per capita incomes in more corrupt countries. Some may question the direction of the causation – whether it is low corruption that leads to high income or high income that leads to low corruption. This is the frequent problem of cause and effect that is common in Economics. However, most economists would favor the conclusion that corruption has a retarding effect on growth because it distorts incentives and reduces the positive impact of rules. Corruption corrupts institutions such as the legal system, the tax administration, the police, the judiciary and so on. Other specific reasons have also been mentioned, such as the effect especially on small and new enterprises and on the allocation of scarce talent among the many possible uses. But there are additional reasons that have been highlighted by economists. For example, there is strong empirical evidence that corruption makes investment more risky, increases the cost of finance, discourages foreign direct investment, encourages unproductive and wasteful public investment, and promotes inefficiency in other ways. All these consequences are likely to lower a country’s rate of growth. In a globalized world, corruption, like infectious diseases, can spread and can be exported through the bribing of foreign officials. Bribes replace bacteria or viruses as the agents for spreading this disease. Some countries appear to be more effective than others at exporting corruption. Likewise, some countries seem to be
presentazione.qxd
22/05/2007
© 2007 Vita e Pensiero
FOREWORD
8.19
Pagina
XI
XI
more predisposed than others at importing it. Like viruses, corruption finds at times good conditions for spreading. This raises the important question of whether globalization has had the effect of bringing good habits to corrupt countries or bad habits to countries that had not been particularly corrupt. As it takes two to tango, it is pointed out that acts of corruption can initiate from offers of bribes, presumably by foreign companies, or from request for bribes, by local officials. Officials from developing countries tend to stress the impact that bribes offered by enterprises from rich countries have on their countries. They point the finger at the representative of enterprises from rich countries that offer large bribes to poorly paid local officials. In their view, the blame must go to those who offer the bribes. Officials from advanced countries insist that the problem starts with the requests for bribes. They point out that without the payment of bribes they are cut out from particular investment or activities. The book addresses the question of what the international community could do about this problem. Some international organizations (OECD, OAS, and others) have developed conventions against corruption and have asked countries to ratify them. Less corrupt countries have been quicker in doing so. These conventions are largely statements of good intentions. However, it is still an open question whether these diplomatic agreements or conventions have much of an impact “at the micro level” on the behavior of individuals. Does the signing of these conventions change the behavior of bureaucrats, other government officials, and representative of enterprises? It has been reported that at times the top managers of enterprises promise to stamp out corruption in their dealings with foreign countries while employees further down the corporate ladder continue with the practice. There is statistical evidence that, with few significant exceptions, corruption persists over time in the sense that the relative positions of countries in the indices of corruption and the indexes that they receive do not change much over the years. The coefficients of corruption are highly correlated over time. This of course, should not be a reason for abandoning the effort to fight corruption. Rather, it should be a reason for intensifying that effort. The fight against corruption requires actions on many fronts including the improvement in the quality of the supervi-
presentazione.qxd
22/05/2007
8.19
Pagina
XII
XII
VITO TANZI
sion over the financial sector, the banking systems, the bond market, the insurance market and, naturally, the tax administration and budgetary activities. It requires the strengthening of institution and the application of reasonable penalties. It also requires good examples from the political leaders. It is a sad development that the political institutions, including legislators, continue to be reported to be the most corrupt. To conclude I hope that this interesting and useful book will attract the attention that it deserves and will contribute in some way to the fight against a social disease that continues to damage economies and societies.
Vito Tanzi
© 2007 Vita e Pensiero
Washington DC, 8 March 2007
Back to the Summary
ringraziamenti.qxd
22/05/2007
8.19
Pagina
XIII
© 2007 Vita e Pensiero
AKNOWLEDGEMENTS
We wish to express our gratitude to two well-known scholars of corruption in their respective fields of law studies and economics: Gabrio Forti, Professor of Penal Law and Criminology at the Catholic University of Milan, and Vito Tanzi, formerly at the International Monetary Fund, and currently at the InterAmerican Development Bank in Washington DC, for writing the Introduction and the Foreward, respectively. This book, initiated when one of the authors, Marco Arnone, was working at the International Monetary Fund, draws mainly from both fields. Marco Arnone wishes to thank colleagues and friends of the multilateral institutions for the opportunity to exchange views on the issues raised here, specifically: Tomás Baliño, Luca Bandiera, Leo Bonato, Tito Cordella, Salim Darbar, Stefania Fabrizio, Hervé Ferhani, Felix Fischer, Edward Gardner, Sami Geadah, Edward Gemayel, Eva Gutierrez, Bernard Laurens, Alfredo Leone, Elisa Liberatori, Alessandro Magnoli, Gamal El-Masry, Gian Maria Milesi-Ferretti, Maria Luz Moreno-Badia, Mark Plant, Alessandro Prati, Parmeshwar Ramlogan, Alessandro Rebucci, Andrea Schaechter, Silvia Sgherri, Piero Ugolini, Laura Valli, Maria Vagliasindi. Their dedication and and high professional profiles have been a great source of inspiration during the Washington years. As this book shows, these institutions are key players in the global fight against corruption and money laundering, and in implementing global economic and institutional policies to eradicate the “pathologies” highlighted in this book. Among the many colleagues and friends whose advice and encouragement has been of great importance to us, we wish to thank: Maurizio Baussola, Carlo Bellavite Pellegrini, Luigi Campiglio, Giuseppina Malerba, Marco Mazzoli, Vito Moramarco, Maurizio Motolese, Laura Solimene and Franco Timpano (all
ringraziamenti.qxd
22/05/2007
8.19
© 2007 Vita e Pensiero
XIV
Pagina
XIV
AKNOWLEDGEMENTS
Catholic University - Italy); Sandra Marcelino, Patricia MendozaIbarguen, Martha Silva de Berta, Lucy Yepez (all IMF), Maurizio Agnello (Prosecutor’s Office of Palermo), Paul Acquah (Central Bank of Ghana), Aydin Akgun (US Treasury), Marco Arrighi (BNL), Eliana Baici (University “A. Avogadro”), Carlo Battiston (National Cancer Institute, Milan), Luigi Bonatti (University of Trento), Carlo Borzaga (University of Trento), Stefano Bosi (University of Lille – France), Michele Cà Zorzi (European Central Bank (ECB), Martin Cahjtaml (International Academy of Philosophy – Liechtenstein), Michelle Chan (University of East London – UK), Bruno Chiarellotto (University of Padua), Stefania D’amico (Federal Reserve Board, Washington DC), Eloisa Detomi (University of Padua), Stefano Eusepi (Federal Reserve Bank of New York), Riccardo Faini (University of Rome “Tor Vergata”), Andreas Fuentes (OECD), Rosa Gini (Regional Agency for Public Health of Tuscany), Gerald Grisse (ECB), Carlo Mario Guerci (University of Milan), Stefan Ingves (Central Bank of Sweden), Omar Lakkis (University of Sussex - UK), Linda Lubrano (American University – Washington DC), Detlev Mares (University of Darmstad - Germany), Vincenzo Mazzaferro (National Cancer Institute, Milan), Chiara Melloni (University of Milan), Marcus Miller (University of Warwick - UK), Christiane Nickel (ECB), Marco Nicosia (Cisco Systems), Pier Carlo Padoan (University of Rome “La Sapienza”), Maurizio Parton (University of Pescara), Rosaria Petrolà (Palermo Bar Association), Barbara Roffia (ECB), Marco Romito (University of Firenze), Lorenzo Saà (UNIDEA - Unicredit Foundation), Antonio Scalia (Bank of Italy), Eugenio Villa (San Raffaele Hospital, Milan), Giordano Vitali (San Raffaele Hospital, Milan), Daniel von Wachter (University of Munich - Germany), Enrico Zaninotto (University of Trento), the Centre for Macroeconomics & Finance Research (CeMaFiR - Milan) staff: Jean-François Segalotto, Alessandro Gambini, Elena Dozio; and, finally, our publisher at the Catholic University of Milan, Aurelio Mottola. An extra special thank to Anthony Turner, who also helped proofreading the text, Marc Martin, Martin Sommer, Jenny Hevya, Josephine Fontana, and Alessandro Zanuso for their wonderful support. Back to the Summary
introduzione.qxd
22/05/2007
8.19
Pagina
XV
INTRODUCTION
Out of harm’s way
© 2007 Vita e Pensiero
Education ‘widely diffused throughout the nation’ as ‘the surest’ way to prevent corruption As remarked by Marco Arnone and Eleni Iliopulos, among the various researches and analyses on corruption built up in the last years there was hardly a work focusing, from an economic perspective, on the costs of this most damaging wrongdoing. From the standpoint of a criminal lawyer, used to look at economic studies with great curiosity but also with a bit of cautionary attitude towards the overflow of numbers exhibited as main if not exclusive gauge to evaluate complex social phenomena, the effort gone to fill such gap is a quite relieving surprise. While in the field of corruption (as in many other areas), qui incipit numerare, desinit cogitare, (he who starts counting, stops thinking) the book very early incipit cogitare (starts thinking) and thus, numerat et cogitat (counts and thinks). This feature, besides making the research a robust contribution to the understanding and coping with corruption, also opens a path to fruitful exchanges with those legal disciplines (first and foremost criminal justice) which, in countries like Italy where prosecutors and judges have been particularly active in cracking down on corruption, have almost monopolized the study of the topic. We have thus now a well grounded and documented study properly aware indeed of the wider ethical and legal horizon which makes sense of the huge amount of data presented and discussed, especially in front of the very eyes of non-economic minded scholars or common readers. A study, we could say according to a well-known statement by Ludwig Wittgenstein, guided by that ethical “ceiling light” which must filter through in order that any factual account (inclusive of huge numerical data) maintains its sharp edge and especially its ability to distinguish and grade the relevance of data. Such light prevents also the reader from being distracted or even swallowed up (as it happens more often than
introduzione.qxd
© 2007 Vita e Pensiero
XVI
22/05/2007
8.19
Pagina
XVI
GABRIO FORTI
not to politics, mass media and public opinion) by a topical matter which hideously and sneaky tries to attract in its confusing tangles and thus to pervert minds and alter understading of real values at stake. The comfortable overall ethical and somewhat legal tone of this book is perceived just from, but well beyond, the aptly chosen epigraph, which quotes from Cesare Beccaria’s, the Enlightenment Italian legal reformer, On crimes and punishments1. Suffice it to say that one of the mainstays of this masterpiece of legal thought was the statement that “the true measure of crimes” is “the harm done to society”: “this is one of those palpable truths which, though requiring neither quadrants nor telescopes for their discovery, and lying well within the capacity of any ordinary intellect, are, nevertheless, because of a marvelous combination of circumstances, known with clarity and precision only by some few thinking men in every nation and in every age”. The simplicity as well as sharpness of such a statement lies in the apparent oxymoron it seems to convey. To measure, weigh, crimes and their seriousness, we cannot simply consider sheer numerical data but must grasp their overall meaning in terms of harmful effects on human values, namely on social qualities, as such slippery to a mere quantitative grip. Aptly then the book by Arnone and Iliopulos makes clear from the beginning how a discussion of corruption effects must be always aware that this crime is the most pernicious where its costs are the most difficult to calculate, namely when it erodes or destroys primary social values and interests. Corruption activates a vicious spiral which deeply undermines legal and political institutions and, if not countered at an early stage through heavily muscled reform policies, brings about an irreversible decay of economies and whole countries. The reader is hence guided through a wide mapping of the negative effects of corruption: the harm done to the markets, the rules which sustain them and the ability of supervisory/regulatory authorities to ensure their enforcement; macroeconomic costs; political-institutional and social costs; governance and, last but not least, all high prices paid by citizens in their daily lives as slow1
All translations are drawn from C. BECCARIA, On Crimes and Punishments, translated by Henry Paolucci, Macmillan, New York, 1963.
introduzione.qxd
22/05/2007
© 2007 Vita e Pensiero
INTRODUCTION
8.19
Pagina
XVII
XVII
down of societies growth due to corruption impacts massively on public resources and, similarly, on the quality of institutions, which is a decisive factor for policy choices on social services. Finally, the book analyzes the role of international and multilateral institutions in defining a global agenda against corruption, which stems from a widespread awarenss of the economic and political disruption that corruption is bound to cause on the international stage. As indeed solemnly stated in the Preamble of the “United Nations Convention against Corruption” (open to all countries for signature since 9 December 2003), this crime is a matter of concern “about the seriousness of problems and threats” that it poses “to the stability and security of societies, undermining the institutions and values of democracy, ethical values and justice and jeopardizing sustainable development and the rule of law” The “field” of corruption, either in the crude Machiavelli’s “effectual truth” of things or in theoretical analyses or in the minds of policy makers, in spite of its enormous impact, is however quite elusive: it sets obstacles in the way of whatever approach may be chosen to understand and grasp it and especially to throw light on its many obscurities. It escapes easily the efforts of any “land surveyor” K. who, “from the village” far removed from Kafka’s “Castle” where the arcane network of illegal exchanges are secretly woven, would attempt to ascend to it and understand its workings. First and foremost we could say that such elusiveness is inherent in the corrruption of language that the diffusion of this crime is bound to bring about. In a social and political environment marred by systemic corruption, the meanings of words become confused as they lose the ability to connote actions and things. Words become misty and interchangeable, just in the way corrupted acts, offices and persons do. If words bring with them always something sacred, corrupt practices profane and convert them into the vilest of coins, with deep consequences whenever such corruption of speech affects the language used by those (politicians, lawmakers, administrators) who should account for their deeds towards citizens and electors, as their confused wording hinders listeners and readers to check and hold them responsible for what they exactly say. As amply documented in many
introduzione.qxd
22/05/2007
© 2007 Vita e Pensiero
XVIII
8.19
Pagina
XVIII
GABRIO FORTI
cases, the practice of corruption hides itself behind a well concocted jargon which not only makes up the lexical counterpart of the devious means put in effect to dissimulate the illegal exchanges of favours, but has in itself detrimental effects on the cultural environment, as such jargon infects the common language, presenting corruption as an ordinary, even beneficial, business and political practice. It is not rare to see such word usage coupled with an appeal to look at things with “sound” realism or pragmatism, devoid of a moralism which is dubbed as “old fashioned” or even “adverse to progress”. We see here showed off one of the specimens of that Realpolitik, especially disdainful of moral indignations, which, as remarked by André Glucksmann, are the pride of late-modern ruling classes but probably also the source of the massive debacles these same rulers are heaping up in the last years while dealing with global problems and risks. Corruption is quite elusive, as the authors of the book remind us in the overview chapter, as it is a multi-faceted phenomenon, even more so when it is so deeply rooted to be considered “normal”: its elusiveness stems just from the multiplicity of aspects that mark it and from the difficulty to distinguish it from other kind of illegal acts or even from behaviours which are borderline but still legal. At the core of such elusiveness (which then is a major hindrance also for scholars and researchers) lies moreover the difficulty of identifying the causal direction of the dynamics on which it is based, as its causes and effects are strongly interconnected with feedbacks that can hardly be isolated: the “effects” negatively influence their “causes”. Well-known to all researchers is such “circularity” of corruption which also explains as well as contributes to his highly harmful effects. This feature is a sort of key to the “genetic code” of this crime, being tightly connected to its nature of illicit exchange of favours and to the fact that what is touched by corruption - person, act or value - is bound to be transformed into sheer “sale goods”. As corruption spreads out in politics, administration and business, this same fact is the cause for its further and deeper and wider spreading out, for its extension and reproduction. Other than upon the essential feature of corruption, as growing from and aiming at an exchange of “goods”, the circularity of this crime depends upon the kind of values it is bound to destroy or
introduzione.qxd
22/05/2007
© 2007 Vita e Pensiero
INTRODUCTION
8.19
Pagina
XIX
XIX
at least put in a predicament. Values which not only are among the highest and most cherished by any society, but whose integrity also is the main guarantee that other worthy rules and principles keeping society together are effective. One main effect of corruption is then to mutually stimulate supply and demand of kick-backs, gradually pushing honest people out of the system. The loss of confidence in the impartiality of the administration undermines the ethical basis of the community, encourages people to breach the social contract and diminishes the incentives to develop a reputation of honesty in the industry. Moreover expansion of crime, namely the sheer increase of the number of corrupt people, makes the opportunities for corruption the more enticing, as it reduces the risk of being identified and reported. Corruptions replicate according to a “horizontal” as well as a “vertical” dynamic. As to the horizontal expansion, it takes the form of a general increase of the same or related crimes: corruptions, often generated by other crimes, in turn originates more corruption and more crimes. Some instances of this dynamic is the support organized crime gets from corruption and vice versa, as well as the expansion of bribery beyond national boundaries. On the other hand, corruption proliferates vertically, from top to bottom and from bottom to top as well, weaving a tight and wide network of complicities at various levels of the political, administrative and economic life and disrupting any social hierarchy based on real consensus, merit and ability to sustain competition Such tendency of corruption to replicate itself seems to fit Gregory Bateson’s fundamental ideas of cybernetics, which have circularity as their central concern, though, as Bateson pointed out, circularity did not mean a precise circle in which events repeat themselves in the same circular path. The behaviour of all corruption “actors” is determined indeed by a constant worry about the flow of information circulating inside and outside the illegal system they have built. The stability of such system, namely the ability to correct itself and adapt to change, is mainly dependent upon the differential between a high degree of transparency and foreseeability inside the network of corrupted relationships and the maximum of invisibility to those who are excluded from it or could intervene from outside as disturbing or controlling
introduzione.qxd
© 2007 Vita e Pensiero
XX
22/05/2007
8.19
Pagina
XX
GABRIO FORTI
agents. Secrecy, namely opacity of corruption, doesn’t make up simply one of its many equally relevant features, but is most typical of it and thus the prerequisite for its inception and spreading. Any analysis of corruption cannot help regarding its hunger for secrecy, which usually frustrates most attempts to prosecute it effectively and is related to the mutual interests of bribers and bribees to keep concealed a transaction so profitable for both as well as to the great sophistication and complexity such illicit practices have achieved in the modern world. Systemic corruption, thriving in the dark, brings about new systematic corruption which easily absconds from justice. All strategies aimed at apprehending (in all meanings of the word) as well as at breaking the vicious spiral of corruption should therefore invert such informational equilibrium so vital to its maintenance, growth and diffusion. We must be aware however that obscurity of corruption is greatly deepened by a widespread public understatement of the seriousness of this crime, often presented by media and politicians as a minor, customary wrongdoing if compared to the “real” threat posed by street crimes. This image of corruption, also linked to the terminological confusions inherent in the concept, which actually encompasses acts quite differently harmful to social values, has a gradual but deep effect on the public perception of this problem and the consequent low readiness to press policy makers for adequate preemptive and punitive measures. It is one of the many paradoxes of corruption that the more it falls under public eyes (as in The Purloined Letter, the well-known short story by E.A. Poe, object of an acute interpretation by Jacques Lacan) the more it defies understanding and suffers a devaluation of its seriousness, thus threatening, in the most slippery and deceitful way, public and private life. As a result we could say that the deep, sometimes even abysmal harm caused by corruption, just due to its ubiquity and all-pervasive influence, actually fails to be fully grasped by society. This is reflected in the agendas of policymakers (e.g. in Italy during the last few years), where the problem of corruption has ceased to be a top national priority in spite of recent shattering experiences, e.g. the decade of the so-called tangentopoli scandals, lit. the “city” (better the polis) of kickbacks: a dangerous downgrading which not rarely is shrugged aside by mostly indifferent
introduzione.qxd
22/05/2007
© 2007 Vita e Pensiero
INTRODUCTION
8.19
Pagina
XXI
XXI
(or made indifferent by carefully orchestrated media campaigns) public opinions, obsessed or made obsessed by more colourful and noticeable fears. In spite of the common view that street crimes and terrorism pose the most formidable threat to our lives, vulnerability and uncertainty are largely engendered by the development of a negative globalization that has made it almost impossible to find a reasonable balance for human obligations within the framework of the nation-state. As remarked by the sociologist Zygmunt Bauman, the retreat of the social state, while governments are calling for more flexibility in the labour market and in all other areas of life regulated by market forces, brings a huge burden of insecurity in the daily lives of citizens. In this background of muffled but pervasive fear, feelings of insecurity are further stirred up by the conditions of what Arnone and Iliopulos deem a primitive and archaic idea of the market, which favors the interests of those who know the rules of a game and of the social sectors where there is a concentration of power and money, irreparably disadvantaging those who have no access to information in the hands of a close élite, nor sufficient capital to pay bribes, nor hold strategic positions. “The insider-outsider structure that comes to be inevitably determined results in vicious circles that tend to favor stronger strata of society, who have access to large resources or hold strategic positions. In both cases, insiders have access to resources that outsiders are denied (outsiders are those individuals lacking personal ‘connections’, access to exchanges of favors and benefits). We may hence assume that one main characteristic at the basis of corruption dynamics consists precisely in the disparity of conditions faced by different economic actors. Given different initial conditions and ‘rules of the game’, income distribution reflects the same rules that originated it; stronger actors have access to larger reources while weaker actors are excluded”. These conditions are the exact opposite of a market consisting “in a set of rules, institutions and agents that interact mutually to achieve efficiency in the management of resources” and thus correctly functioning on the basis of efficient regulations and correct supervision. Among the most enduring harms caused by corruption there is more than solely a distortion of market rules: it really nullifies the very same idea of market, which doesn’t simply
introduzione.qxd
22/05/2007
© 2007 Vita e Pensiero
XXII
8.19
Pagina
XXII
GABRIO FORTI
need rules, it is such rules, as pointedly remarked in the book. The undermining of market and its inherent rules is harmful not only to economy, but to all institutions and even to the legitimacy of state authority. Instead of securing its obligation to provide protection against insecurity and the fear resulting from it, and to offer citizens a dignified life in exchange for obedience, discipline, and respect for the law, state is being delivered into the hands of distorted market forces an thus it increasingly fails to justify its role and burden. A similar overall tone may be caught in the pages of Cesare Beccaria, where he remarked that “attempts against the security and liberty of citizens are among the greatest of crimes” and “within this class are included not only the assassinations and thefts committed by men of the lower classes but also those committed by noblemen and magistrates, the example of which acts with greater force and is more far-reaching, destroying the ideas of justice and duty among subjects and substituting that of the right of the strongest, equally dangerous, in the end, to those who exercise it and to those who suffer it”. And this, in late-modern societies, is exactly what puts in motion a vicious spiral of fear, as ruling classes and states attempt to gain acceptance emphasizing just those fears on which they can pretend to provide a check. As remarked by the respected mass communication specialist David Altheide, politics use fear to promote their own agendas and the lingering and pervasive preoccupation with fear is exploited by government officials seeking to expand social control and limit civil liberties. Fear also makes people more compliant in seeking help or being “rescued” from formal agents of social control, thus politicians and state control agencies do much to capitalize on this concern and to promote a sense of insecurity and reliance on formal agents of social control and related businesses; even foreign policy and threats of external enemies may be useful to support fear. To this wicked aim, it makes perfectly sense to downgrade the relevance of corruption just while upgrading the seriousness of threats arising from street crimes and strangers. However such attitude of political élites, who apart from any lip-service paid to the evils of corruptions don’t show to really care about the gravity of this crime and how it should require measures especially commit-
introduzione.qxd
22/05/2007
© 2007 Vita e Pensiero
INTRODUCTION
8.19
Pagina
XXIII
XXIII
ted to meet with its special features, further contributes to the loss of citizens’ confidence in the institutions and in the legality. Among the many ingenious ways to culturally play down the problem of corruption, there is its turning into a “matter of numbers”, namely its presentation as a mere pecuniary cost to public resources, easily remedied through an obligation imposed to bribers and bribees to give back their gains. This view entails that corruption is a private transaction, however illegal, which can be encapsulated in the idea of an illicit exchange between two actors and then that its detrimental effects may be compensated through a mere restitution of the illicit profits acquired by the two. The purport this view conveys to public opinion and prospective wrongdoers is however extremely harmful as it patently contradicts if not ridicules the firm awareness of how serious and destructive a crime is corruption, prerequisite for any effective undertaking aimed at rooting it out. Damages may only be paid in compensation for losses inflicted to individuals or society which may be deemed really subject to a definite pecuniary assessment. On the contrary such an assessment is clearly out of the scope of any judicial, administrative or civil law inquiry, as the damage which follows from this crime is not only huge and farreaching, but more often than not unsuitable to calculation. The Italian experience is significant also to this effect, having displayed many cases of public works and entire policies which have been pursued for the sake of kick-backs only; namely works which were by no means needed by the community or were at least less needed than other, but which have been chosen for their profitability to public officials as an easy source of bribes. It would be quite arduous to undertake the task of assessing the real damages these wide scope political and administratve choices have done to a country, given that public officials, ministers or members of Parliament for years or decades may have been able to completely divert towards their own personal or party profit, with incalculable effects, the course of national politics, thus hugely neglecting public interest. All good books gradually merge into the topic they’re depicting: context and text, reality and words become part of the picture to which the reader is thus called to enter as one of the main characters, as such playing a role, finding as well following him-
introduzione.qxd
22/05/2007
© 2007 Vita e Pensiero
XXIV
8.19
Pagina
XXIV
GABRIO FORTI
self/herself one of the paths that the book has pointed at. Hence the word, the logos merges with action, pragma. After having benefitted of the ethical “light from the ceiling”, the book by Arnone and Iliopulos page after page becomes itself a light and sheds a bright light upon a problem which desperately needs all our light and attention to be solved or at least alleviated, as it thrives in the dark. One of the prerequisite for the prevention of crimes, as asserted by Beccaria, could be deemed particularly appropriate with regard to the crime of corruption. “Do you want to prevent crimes? See to it that enlightenment accompanies liberty. Knowledge breeds evils in inverse ratio to its diffusion, and benefits in direct ratio. [...] Knowledge, by facilitating comparisons and by multiplying points of view, brings on a mutual modification of conflicting feelings, especially when it appears that others hold the same views and face the same difficulties. In the face of enlightenment widely diffused throughout the nation, the calumnies of ignorance are silenced and authority trembles if it be not armed with reason”. “Enlightenment widely diffused throughout the nation” means widespread education, as “the surest but most difficult way to prevent crimes is by perfecting education – a subject much too vast and exceeding the limits I have prescribed for myself; a subject, I venture also to say, too intimately involved with the nature of government for it ever to be, even in the far-off happy ages of society, anything more than a barren field, only here and there cultivated by a few sages”. The spreading of knowledge throughout civil society can help to drain those malarial marshes where individuals and institutions are able to abscond from controls, hiding behind a system of rules inaccessible to citizens. Arnone and Iliopulos are very clear in asserting that “to establish accountability of state institutions and bureaucracy, it is necessary that citizens be in a position that they can evaluate their actions”. But if “transparency as a principle becomes a necessary condition at the foundation of a good public governance”, it requires above all citizens and public officials culturally well equipped and motivated to require such prerequisite of good public governance. Whenever citizens are no more able to get the protection of
introduzione.qxd
22/05/2007
© 2007 Vita e Pensiero
INTRODUCTION
8.19
Pagina
XXV
XXV
their rights on services and resources, lack of confidence in the soundness and efficacy of public procedures usually gives rise to a demand for private protection even in the relations between private citizens and public bodies. As a matter of fact the bad weeds of corruption grow much more in the heads than in the wallets, feeding on that “spirit of the family”, as Beccaria would have called it, which is “a spirit of details, limited to trifling facts”, as such contrary to “the spirit that rules republics”, that is “sustained by general principles, observes the facts and classifies them in the order of their importance for the good of the majority”. “Contradictions between the laws of a family and the fundamental principles of a commonwealth are a fertile source of other contradictions between domestic and public morality; they occasion, therefore, a perpetuai conflict in every mind. Domestic morality inspires submission and fear; the other, courage and liberty [...] One commands a continual sacrifice of self to a vain idol, called ‘the good of the family’ (which is often the good of no one of its components. [...] Such contrasts make men disdainful of pursuing virtue, which they find entangled and confused, and at that great distance from them in which all objects, physical as well as moral, appear to be when enveloped in obscurity. How often is a man, looking back on his past actions, astonished at finding himself dishonest!”. We could say that such beccarian “spirit of the family” is addressed by the document of the World Bank, which, as reminded by Arnone and Iliopulos, within the general concept of corruption, distinguishes administrative corruption from state capture, the latter encompassing all illegal actions aimed at influencing the decision making process of policy making in the different spheres of the life of a country. State capture concerns thus all actions exploiting illegal and secret channels, that aim at favoring the interests of specific groups weakening everybody else, and are clearly accessible only to limited group of “insiders” at the expenses of those who are “outsiders” and do not participate in bribery. Just to hold in check policy making and preventing state capture, public opinion, and thus “enlightenment” and education widely diffused “throughout the nation”, is so vital as it assures that the needs of citizens are taken into consideration by the authorities while keeping the latter under scrutiny (thus making
introduzione.qxd
22/05/2007
© 2007 Vita e Pensiero
XXVI
8.19
Pagina
XXVI
GABRIO FORTI
them accountable to their voters). Knowledge and education dismantle the “spirit of the family”, namely makes governance strong enough to prevent episodes of public and private corruption, and counter that mismanagement of markets which generates advantages only for privileged lobbies, to the insiders of the corrupted structure. Along Beccaria’s lines of thought, the book by Arnone and Iliopulos stubbornly sees in the educational and cultural policies one of the starting points for an effective fight against corruption, as “education impacts on corruption: high education levels are associated to good quality politicians and institutions” and “educated and informed citizens can choose good policy makers and monitor their activity and performance”, with “a strong impact on the quality of institutions” and put “effective constraints against bad governance”. One of the paths which should be followed is thus to foster policies aimed at the enhancement of what we could term a widespread “social specialization” of citizens, namely consisting in their ability to act not only as consumers, but also as vigilant and cultured stakeholders in those values which must be preserved by a sound and equal social system. A great encouragement as well as an important legal tool to follow this path has been provided by the already mentioned “United Nations Convention against Corruption”, whose art. 13 especially requires of each state Party to “promote the active participation of individuals and groups outside the public sector, such as civil society, non-governmental organizations and community-based organizations, in the prevention of and the fight against corruption and to raise public awareness regarding the existence, causes and gravity of and the threat posed by corruption”, a participation that should be strengthened by such measures as: “(a) Enhancing the transparency of and promoting the contribution of the public to decision-making processes; (b) Ensuring that the public has effective access to information; (c) Undertaking public information activities that contribute to nontolerance of corruption, as well as public education programmes, including school and university curricula; (d) Respecting, promoting and protecting the freedom to seek, receive, publish and disseminate information concerning corruption. That freedom may be subject to certain restrictions, but these shall only be such
introduzione.qxd
22/05/2007
8.19
INTRODUCTION
Pagina
XXVII
XXVII
as are provided for by law and are necessary: (i) For respect of the rights or reputations of others”. Such a bundle of sensible measures are needed to prevent corruption but, which is more, as Beccaria would have put it and Arnone and Iliopulos have amply showed in their remarkable book, to shape “free and vigorous souls and enlightened minds”, to make “men virtuous with that virtue which can resist fear, and not that of pliant prudence, worthy only of those who can endure a precarious and uncertain existence”.
© 2007 Vita e Pensiero
Gabrio Forti
Back to the Summary
cap1.qxd
22/05/2007
8.19
Pagina
1
© 2007 Vita e Pensiero
The cost of corruption
cap1.qxd
22/05/2007
8.19
Pagina
2
CHAPTER I
© 2007 Vita e Pensiero
Corruption: overview of causes, effects, and policies
The starting point of this book is the general recognition made by both scholars and economists of a strong link between economic dynamics and “institutional pathologies”. Despite the many valuable contributions from multilateral institutions a comprehensive empirical work was not yet available. We therefore decided to lay out a simple but nevertheless precise mapping of costs brought about by those “pathologies” that, in the widest meaning of the word, we define as corruption. Bribery is very expensive. For whom? How expensive? And how far reaching? These are only a few of the questions which arose during discussions with several colleagues and scholars from various fields. Scanning through academic and institutional research, books, and surveys in progress we realised that a contribution from an economic perspective, providing simple and systematic answers to these questions was still missing, although a huge amount of legal studies and journalistic or sociological reports had already been produced. What is the reason for the title used for this book? Very simple: the costs of corruption are some of the most important aspects of this phenomenon; not only the monetary costs but, in the long term, mostly the indirect ones because of the less measurable but destructive consequences on the “intangible goods” of a society: the credibility of the political establishment, the trust in institutions, the texture of civil society, with the related heavy consequences on people’s daily life, as we show in this book.
1. Corruption: definitions and characteristics Corruption is a multi-faceted phenomenon, even more so when it is so deeply rooted to be considered “normal”. The problem
cap1.qxd
22/05/2007
8.19
Pagina
3
© 2007 Vita e Pensiero
OVERVIEW OF CAUSES, EFFECTS, AND POLICIES
3
related to defining it is strictly connected with the multiplicity of aspects that mark the phenomenon and with the difficulty to distinguish it from other kind of illegal acts or even from behaviours which are borderline but still legal. From a very general legal perspective, corruption can be defined as “a deterioration in the decisional process that characterizes all cases where the decider (a private or a public agent) accepts to, or asks for, deviating from the criteria that should lead his (or her) decision for his (or her) private gain; however, the reasons that lead his action cannot justify his decision” (Huber, 2002). This behavioural definition focuses on key aspects of the phenomenon: the concepts of exchange of favours and abuse of power. Since our analysis is based on data collected by Transparency International in this book we follow its definition of corruption: an abuse of public office for private gain. While aknowledging that one of the two parties needs to be a public economic agent, there is no distinction between administrative and political corruption. However, in general the episodes of corruption can involve either one agent (or more) from the public sector and one private agent (or more); or two parts within the private sector. This study concentrate on the dynamics that involve the episodes of bribery between the private and public sector; in this case, corruption does not only affect economic development but distorts the policy making process and its enforcement. Having said that, corruption within the private sector is a significant phenomenon and has recently been the subject of legal studies (see Forti 2003b). The World Bank (World Bank, 2002) makes a distinction between the two1 main types of corruption: state capture and administrative corruption. The latter concerns all public employees’ or public officials’ actions for private gain that distort application and enforcement of existing laws or rules; generally, these actions grant exemptions or tax allowances to specific agents. Alternatively, they are aimed at giving priority access to public services to an élite of agents.
1
We also mention the so called “grand corruption”, which can be defined as public officials’ abuse or the theft of public resources.
cap1.qxd
22/05/2007
© 2007 Vita e Pensiero
4
8.19
Pagina
4
MARCO ARNONE - ELENI ILIOPULOS
The concept of state capture concerns all illegal actions aimed at influencing the decision making process of policy making in the different spheres of the life of a country. Public opinion is an important input for policy making: it assures that the needs of citizens are taken into consideration by the authorities while keeping the latter under scrutiny (and making them accountable to their voters). On the contrary, the concept of state capture concerns all actions exploiting illegal and secret channels, that aim at favoring the interests of specific groups at the expenses of everybody else. These channels are clearly accessible only to limited group of “insiders” at the expenses of those who are “outsiders” and do not participate in bribery. The dynamics of corruption can be either organized centrally, by a single central group of agents inside the institutions, or decentralized throughout the system. Easterly (2002) shows that the number of episodes of bribery tends to increase when corruption is decentralized; however, when the dynamics of corruption are centrally organized, the average value of briberies tends to be larger. We try to identify the peculiar features of corruption and the context in which it grows and spreads out. Once the premises are outlined, we shall concentrate on the analysis of the effects of corruption on civil society, broadly defined. Bribery goes deep into the structures of public administration, limiting its ability to pursue economic and institutional goals; it interferes at the decision-making level by modifying the general goals to the advantage of hidden parties; it compromises plans by thwarting the effective implementation of rules set by the authorities. It also interferes with the decision power of individuals by twisting the principles which lead their actions. The manyfold features that characterize the phenomenon confer to corruption a strong elusiveness. The elusiveness of corruption makes it difficult for politicians to fully understand the complexity of this phenomenon. If, on the one hand, aspects of bribery are clearly recognizable, on the other hand, their most dangerous effects are not directly measurable and lead to the destruction of the “intangible goods” of society. Corruption jeopardizes institutional credibility, legitimacy and image in the forum of public opinion; it encourages illegal
cap1.qxd
22/05/2007
8.19
Pagina
5
OVERVIEW OF CAUSES, EFFECTS, AND POLICIES
5
acts and, therefore, speeds up its own diffusion and enhances a self-reinforcing process.
© 2007 Vita e Pensiero
2. Preconditions for corruption The nature of representative democracies leaves room for the development of episodes of bribery: in order to pursue the welfare of the whole society, citizens delegate the power of the state to other citizens that should represent them and give voice to their needs. These latter agents, however, have also personal private interests; thus, whenever their private interests are “compared” to the public welfare, a conflict of interests can arise. Indeed, thanks to the nature of their position, public officials are in a position that facilitates the fulfilment of their personal interests. A constitution reflects the attempt to constrain the behaviour of public agents and lead them to pursue public welfare. It can also be considered an incomplete contract (Laffont, 2000); indeed, given the “long-term” nature of laws, in a context of limited rationality and evolving social organizations, not all aspects of the life of a state can be codified a priori. The residual aspects are thus left to the discretion of public agents. However, their action is limited by the supervision of the judiciary and by the control of citizens via the electoral process and public opinion. The degrees of freedom of public officials are at the root of possible conflict of interest: the more space is left to discretion, the more conflict of interest may arise. Therefore, if conflict of interest is not controlled and limited, a breeding ground exists for the spreading of episodes of corruption. Economic literature describes a whole set of conditions which constitute breeding grounds for episodes of corruption; it is concerned with those factors which, given agents with the same moral standards, encourage this kind of behaviour. Corruption spreads in those areas of discretion characterized by strong concentration of political and economic power given to public officials. For instance, too large areas of discretion are at the root of the episodes of bribery that affect the process of public spending. Indeed, if the process is characterized by conflicts of interest,
cap1.qxd
22/05/2007
8.19
Pagina
6
6
MARCO ARNONE - ELENI ILIOPULOS
decisions could be directed towards private gains instead of welfare considerations. For instance, tenders for public infrastructures involve large amounts of money. They represent an important source of profit for private agents; when systems are corrupted, tenders are often linked to the payment of bribes. In turn, wrong motivations lead to unproductive investments; to have an idea of the effect of decisions led by corruption instead of public welfare, one can think of investments with useless features (the so called “white elephants”) or infrastructure placed in non-strategic locations (the so called “cathedrals in the desert”). Similarly, one of dimensions of public activity where discretion is most critical is tax collection; in particular, empirical evidence (Tanzi, 2002) shows that the more complex the tax system, the more the episodes of bribery. In addition, the more the collection of taxes allows for contacts between citizens and tax collectors, the more briberies. Indeed, the possibility to have contacts with the citizens gives tax collectors some bargaining power. It should be noted that fund-raising activities that are aimed at influencing policy making are not per se classifiable as bribery 2. Insider-outsider dynamics arise only whenever the tools to raise funds and the channels used to affect political decisions are secret and illegal, and thus only accessible to a group of insiders.
© 2007 Vita e Pensiero
3. Governance Corruption is mostly characterized by the difficulty of identifying the causal direction of the dynamics on which it is based; causes and effects are strongly interconnected with feedbacks that can hardly be isolated: the “effects” negatively influence their “causes”. The attempt to isolate causes from effects should be understood in the light of the strong limitations imposed by the presence of multidirectional causal chains. Cause and effect are recog-
2
One can think of lobbying activities. In the United States, the activities of lobbies are regulated, (are or should be) transparent, and accessible to all those who share common interests.
cap1.qxd
22/05/2007
8.19
Pagina
7
© 2007 Vita e Pensiero
OVERVIEW OF CAUSES, EFFECTS, AND POLICIES
7
nized as such according to the predominance of the causal direction which empirical literature usually ascertains through econometric analysis. Empirical literature recognizes governance variables as the main ones in the causal link to corruption. The actual spreading of corruptive episodes depends on the qualitative characteristics of governance. Good governance minimizes the conflict of interest and areas of discretion (necessary pre-conditions to make corruption possible); sets effective rules, creates reliable institutions and also sets in place an effective system of prevention, control and punishment of deviant behaviour. In this context, prevention of conflict of interest needs to be considered as a fundamental step towards prevention of corruption. Keeping all other factors fixed, the level of domestic corruption is inversely related to the effectiveness of controls and punishment of episodes of bribery. Clearly, the larger the probability of being punished, the lower the number of episodes of corruption. Notice, however, that if on the one hand the number of illegal acts decreases, on the other hand, the amounts per bribery may increase (Rose-Ackerman, 1997); an increase in the probability of punishment is associated with an increase of the opportunity cost of bribery. Therefore, agents who offer or accept bribes need to be rewarded by larger benefits. Indeed, while accepting an illegal transaction, each agent maximizes his or her utility associated to the illegal transaction taking into account the related risks. Finally, the allocation of risks and benefits among agents depends also on their bargaining power: the more powerful the agent, the larger their benefit. If governance is not strong enough to prevent episodes of public and private corruption, markets are dominated by distortions and inefficiencies; in turn, the mismanagement of markets generates advantages only for privileged lobbies, these being the insiders of the corrupted structure. The incentive to join these lobbies weakens governance more and more. Besides loosing competitiveness, corrupted markets do not attract international capital flows and are marked by low growth (due to additional barriers to entry and the risk to investment caused by corruption). Corrupted countries are at a disadvantage compared to others: just consider that corruption not only reduces public revenues,
cap1.qxd
22/05/2007
© 2007 Vita e Pensiero
8
8.19
Pagina
8
MARCO ARNONE - ELENI ILIOPULOS
but also has a negative impact on allocative decisions. A corrupted government does not allocate public revenues according to a project’s qualitative features, but is heavily influenced by relationships based on patronage. Public investments are then characterised by low productivity which, in turn, compromises growth. Finally in countries marked by pervasive corruption, governments tend to reduce public investments in education and health. It is consequently a truism that corruption impacts markets, and the dynamics of public bureaucracy jeopardise the fulfilment of the primary needs of the people. Corruption compromises the standard of health and human development of citizens, via the impact on investment in public health and education; cutting expenses for education, cultural standards of a country drop, and this has a devastating effect on the quality of governance: less educated citizens are inevitably less conscious voters, penalized by a weakened ability to influence the political course of the country. The negative feedback on the quality of governance is then evident. In this book we show how the most probable causes of corruption are aspects of governance, given specific “environmental” factors. We also show how corruption impacts as a monetary burden on society; these costs not only degrade the standard of people’s daily life, but also become a catalyst that strengthens corruption dynamics. Economic costs, such as lack of competitiveness and reduced growth, do impact on the quality of the governance because of their influence on institutions. Further on in the book we highlight how the complexity of transmission channels set in motion by corruption affect the social sphere of a citizen’s life; economic costs of corruption as a whole tend to dry up public resources and impact negatively on the quality and quantity of social services. Among the so called social costs of corruption we pay special attention to the general restriction of public expenditure for education; we show how the decay of educational standards and other social services is strictly connected with both reduced human development and the triggering of a vicious cycle which degrades the quality of governance and increases monetary costs.
cap1.qxd
22/05/2007
8.19
Pagina
9
9
OVERVIEW OF CAUSES, EFFECTS, AND POLICIES
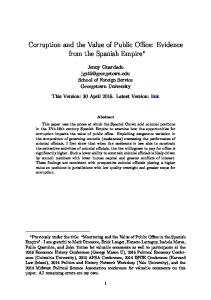
Governance
Corruption
Economic costs (direct measures)
Social-institutional costs (indirect measures)
The chart depicts the economic and social effects of corruption. The solid arrows indicate the main causal direction, from governance to corruption, from corruption to economic costs (direct measures) and social-institutional costs (indirect measures). The broken lines reveal the feedback-effects, which turn out to be weaker in comparison with the main causal relations.
© 2007 Vita e Pensiero
4. Structure of the book This book is an attempt to provide the widest mapping of the negative effects of corruption, in particular we try to measure some of the economic, institutional and social costs. Many of the relationships that we are going to present are the results of a wide review econometric literature, while others represent a suggested path for further considerations. In this work we shall deepen the manifold aspects that mark bribery, not only taking advantage of the existing empirical evidence, but also showing brand new data for the financial sector, mostly related to antitrust and financial regulation/supervision authorities. Besides the strict economic aspects this book also presents the institutional, political, and social costs of corruption. In chapter 2 we show the strong links between rules and markets, and analyze the impact of corruption on them. A market is made of a texture of relations between agents within a context of common rules. As a matter of fact, competitive markets grant effi-
cap1.qxd
22/05/2007
© 2007 Vita e Pensiero
10
8.19
Pagina
10
MARCO ARNONE - ELENI ILIOPULOS
ciency only under specific (and mostly ideal) conditions. Supervision and regulation of markets, under the responsibility of supervisory/regulatory authorities, are prerequisites for efficient market functioning as they enable prevention of dangerous effects of market failures and the spreading of anticompetitive activities and behaviour. If “control institutions” are not in line with their tasks, conflicts of interests will be probably managed incorrectly. This will breed corruption and weaken competitive market dynamics. The analysis is developed through a series of indicators that measure the additional expenses of enterprises, mostly small and medium-sized, impacted by corruption. In chapter 3 we shift our focus to countries and will take into account the macroeconomic costs. In this context we present some specific measures related to macroeconomic costs of corruption with the support of empirical evidence. Among these measures we highlight the positive relationship between interest rates (the cost of money for companies and citizens) and the level of corruption of a country: we specifically indicate the changes in interest rates following a unit change in the level of corruption. In the long run, the final effect of corruption on the economy as a whole has a negative impact on growth. In the following two chapters we present the analysis of political-institutional and social costs of corruption. These costs have indirect but nevertheless relevant effects. Chapter 4 is structured from specific to general: we present an analysis of the standards and quality of regulatory and supervisory institutions in financial markets, and their degree of transparency in the pursuit of their institutional goals. Herewith we specify the characteristics that these institutions must have to accomplish their tasks credibly and efficiently; these authorities need to be fully independent, autonomous and competent de jure and de facto. Independence from governments and political power is essential to minimise the risks of interference with markets and financial institutions for political purposes. Autonomy has a three-fold characterization: goal autonomy, within general institutional objectives; instrument autonomy, to use and tune policy instruments according to the different market conditions and the needs of the supervised organizations; financial autonomy, to avoid interference from other institutions in the resource allocation, which could constrain the behaviour of the regulatory/supervisory authority.
cap1.qxd
22/05/2007
8.19
Pagina
11
OVERVIEW OF CAUSES, EFFECTS, AND POLICIES
11
© 2007 Vita e Pensiero
Competence consists of a set of professional and technical skills and specific experience that enable the authority to have a “dialogue” with market participants, understanding and supervising their behaviour. At the same time the activity of these authorities must be in line with the principles of accountability and transparency. We investigate governance, which impacts the highest political institutions, namely government and parliament. Mismanaged discretionary powers, unresolved conflict of interest, and concentrations of economic and political powers are areas where public institutions can get easily involved in degenerative behaviours. High levels of corruption increase the incentives to create institutions and rules which ease the acquisition of illegal revenues within the context of patronage-based relations. Inadequate safeguards of markets substantially contribute to the deterioration of institutional and political life, and therefore of the quality of a democracy; the institutional analysis presented is based on extensive data that helps the reader to gain an understanding of the transmission mechanism of corruption. Citizens’ life is influenced by the economic and institutional life of a society through strong transmission channels; when corruption is widespread, citizens’ daily life is strongly impacted (chapter 5). The fact that society suffers a slowdown in growth impacts massively on public resources. Similarly, the quality of institutions is a decisive factor for policy choices on social services. Through a social approach we try to measure some tangible social effects which are connected, albeit indirectly, with corruption; and show a whole set of negative social conditions, which, even if not directly connected to corruption through strong causal links, can be found in economies characterized by pervasive corruption. Finally, in chapter 6 we analyze the role of international and multilateral institutions in defining a global agenda against corruption.
5. The data The empirical evidence presented to the reader makes use of some indicators commonly utilized in the empirical literature. Economic analysis makes use of standard indicators like Gross
cap1.qxd
22/05/2007
8.19
12
Pagina
12
MARCO ARNONE - ELENI ILIOPULOS
Domestic Product (GDP), interest rates and competitiveness indicators. Institutional analysis, on the contrary, is based on more recent empirical evidence that in part makes use of indicators of governance already accepted worldwide3, some of which have been originally introduced by the World Bank. In the course of this book we also define new indicators, specifically related to regulators and supervisors of financial markets. The indicator of corruption used here is the Corruption Perception Index (CPI) published and periodically updated by Transparency International (TI). This indicator has become a starting point for empirical studies on corruption and should be considered a proxy of generally perceived corruption. The CPI indicator evaluates the level of perception related to domestic corruption. Its reliability, internationally acknowledged, is due to the fact that this index is the result of components taken from different sources and appropriately weighted. The fact that the CPI is based on “perceptions” collected from “experts” should not be considered as limiting the reliability of the tool. Experience and perception of economic actors are indeed extremely important, mostly for expectations related to economic variables; these perceptions do influence investment decisions, the level of credibility of institutions and the level of citizens’ satisfaction. Details on other variables are provided in Appendix II.
© 2007 Vita e Pensiero
6. Policies The complex causal structure on which corruption is grounded must be reflected also in the policy approach to the problem. Via its effects on society corruption can generate those conditions which strengthen its structure and make it spread deeply and widely.
3
Regarding the indicators of governance used here and in the empirical literature, there is an ongoing academic and institutional debate on how to improve them and limit some of their shortcomings; for further discussion see Adcock and Collier (2001), Munk and Verkuilen (2002) and Munk (2003).
cap1.qxd
22/05/2007
8.19
Pagina
13
© 2007 Vita e Pensiero
OVERVIEW OF CAUSES, EFFECTS, AND POLICIES
13
All factors that represent an incentive for the spreading of corruption implicitly tell us what remedies can be found. Corruption does not affect only the poorest countries or emerging markets; it is present to some degree in all countries. It makes an impact on the economic and social texture in different degrees according to the specific conditions of each economy. Governments have the opportunity to react limiting those conditions which boost its diffusion. The complexity of this phenomenon makes it clear that corruption must be fought in multiple ways. The government can influence the economy defining a multi-faceted strategy to fight corruption through medium–term policies and through a structure of incentives and punishments. First of all, we should think of broad, far-reaching policies; these kinds of long-term policies are those meant to transform the institutional texture and the attitudes of members of society. Policies regarding education and individual and cultural development are the starting point for an effective battle against corruption; as a matter of fact, countries with higher cultural standards show a lower index of corruption. Educational policies can strengthen awareness of this phenomenon and rejection strategies. These policies operate also through indirect channels that influence the economic and institutional environment of a society. This policy proposal strengthens the potential for educational policies to affect the cultural breadth, the professional skills, and the civic spirit of both citizens and policy makers in a positive way. We think that school programs should not be oriented to “inform” students, nor be mainly work oriented. These are specific objectives of life-long education programs and on-the-job training programs. School programs should be mainly oriented to strengthen learning abilities, and foster creativity, curiosity, and reasoning skills. Further, the level of cultural awareness of public opinion acts as a catalyst on the political and institutional environment. Educated voters are also citizens who can exercise democratic control over political and institutional life in their country; expect independence, autonomy and competence for supervisory/regulatory authorities; and expect these authorities to act according to the principles of transparency and democratic accountability.
cap1.qxd
22/05/2007
8.19
Pagina
14
14
MARCO ARNONE - ELENI ILIOPULOS
Economic side
Institutional side
a) PREVENTION - Elimination of conflict of interest - Education - Transparency b) CONTROL AND PUNISHMENT
SUPERVISORY AUTHORITIES - Autonomy - Accountability - Transparency
© 2007 Vita e Pensiero
EDUCATION POLICIES
For medium-term policies, it is certainly necessary to consolidate preventive measures: through both the reinforcement of supervisory authorities (according to the above principles), and specific training programs for private agents and public officials. Also, it is absolutely crucial to introduce (or increase) measures aimed at minimizing possible conflict of interest; the areas of discretion left to beaurocrats should be limited with more precise rules, and accountability and transparency increased. In the poorest countries, income incentives have been proposed as a tool for eliminating bribery; in particular, where income distribution is significantly uneven, systems based on merit can be useful in prompting accountability. However, these systems can prove very expensive if the number of public employees is high. Also, the possibility of differentiating incomes could give the government a tool for politically discriminating against rivals; at the same time, imposing merit as the criterion for income differentiation in the public sector eliminates a useful tool for income redistribution. For these reasons, systems based on merit could prove socially undesirable. Similar considerations apply to punishments: even if they are aimed at limiting the use of discretion, they can represent a tool for political repression. Alternatives for both poor and advanced countries could instead include organizational and governance measures.
cap1.qxd
22/05/2007
8.19
Pagina
15
OVERVIEW OF CAUSES, EFFECTS, AND POLICIES
15
© 2007 Vita e Pensiero
For the fiscal system, lack of transparency breeds episodes of bribery. Fiscal system reforms need to aim at diminishing the number of regulations in favour of uniformity and clearness. Also, taxes applying to large groups of agents are preferable than those applied to small groups; analogously, incentives and exemptions need to be limited. Our proposals are clearly very general and consist of very general measures. This generality allows policy makers to have very diverse responses. In particular, our proposals can be used as a starting point for reforms in very diverse environments: our analysis is based on a sample of more than 140 countries. In recent years several international organizations have shown an increasing interest in the implications of corruption; this gave start to proliferating programs for combating it. In particular, the United Nations (UN), the International Monetary Fund (IMF), the World Bank (WB) and the Organization for Economic Cooperation and Development (OECD) have significantly increased their involvement. Indeed, in a globalized world economy, prevention and repression of corruption and education efforts aimed at reducing corruption could be more effective if internationally coordinated.
Back to the Summary
cap2.qxd
22/05/2007
8.19
Pagina
16
CHAPTER II
Corruption, firms, and markets
© 2007 Vita e Pensiero
1. Markets and “rules” In this book we are predominantly concerned with corruption in the form of interaction between public and private entities. First of all, however, we need to look at the overall relations between markets and “rules”; therefore, the following arguments also apply to corruption between private entities only. It is key to go deeper into market ‘physiology’ so that we may understand its ‘pathologies’. Far from being ‘jungles’ where the law of the strongest rules, markets are a set of most sophisticated relations between producers and consumers, and between technical knowledge and organization in time and space. Furthermore, they are also a set of relations between economic actors and social, political, legal, and civil institutions. A set of rules common to all economic actors, and their enforcement, are essential preconditions to the functioning of competitive markets, with their outcomes of efficient distribution and utilization of resources and optimal individual choices. We underline the abysmal distance between this concept of market and a primitive vision – widespread and yet totally erroneous – of a market in which competition and the dynamics of birth and mortality of enterprises is mistaken for ‘the law of the strongest’, with markets open to abuse by whoever may be wielding power. Nothing is further from the concept of market as defined in microeconomic theory: in a competitive market those affirm themselves who are as efficient, innovative and capable of organizing resources at least as well as others, in the respect for the rule of law as commonly established. Markets characterized by widespread corruption are instead dominated by operators with the least entrepreneurial capabilities, who need to break the rules,
cap2.qxd
22/05/2007
8.19
Pagina
17
© 2007 Vita e Pensiero
CORRUPTION, FIRMS, AND MARKETS
17
illegally impose their will, use (or be used by) political power to avoid competition. These operators may be good at rent seeking, while they seek resources and ‘parasite’ advantages, but are no entrepreneurs as such. Let us return to the relations between the concept of market and the rule of law. We said that a set of commonly shared rules is required in a market. Not all rules are at the same level. Certain regulations, rules and principles are subject to negotiation. This typically applies to market failures: we may think of the allocation of rights in cases where externalities are of concern, such as in the case of smoking. Once they are established, these regulations – that may change in time, the effect of social and political choices – are common to all actors who have part in the economic life of a society. However, there are regulations that are so fundamental to the very existence of a market, such that we may not even think they be not enforced or systematically changed. This is the case with ownership rights and their enforcement: in a society where no such rights exist, nor are they enforced, it is not even possible to define an Edgeworth box, an analytical instrument through which economists demonstrate that a competitive market provides efficiency and optimality; in this case we may not talk about a market at all. These rules, and their enforcement, are logical and practical preconditions necessary for the existence of a market with such characteristics that make it a desirable means to allocate resources, satisfy individual choices, and disseminate information. These regulations are not up for bargaining – less so for the bargaining of few individuals rather than all, as is typical with cases of corruption. For example, in the early Nineties, in the aftermath of the fall of the Soviet Union, there were years in those countries when, while enjoying legal recognition, ownership rights lacked de facto enforcement. Appropriation of resources became a possibility as opposed to voluntary market exchange. In these conditions no price is determined that is significant for transactions, nor is there any free market at all. Similarly, in areas where there is strong criminality, actors in the market may come under pressure or be forced to “exchange” their goods or services by whoever may use threats to secure profitable businesses. It is clear that also in these
cap2.qxd
22/05/2007
© 2007 Vita e Pensiero
18
8.19
Pagina
18
MARCO ARNONE - ELENI ILIOPULOS
conditions there are no voluntary transactions nor do ‘prices’ have any economic significance. This argument shows how the concept of “rule” logically precedes that of market. Markets are (implicitly but inevitably) defined as part of an organized social context, where are established commonly shared behavioral rules, with enforcement mechanisms that punish excessive deviations. Adam Smith defines his concept of an invisible hand in The Wealth of Nations – in which self-interested individuals contribute to maximize collective welfare – after in his Theory of Moral Sentiments the motives are presented that drive individuals to form societies, define organized structures, and establish behavioral rules. In a mistaken ‘economics-biased’ vision of society in which the market devours social organization and its rules, while it violates and bends them to the (mistaken) idea that everything is exchangeable and has a price, the market destroys itself. Also, at the same time, the logical desirability of the market as we discussed earlier – that the market is an efficient mechanism to allocate resources, an instrument to realize optimal individual choices, and a mechanism to define prices as a synthesis of the information that is sufficient to make economic decisions – looses its fundations. This discussion on rules and markets highlights that a dialogue of Law and Economics is fundamental. Also, it makes clear the necessity of a dialogue between Ethics and Economics, in the best interest of societies and economic actors. As we show in this book, a clean economy is also a stronger and a wealthier economy, in a more educated, dynamic, and open social context. Borrowing from Popper, empirical evidence shows that corruption is certainly an enemy of an ‘open society’. Whenever players violate the rules, equality no longer exists between all players. There is no assurance that whoever emerges is the best from an economic point of view: the market no longer guarantees efficiency or optimality or price informativeness. Moreover, ‘dirty’ players jeopardize the survival of competitors who play by the rules: one who bids for a contract and has dirty money available to himself may win that contract because dirty money ‘costs less’ than clean money, and allows lower costs enabling a successful bid. Hence ‘clean’ players are excluded. When this happens on a regular basis, clean players may see their
cap2.qxd
22/05/2007
8.19
Pagina
19
CORRUPTION, FIRMS, AND MARKETS
19
position weaken until they are driven out of business. Dirty players come to dominate the market. This market is not a competitive market. When economists talk about competitive markets, they often take it for granted that there exists the logical prior of common, respected, and enforced rules. It is indeed of a practical importance that policymakers reinforce supervisory/regulatory authorities, specifically to protect competition and monitor individual behaviors. We analyze this in chapter 4 to clarify the context in which financial supervisory/regulatory agencies operate. If these agencies are not sufficiently well established and functioning, risks exist with respect to the very concept of competitive markets, efficiency and optimality. In the long run an economic system is less capable of producing wealth and improving the standard of living of actors in the economy. Finally, in a competitive market the principle of freedom has ultimate value, embodied in the concept of consumers’ sovereignity: individual choices based on individual preferences and budget constraints, and freedom from third-party directions. In a market in which certain players use illegal means to secure resources and opportunities, the market might fail to satisfy the demand of clean players, who will suffer a limitation to their freedom. Following on from our discussion on markets and the rule of law, such fundamental links between law (and justice) and society emerge that identify some fundamental connections between Economics, Ethics, and Freedom.
© 2007 Vita e Pensiero
2. Corruption and distorsions From our analysis in Chapter 1 it is clear that, given its complexity, no direct causes exist that may determine widespread corruption; however, certain public sector activities may provide a suitable background for the development of corruption. Included are licensing regulations, taxes, public spending, party finance and all activities that are inherently discretionary, or characterized by a concentration of political and economic power. Corruption may significantly influence both resource allocation and domestic product distribution: because of this, both pri-
cap2.qxd
22/05/2007
8.19
Pagina
20
20
MARCO ARNONE - ELENI ILIOPULOS
vate and public activities may experience major efficiency losses. Market functioning may be subject to distortions that limit free competition. State regulators determine many characteristics of the economic environment in which players interact. With no regulatory system to protect the functioning of free competition, markets per se may ensure no efficient resource allocation. Market failures structurally limit the possibility that conditions necessary for efficient competition may endogenously materialize. Moreover, the necessity that collective social needs be satisfied may require state intervention: competition per se may not ensure that the equity principle is upheld. State regulation is inherently discretionary. Because of this, it reflects the expertise and moral qualities of lawmakers. As discretion and strong economic interests favor power abuse, those laws that should guarantee good market functioning may be designed instead to favor specific groups or individuals. Distortions arising in this respect may affect both public and private sectors and influence resource allocation, production or redistribution. Also, requirements or regulations that are either excessively restrictive or complex may prevent access to new market entrants.
© 2007 Vita e Pensiero
2.1. Impact on new market entrants Close association of low quality governance and corruption is of particular significance with regard to new market entrants. Market regulation has a strong impact, both on the conduct of business and on market entrance decisions: it has a role in selecting market players. Regulations and requirements that are necessary to conduct a business aim at guaranteeing that markets function in the full respect of competition and the rule of law. Regulations in favor of individual entities have the opposite effect and are an impediment for players other than those favored. While players who are not favored may either exit the market or never start a new business, this has negative effects on society as a whole, slowing economic growth and development processes. Results of an empirical study conducted jointly by the European Bank for Reconstruction and Development and the World Bank confirm that corruption represents a major obstacle curtailing access of new market entrants (Tanzi and Davoodi,
cap2.qxd
22/05/2007
8.19
Pagina
21
21
CORRUPTION, FIRMS, AND MARKETS
2004a); their Business Environment and Enterprise Performance Survey analyses results for a sample of 3,000 firms from transition economies. It is interesting to note that firms indicate anti-competition practices and corruption as major obstacles to starting up a business. Our arguments help illustrate these results. New business creation and efficient market regulation are positively associated. It appears that if, on the one hand, market functioning is not ensured by the market per se and must be protected through the establishment of rules and regulations, on the other hand a non-distorted market promotes new market entrants. The support of regulations for an efficient market functioning is a key element for firms and reflects a variety of distinct country-specific factors. Regulations favoring individual self-interested entities versus overall market functioning discourage new market entrants and create the ground for widespread corruption. Figure 2.11 illustrates the relation between state legislation in favor of new business creation and domestic corruption.
CPI
Figure 2.1 - Corruption and new business creation, year 2004 11 10 9 8 7 6 5 4 3 2 1 0
© 2007 Vita e Pensiero
0
2
4
6
8
10
New business creation Source: Authors’ estimates on IMD (2004) and TI data. CPI=10 denotes absence of corruption while CPI=0 denotes the highest corruption level.
1 For all charts country samples and supplemental notes are presented in Appendix I: Notes on Figures.
cap2.qxd
22/05/2007
8.19
Pagina
22
22
MARCO ARNONE - ELENI ILIOPULOS
The chart shows that lower corruption is generally associated with regulations in favor of new business creation; again, the evidence is that good governance and corruption are negatively correlated. Efficient market regulation is reflected in how quickly it is possible to go through the bureaucracy that is required to start a business. Bureaucratic requirements represent costs in terms of time and money; if, on the one hand, effective costs may reflect fiscal policy choices, on the other hand no policy choice justifies overlengthy procedures: these represent a major efficiency loss. We may also note that complex, non-transparent bureaucracy favors abuse by state officials and helps spread corruption; also, bureaucracies pervaded by corruption have the incentive to create complicated, non-transparent procedures and increase illegal rents. In Figure 2.2 we represent a country’s domestic corruption in association with how long it takes to go through procedures to start new businesses. We use the number of days between the beginning of bureaucratic procedures and effective beginning of business operations as a proxy for difficult and lengthy bureaucracy. Again, we use CPI as a proxy of domestic corruption.
© 2007 Vita e Pensiero
CPI
Figure 2.2 - Corruption and days required to start a new business, year 2003 11 10 9 8 7 6 5 4 3 2 1 0
Spain
0
50
100
150
200
Days before beginning of operations Source: Authors’ estimates on IMD (2004) and TI data. CPI=10 denotes absence of corruption while CPI=0 denotes highest corruption level.
cap2.qxd
22/05/2007
8.19
Pagina
23
CORRUPTION, FIRMS, AND MARKETS
23
Over-lengthy bureaucratic procedures are generally associated with high corruption. With few exceptions (specifically, Spain’s average corruption is associated with a number of days that are significantly higher than the industrialized country average) this relation is strong all through our data set. It is interesting to note that in Indonesia, the country with the highest level of corruption, it takes as many as 168 days before a new business can begin. Corruption favors certain players and excludes others from access to necessary services. The inability to access services is among the principal factors against new business creation. An empirical study of a sample of Moscow-based firms found that management connectedness with city officials helps predict which firms will access bank finance (Tanzi, 2002). Access to finance is critical to new businesses, and granting of finance determines access of new market entrants. These results confirm empirical evidence as provided by recent studies on business-politics relations; these studies confirm that politically connected firms enjoy better access to finance, stronger market power and tax benefits. Nevertheless, empirical evidence also shows that these businesses perform generally worse than other businesses. A focus on this issue, currently of great interest, follows.
© 2007 Vita e Pensiero
2.1.1. Advantages and inefficiencies of politically-connected firms Recent studies (Faccio, 2002 and 2006) show evidence that political connectedness weighs heavily on business activities, particularly in non-democratic states (Fisman, 2001) or in countries where there is high corruption, widespread inequality in law enforcement and low transparency in the allocation of public resources and state incentives to enterprises. A methodology that is both innovative and effective to study political connections of fims is employed by Faccio (2002 and 2006): she uses directly observable measures to measure political connectedness in a cross-country data set, that includes 47 countries for the year 2000. A company is considered politically connected if either at least one large shareholder (whoever has direct or indirect control of at least 10 percent of the voting rights) or management (CEO, president, vice president and secretary) is a member of Parliament, a minister (or prime minister), head of
cap2.qxd
22/05/2007
© 2007 Vita e Pensiero
24
8.19
Pagina
24
MARCO ARNONE - ELENI ILIOPULOS
state (dictator, president, king) or is closely related to an important and influential politician or political party. Empirical research based on this methodology (Faccio, 2002) led to identify 541 publicly traded companies that are politically connected, representing 2.68 per cent of all publicly traded companies in the countries analyzed, and 7.72 percent of world market capitalization. Also, 59.5 percent of identified connections are through top directors, and 40.5 per cent are through majority shareholders. In a political analysis of these results, we observe that 59.6 percent of identified connections involve a member of parliament, 15.5 per cent a minister and 24.9 per cent, largely in Malaysia and Indonesia, involve a close friendship with influential politicians. Twelve countries in the sample show very few or no connections, while in Italy, Indonesia, Malaysia, Russia and Thailand over 10 per cent of publicly traded companies appear to be politically connected. Based on a series of regressions Faccio found that countries in which political connectedness is higher are characterized by high perceived corruption, restrictions on capital movements of residents, low economic development, and absence of constraints on the activity of individual politicians. Subsequent to an analysis of high-connectedness countries, Faccio empirically shows that, based on their privileged political connections, connected firms gain advantages in terms of better access to finance, market power and tax benefits as compared with unconnected firms. These advantages are relatively stronger in countries where corruption is higher and generally much weaker in democratic systems, where there is higher transparency and equity in law enforcement. Faccio also analyzes whether connections create distortions in capital allocation, allowing resources to be largely appropriated by less efficient firms. She makes use of economic performance indicators such as the return on equity (ROE) and market-to-book value ratios to show how connected firms perform systematically worse than unconnected ones. ROE and market-to-book ratios of connected firms are 5.38 and 0.48 percentage points lower as compared with unconnected firms. Consistent with findings in the literature, this result reflects higher spending of connected firms for rent-seeking versus investment activities, to the extent
cap2.qxd
22/05/2007
8.19
Pagina
25
25
CORRUPTION, FIRMS, AND MARKETS
that the value of rents earned through political connectedness is nil. Firms may in fact choose to establish political connections even though their value is negative, because not to establish a connection would deliver worse results. This is all the more true the higher the level of domestic corruption. Similar to access to finance, the cost of capital is also a primary determinant in market entry and investment decisions: costs in excess are a significant obstacle to business creation. The impact of the cost of capital on individual economies varies significantly and reflects diverse factors, especially the availability of several source of financing in the system. In Figure 2.3 we show that the impact of the cost of capital on the economy and domestic corruption are correlated. We may suppose that, if the cost of capital is too high, alternative (possibly uncertain and unsafe) sources of capital could be available in the economy.
CPI
Figure 2.3 - Cost of capital and corruption, year 2004 11 10 9 8 7 6 5 4 3 2 1 0
Island
0
2
4
6
8
10
© 2007 Vita e Pensiero
Effects of cost of capital Source: Authors’ estimates on IMD (2004) and TI data. CPI=10 denotes absence of corruption while CPI=0 denotes highest corruption level.
Figure 2.3 shows that high corruption (low CPI) is associated with an adverse impact on the cost of capital. Again, the reason for this
cap2.qxd
22/05/2007
8.19
Pagina
26
26
MARCO ARNONE - ELENI ILIOPULOS
correlation may rest on the negative impact of bad governance on institutional decisions (which cost of capital depends upon), risk factors or the fact that, should the cost of capital pervasively hinder their businesses, market players would use alternative, illegal practices, such as corruption. We cannot exclude the possibility that the relationship between the negative impact of the high cost of capital and corruption may take effect through channels that involve such variables as economic growth and risk. We analyze the dynamics associating corruption with economic growth and the cost of money, respectively, in chapter 3. It is worth noting that exceptions to this general trend exist, such as Iceland, where a high cost of capital has a markedly adverse impact on the economy, yet corruption is very low. 2.2. Competitiveness: effects on firms in corrupt environments In a market pervaded by corruption, resource allocation is distorted. Not only do the effects of corruption constitute an impediment to new business creation, but also to existing businesses, whose interests are not protected. Because difficulties of firms operating in corrupt environments are substantial, special attention must be given to them.
© 2007 Vita e Pensiero
2.2.1. Obstacles to businesses A recent World Bank study (Kaufman, 2004) offers an analysis of channels through which corruption obstructs the activity of firms with operations in corrupt environments. This study is based on evidence from a World Economic Forum EOS, or Executive Opinion Survey. This report analyzes results of a questionnaire relating to a sample of firms with operations in industrialized and developing countries. A question was asked to identify five factors (out of a list of fifteen) which most obstruct their business. The answers to this question are illustrated in Figure 2.4. Firms are classified based on the geography of operations (OECD or emerging economies).
cap2.qxd
22/05/2007
8.19
Pagina
27
27
CORRUPTION, FIRMS, AND MARKETS
Figure 2.4 - Main obstacles to businesses: OECD and emerging economies, year 2004
Inflation
Tax rates
Tax system
Corruption
Crime
OECD Countries
Government instability
Political instability
Labor
Skilled labor
Bureaucracy
Infrastructures
Foreign exchange regulation
Marketing Regulation
60 50 40 30 20 10 0
Financing
Emerging Economies
© 2007 Vita e Pensiero
Source: Kaufmann (2004).
Data show that in emerging economies factors with a major adverse impact are corruption, bureaucracy, political instability and finance; labor regulations, inefficient bureaucracy and taxes are critical factors in industrialized countries. We may note that these results reflect the perceptions of individual firms. But this is not a good reason to underestimate these results: perceptions are at the basis of expectations and investment decisions. If we group all fifteen factors in seven sets, the governance-variables set is the most important: in particular, firms in 79 out of 104 EO-surveyed countries indicate that governance factors have a major adverse impact on their business. Corporate finance, labor market, tax regime and infrastructure rank as a second critical set. A significant gap exists between the first and second critical set. 2.2.2. Dangers and costs for firms Corruption is a cost for society as a whole and acts as a structural constraint. It may not be eliminated nor minimized significantly by individuals in the economy but calls for governance reforms.
cap2.qxd
22/05/2007
8.19
Pagina
28
28
MARCO ARNONE - ELENI ILIOPULOS
Like security and crime prevention, corruption represents a fixed cost and is a major charge to corporate investment decisions. EOS results for 2004 (Kaufmann, 2004) follow below, with respect to relative costs of corruption; in Figure 2.5 the cost of corruption in the form of ‘state capture’ is contrasted with costs of common crime, terrorism and organized crime (that also includes corruption in such forms other than ‘state capture’). Figure 2.5 - Costs of crime, year 2004 Organized crime
Terrorism
Common crime
State Capture
South America
Southern Asia
Eastern Europe
Former Soviet Union
Asian emerging economies
NICs
East Asia
G7
Northerm Europe
OECD
80 70 60 50 40 30 20 10 0
© 2007 Vita e Pensiero
Source: Kaufmann (2004).
Data shows that state capture is perceived as the most harmful threat according to firms in Southern Asia, Eastern Europe, Asian developing countries and former Soviet Union. Also, it represents a major charge for firms in G7 and OECD countries, South America and Nics (Newly Industrialized Countries). Only in North European countries – for which CPI is optimal – does the impact of corruption seem negligible. While it denotes the importance of state capture costs, Figure 2.5 highlights also the importance of costs of organized crime. Included is all organized corruption other than state capture. In Latin America, Eastern Europe, former Soviet Union, Asian emerging economies, Northern Europe and OECD countries,
cap2.qxd
22/05/2007
8.19
Pagina
29
29
CORRUPTION, FIRMS, AND MARKETS
crime ranks second amongst all perceived costs for firms; moreover, the cost of organized crime for firms is one of the most significant for all countries, excluding Northern Europe. Empirical evidence shows that terrorism is a significant cost in most of the areas examined, but only firms in industrialized countries perceive terrorism as a particularly dangerous threat. If we consider that state capture and organized crime are at significant levels also in this area, we may reasonably think that policy makers should widen their focus from terrorism to governance-related crimes. In light of this argument it may be useful to show empirical evidence from Kaufmann (2004) on a comparative analysis of costs of terrorism and organized crime for firms in a specific country sample.
© 2007 Vita e Pensiero
Figure 2.6 - Costs of terrorism and organized crime for firms, year 2004 Venezuela U.S.A. U.K. Ukraine Uganda Sri Lanka Spain Singapore Russia Portugal Philippines Nigeria Mexico Kenya Japan Italy Israel Guatemala Finland Estonia Egypt Colombia Chile Brazil Bangladesh Australia
Cost of organized crime Cost of terrorism
0
20
Source: Kaufmann (2004).
40
60
80
100
cap2.qxd
22/05/2007
8.19
Pagina
30
30
MARCO ARNONE - ELENI ILIOPULOS
Organized crime appears as a major obstacle to business in Italy and Russia. Despite so significant an impact is more of an exception than the rule, we may note that, as in other industrialized countries including Spain, Portugal and Japan, the impact of organized crime must not be underestimated. 2.2.3. Regulated competition Corruption uses governance factors to operate from inside markets and distort resource allocation (see chapter 4 for an analysis of corruption in its association to governance variables). Opposing competitive market functioning are various obstacles, also in the form of laws to protect individual versus collective interests; functioning of competition reflects the quality of regulations to protect it. In Figure 2.7 we show the relationship between perceived efficient regulation of competition and CPI; well regulated competition is associated to high CPI, or low corruption. Figure 2.7 - Efficient regulation of competition and corruption, year 2004
Regulation of competition
9 8 7 6 5 4 3 2 1 0 © 2007 Vita e Pensiero
0
2
4
6
8
10
12
CPI
Source: Authors’ estimates on IMD (2004) and TI data. CPI=10 denotes absence of corruption while CPI=0 denotes highest corruption level. “Regulation of competition” refers to efficiency in regulating competition; the higher the index, the higher the efficiency.
cap2.qxd
22/05/2007
8.19
Pagina
31
31
CORRUPTION, FIRMS, AND MARKETS
Inefficiently regulated markets are poorly competitive. Production processes are a priori distorted by inefficient resource allocation and a selection of market players that does not reflect quality. If, on the one hand, inefficient firms or firms that are unable to meet consumer tastes can survive, provided they are favored by distortions, on the other hand, firms not favored by regulations may be driven out of business irrespective of their quality. Such a market does not guarantees efficiency, hence it is not competitive. This argument leads one to think that efficient regulation of competition and market competitiveness are positively associated. We analyze the evidence from the IMD World Competitiveness Yearbook, 2004. Figure 2.8 shows the positive and strong correlation between an index of efficient regulation and an index of firm competitiveness in individual countries.
Regulation of competition
Figure 2.8 - Regulation of competition and firms’ competitiveness, year 2004 9 8 7 6 5 4
USA
3 2 1 0 0
20000
40000
60000
80000
100000
120000
© 2007 Vita e Pensiero
Competitiveness Source: Authors’ estimates on IMD (2004) and TI data. “Regulation of competition” refers to efficiency in regulating competition; the higher the index, the higher the efficiency.
Regulations that reflect bad market governance hinder competitive selection and favor inefficiencies. We may note that certain countries show patterns other than this general trend: while firm
cap2.qxd
22/05/2007
8.19
Pagina
32
32
MARCO ARNONE - ELENI ILIOPULOS
competitiveness is strong in the US, US regulation of competition is just above average and firms’ competitiveness does not reach the highest efficiency levels. From the fact that both country competitiveness and CPI are positively associated to quality of competition, we may infer that competitiveness and corruption are also correlated. Based on different methodology and indicators, Kaufmann (2004) derives this relation running a regression of the Growth Competitiveness Index, GCI, on the variables in Figure 2.4. Corruption results in being the most significant explanatory variable, with a negative coefficient of around 0.76 measuring its correlation to competitiveness. In Figure 2.9 we show some empirical evidence. Figure 2.9 - Competitiveness and corruption, year 2004 120000 United States
Competitiveness
100000 80000 60000 40000 20000 0 0
2
4
6
8
10
12
CPI
© 2007 Vita e Pensiero
Source: Authors’ estimates on IMD (2004) and TI data. CPI=10 denotes absence of corruption while CPI=0 denotes highest corruption level.
Data underline the fact that the higher the level of a country’s competitiveness, the lower the corruption it experiences. Within the framework, as illustrated in Figure 2.9, the United States shows a slightly different pattern. The world’s most competitive country, the US, shows low domestic corruption, but not the lowest. This does not contradict with the general trend as illustrated.
cap2.qxd
22/05/2007
8.19
Pagina
33
CORRUPTION, FIRMS, AND MARKETS
33
This empirical evidence is particularly significant in its possible implications for economic policy. Data underline the importance of governing competition clearly and efficiently; bureaucracy in excess and unnecessary state intervention cause serious inefficiency, especially in the presence of discretion of state officials. Nevertheless, because markets per se may not guarantee market efficiency, there is a need for market regulation to protect the functioning of competition. To ensure that regulations are correctly implemented, authorities are required to supervise the market. Mandated to monitor the functioning of competition, supervisory/regulatory authorities play a fundamental role in this respect. Nevertheless, correct functioning of supervisors is threatened by political pressures: to ensure that supervisors are not vulnerable to the possibility of political conditioning, it is necessary that they exercise their activity with a high degree of autonomy. If autonomy cannot be granted, there may be grounds for the development of power abuse and corruption. (See our analysis of institutions in chapter 4).
© 2007 Vita e Pensiero
2.3. Corruption and its impact on markets Corruption has no uniform impact on all markets, nor on all businesses in one market. The impact of corruption may be greater on certain businesses. Environments in which there is concentrated economic or political power largely favor the development of corruption. An incentive to corruption arise when the costs of prosecution are more than compensated by illegal rents. To analyze the impact of corruption in different sectors of the economy, we utilize results of a study conducted by Gallup International Association for on-line release by Transparency International. Figure 2.10 illustrates the perceptions of sampled firms in sectors where bribe payments are more frequent. Our reference index is the Bribe Payers Index (BPI), which is calculated using a sample of emerging countries that are involved in international trade and are the receivers of foreign finance.
cap2.qxd
22/05/2007
8.19
Pagina
34
34
MARCO ARNONE - ELENI ILIOPULOS
Figure 2.10 - Sectors where bribe payments to public officials are more frequent, perceptions for 2002 Agriculture Light Manufacturing Fishery Information Technology Forestry Civilian aerospace Banking and finance Heavy Manufacturing Pharmaceuticals/Medical Care Transportation/storage Mining Power generation/transmission Telecoms Real estate/Property Oil and Gas Arms and Defense Public works/Construction
0
1
2
3
4
5
6
7
© 2007 Vita e Pensiero
Source: Authors’ estimates from TI, Bribe Payers Survey 2002, Table 2. 0 denotes highest perceived corruption and 10 denotes absence of corruption.
Figure 2.10 shows data that are consistent with our earlier discussion. We may note that high levels of corruption are associated with highly capitalized sectors in which significant state constraints exist on entrepreneurial activities. For instance, in real estate development corruption exists that is associated with large contracts. In energy and telecommunications, state regulations may lead to the establishment of monopolies or oligopolies. We may also mention all industries supplying governmental products and services only, under no competition constraints: included are the defense and pharmaceutical sectors. The association of corruption with the possibility to earn substantial rents is also reflected in the magnitude of amounts bribed. If, on the one hand, sectors in which the possibility exists to extract substantial rents are corrupt at the highest degree, yet,
cap2.qxd
22/05/2007
8.19
Pagina
35
35
CORRUPTION, FIRMS, AND MARKETS
on the other hand, favors that earn significant benefits to those who ask may have a very high price. These arguments are in keeping with the empirical evidence. Figure 2.11 - Sectors where bribe payments to public officials are higher in amount, perceptions for 2002 Light Manufacturing Civilian aerospace Agriculture Fishery Heavy Manufacturing Forestry Transportation/storage Mining Information Technology Telecoms Pharmaceuticals/Medical Care Power generation/transmission Real estate/Property Banking and finance Oil and Gas Arms and Defense Public works/Construction 0
10
20
30
40
50
© 2007 Vita e Pensiero
Source: Authors’ estimates from TI, Bribe Payers Survey 2002, Table 2. Scores reflect percentage of answers that mention a specific sector.
Figure 2.11 shows that sectors in which corruption is higher are also those in which higher bribes are extorted. Construction is perceived as the most corrupt sector and the one in which bribes are paid in the highest amount. This is also applicable to oil and gas, defense and energy. While corruption is low, amounts bribed are high in the banking and finance sectors, as shown in Figures 2.10
cap2.qxd
22/05/2007
8.19
Pagina
36
36
MARCO ARNONE - ELENI ILIOPULOS
(in which banking and finance rank eleven) and 2.11 (in which banking and finance rank 4), respectively. This association may reflect diverse factors. It is reasonable to assume that, because it is internationally exposed, banking and finance is less corrupt (remember the importance of international financial institutions, chapter 6). At the same time, it is also plausible that, given the magnitude of capital flows and potential profitability, amounts bribed may well reflect both the captor’s revenues and a higher risk of being caught (that exist for international operators).
© 2007 Vita e Pensiero
2.4. Small and medium size firms We conclude our discussion on the multi-faceted market impact of corruption with a focus on small and medium size enterprises (SME): their peculiarity is not so much in that they contribute to widespread corruption, as in that they may not bear costs in this respect. Recent studies (Tanzi and Davoodi, 2002a) highlight the importance of small and medium firms: they are central in creating labor demand (due to their size, that makes them less capital intensive), and significantly contribute to domestic economic growth. Small and medium firms tend to invest more in product versus process innovation (as larger firms do) and their performance is strictly in connection with the ability of their owners. Because lower capital resources are available to them, access to finance is critical for small and medium firms. This discussion confirms results of the relation between corruption and cost of capital, on the one hand, and corruption and access to finance on the other. Corruption may represent so high a cost that small and medium firms may be forced out of the market: small and medium (versus large) firms typically cannot afford bribe payments or create specialized internal resources for an efficient management of relations with state officials. It is difficult for them to get out of paying bribes and they are generally forced to pay higher bribes per unit of output than larger firms are. Far from oligopolistic dynamics, they operate in more competitive environments, where earnings are minimal. Tanzi and Davoodi (2002a) provide empirical evidence in support of these arguments. For instance, in Indonesia, the cost of
cap2.qxd
22/05/2007
8.19
Pagina
37
CORRUPTION, FIRMS, AND MARKETS
37
corruption for small firms and retailers equals 20 percent of sales; similarly, in Uganda, in 1997 firms paid bribes of up to 28 percent of the capital they invested in machinery and equipment. There is empirical evidence that managers of smaller firms are generally forced to spend more time with state officials; because time is scarce, the more time spent on bureaucracy the higher the cost. Also, the adverse impact of corruption on returns on capital is stronger for smaller firms: while Argentina’s larger firms experience lower returns in the range of 1 to 2.5 percent, small and medium size firms see a drop of 3 to 3.6 percent and 2 to 2.5 percent, respectively. We analyze the effects of corruption on investments in chapter 3. It is sufficient here that we notice the multiplicity of channels through which corruption hinders the activity of small firms. The impact of corruption on small and medium firms has important policy implications. SMEs drive labor demand and economic growth; because of this, economic policy should seek to eliminate obstacles to their activities to promote development. Nevertheless, our earlier discussion highlighted how corruption negatively impacts the possibility that SMEs continue their activities; hence, economic policy measures in favor of SMEs may prove ineffective unless attention is drawn to the costs of corruption. A lesson is drawn similar to what we learnt for the relationship between competitiveness and corruption: economic development through small and medium firms in corrupt economies is not generally possible unless financial sector governance undergoes major reforms.
© 2007 Vita e Pensiero
2.5. The allocation of talents The existence of markets pervaded by corruption is at the same time cause and effect of the possibility that most talented individuals prefer rent-seeking versus productive activities. Several recent studies confirmed this trend and underlined the possible adverse implications for economic growth. Amongst others, we may mention Murphy, Shleifer and Vishny (1991) and Tanzi and Davoodi (2002a). Similarly to the first one, the second study is empirical research analyzing the implications of students from 53 countries choosing to enroll in productive activities, such as engineering, versus rent-seeking-associated activities such as law. The
cap2.qxd
22/05/2007
38
8.19
Pagina
38
MARCO ARNONE - ELENI ILIOPULOS
results of regressions show that domestic corruption is adversely correlated to the choice for productive activities; there is also a major adverse impact on growth due to the allocation of talent in favor of non-productive activities. Finally, individuals from affluent social groups are more inclined to choose non-productive activities in corrupt environments; Dabla-Norris and Wade (2002) show that, if constraints exist on financial markets, individuals with income in excess of a certain critical threshold tend to favor rent-seeking. This reflects an attempt both to preserve initial wealth and, more importantly, to prevent others from appropriating this wealth.
© 2007 Vita e Pensiero
2.6. Economic development and corruption Corruption may impact a country’s economic development not only through market dynamics, but also through the environment where those dynamics develop. A common proxy for a country’s welfare, GDP, measures actual economic wealth. It does not, however, measure potential development. Potential growth results from a number of factors including human development indices, discussed in greater details in chapter 5. Our focus is now on an index of business environment quality. The business environment index reflects a country’s existing opportunities to start new businesses; it includes such sub-indexes as market potential, fiscal policies, labor conditions, infrastructure, know-how, and, finally, a sub-index for quality of a country’s political environment. While it may provide no representation of a society’s overall development potential, it offers a perspective on existing market environment. This index not only takes into account constraints imposed by market regulations, but represents a proxy for a country’s infrastructure, work force, investment potential and political environment. Empirical evidence with respect to the relationship between a country’s corruption and governance quality, and between corruption and competitiveness, respectively, indicates that corruption also has an adverse impact on business environment.
cap2.qxd
22/05/2007
8.19
Pagina
39
39
CORRUPTION, FIRMS, AND MARKETS
CPI
Figure 2.12 - Corruption and business environment, year 2003 11 10 9 8 7 6 5 4 3 2 1 0 0
2
4
6
8
10
Business environment Source: Authors’ estimates from TI and The Economist (2004) data. CPI=10 denotes absence of corruption; CPI=0 denotes highest corruption.
© 2007 Vita e Pensiero
In Figure 2.12 we show recent empirical evidence relating to the correlation between the business environment index and CPI. As argued above, data show that a country’s business environment quality and domestic corruption are clearly related; markets favoring the development of entrepreneurial activities are clearly the least corrupt. This evidence provides a wider focus for our analysis. Corruption has a deep impact on society: its effects are of concern not only in several aspects of economic life, but extend to institutional and social dimensions, as we argue in chapters 4 and 5.
Back to the Summary
cap3.qxd
22/05/2007
8.19
Pagina
40
CHAPTER III
Corruption and macroeconomic performance
© 2007 Vita e Pensiero
In chapter 2 we discussed the microeconomic effects of corruption: our analysis highlighted the fact that corruption adversely impacts society in the form of major efficiency loss. Additionally, we noticed that a negative correlation exists between certain variables that are proxies of governance quality and a country’s domestic corruption. We found that a negative correlation exists also between corruption and domestic competitiveness. These relations call out to policy makers as they show how corruption represents a limit for business competitiveness and a drag on economic development. Economic policies that initiate governance-enhancing reforms can be effective in promoting a country’s competitiveness1. The focus of our analysis shifts now from the perspective of firms and markets to the dynamics underlying the determination of macro variables in an economic system. We turn our attention to the effects of corruption on a country’s wealth growth, trade and interest rates; we discuss how corruption adversely affects macroeconomic performance also indirectly via education or trade flows. The second part of this chapter is devoted to an indepth analysis of the effects of corruption on the public sector. Finally, in the last paragraph our focus broadens to the issue of persistence of corruption over time.
1. Domestic product Corruption is not a feature of poorer countries only, but an evil that strikes advanced economies as well. Nevertheless, our arguments so far infer that poorer countries may be more easily struck; 1
See Alesina and Giavazzi (2006).
cap3.qxd
22/05/2007
8.19
Pagina
41
41
CORRUPTION AND MACROECONOMIC PERFORMANCE
given the relationship between bad governance and corruption, to establish state organizations that are not vulnerable to corruption means to commit major resources to institutional apparatuses and a good incentive system for public officials (see chapter 4). The direction of causation between corruption and economic wealth may not be established unequivocally because very often both variables are mutually influencing. In general, poorer countries do not have the necessary means to create efficient bureaucracies or checks to fight corruption. Moreover, low income drives individuals to corruption as a way to improve their living standards. Our earlier analysis emphasized how corruption may adversely affect economic development. Figure 3.1 maps GNP per capita and CPI in a cross-country data set that includes 127 countries. In line with our expectations, high income is generally associated with high CPI scores. Figure 3.1 - Gross National Product per capita and domestic corruption, year 2003 50000
GNP per capita
40000 30000 20000 10000 0 0
2
4
6
8
10
12
-10000
© 2007 Vita e Pensiero
CPI
Source: Authors’ estimates from TI and WB data. CPI=10 denotes absence of corruption while CPI=0 denotes highest corruption level.
Figure 3.1 maps the adverse relationship of domestic corruption and GNP, and high concentration of countries characterized by close to zero GNP per capita and pervasive corruption. This suggests that we further divide our data set into three data sets,
cap3.qxd
22/05/2007
8.19
Pagina
42
42
MARCO ARNONE - ELENI ILIOPULOS
specifically, of advanced, emerging and developing countries. It is now possible to verify for which group of countries this relationship is strongest. In figure 3.2 we show the relationship between CPI and GNP per capita in a cross-country analysis of a data set that includes advanced economies: Australia, Austria, Belgium, Canada, South Korea, Denmark, Finland, France, Germany, Greece, Ireland, Iceland, Italy, Japan, Luxembourg, Netherlands, New Zealand, Norway, Portugal, Singapore, Spain, Sweden, Switzerland, United States and United Kingdom.
GNP per capita
Figure 3.2 - Gross National Product per capita and domestic corruption, year 2003, advanced economies 50000 45000 40000 35000 30000 25000 20000 15000 10000 5000 0 0
2
4
6
8
10
12
CPI
© 2007 Vita e Pensiero
Source: Authors’ estimates from TI and WB data. CPI=10 denotes absence of corruption while CPI=0 denotes highest corruption level.
Recent empirical evidence shows that the relationship between GNP per capita and CPI is particularly strong for countries in this data set; high GNP per capita is associated with high CPI, i.e. low corruption. We show now also the same correlation for emerging economies.
cap3.qxd
22/05/2007
8.19
Pagina
43
43
CORRUPTION AND MACROECONOMIC PERFORMANCE
Figure 3.3 - Gross National Product per capita and domestic corruption, year 2003, emerging economies
GNP per capita
30000 25000 20000 15000 10000 5000 0 -5000
0
4
2
6
8
10
CPI
Source: Authors’ estimates from TI and WB data. CPI=10 denotes absence of corruption while CPI=0 denotes highest corruption level.
In line with our expectations, the same relationship holds for emerging as it does for advanced countries. The curve that minimizes differences among diverse points as graphed is positively sloped. We also note that income and CPI tend to concentrate at very low levels in this data set. Finally, we show the relation between GNP per capita and CPI for the developing country data set. Figura 3.4 - Gross National Product per capita and domestic corruption, year 2003, developing economies 8000 7000 GNP per capita
© 2007 Vita e Pensiero
6000 5000 4000 3000 2000 1000 0 -1000
0
1
2
3
4
5
6
CPI
Source: Authors’ estimates from TI and WB data. CPI=10 denotes absence of corruption while CPI=0 denotes highest corruption level.
cap3.qxd
22/05/2007
8.19
Pagina
44
44
MARCO ARNONE - ELENI ILIOPULOS
Figure 3.4 shows a positive relationship between domestic corruption and GNP per capita in developing countries. High GNP per capita is associated with high CPI, i.e. low corruption. Data show higher, more homogeneous dispersion than the emerging country data set. Our conclusion now is that a negative relationship exists between corruption and income per capita that holds for countries worldwide and is reflected in all data subsets that include advanced, emerging and developing economies. Evidence as shown does not illustrate causation, but is a static representation of reality. A dynamic perspective is necessary to analyze causation in the relationship between corruption and income.
© 2007 Vita e Pensiero
1.1. Economic growth Economic literature has found that domestic corruption and economic growth are inversely related. As we mentioned earlier, empirical studies (Murphy, Shleifer and Vishny, 1991) find a negative impact of corruption on growth due to resources being allocated in favor of rent-seeking activities. Mauro (1995) finds a relationship between growth and corruption based on a negative impact on investments; this is also a finding of Bardhan (1997) who has a focus on distorsion in investment allocation. Tanzi and Davoodi (2002a, 2002b) consider public and private investments separately and pay particular attention to small and medium firms. Finally, recent studies (Pellegrini and Gerlagh, 2004) make a distinction between direct versus indirect effects of corruption on growth and conduct an empirical analysis of the causes of this relationship. There is extensive economic literature in support of the relationship between domestic corruption and growth. This relationship is represented in Figure 3.5, based on recent data. Again, we use the CPI as a proxy of domestic corruption; to illustrate economic growth, we calculate an average growth rate on a ten-year basis, from 1993 through 2002, which is the most recent period for which empirical evidence is available. However, CPI data refer to 2003. This choice reflects the fact that CPI data for 2003 are available for a significantly broader country set than in previous periods. Also, this comparison is possible because corruption is highly persistent over time and
cap3.qxd
22/05/2007
8.19
Pagina
45
45
CORRUPTION AND MACROECONOMIC PERFORMANCE
data do not vary significantly on a year-to-year basis (see section 3.6 of this chapter). Figure 3.5 - Economic growth and domestic corruption, 1993-2002, 2003 12 10
CPI
8 6 4 2 0 -6
-4
-2
0
2
4
6
8
10
12
GDP growth
© 2007 Vita e Pensiero
Source: Authors’ estimates from TI and IMF data. CPI=10 denotes absence of corruption while CPI=0 denotes highest corruption level.
Figure 3.5 shows the negative relationship between corruption and economic growth in a cross-country data set for 123 countries. Data present high dispersion, due particularly to diverse growth rates. While advanced countries are characterized by relatively stable and low growth rates, emerging economies and some developing countries experience long periods of strong growth or severe recessions. Early in their development, economies tend to experience strong growth (or very low growth followed by strong economic recovery), and then converge to long-term growth levels. A comparison of growth rates for emerging versus advanced economies is subject to limitations. Hence we build alternative graphs to control for income. By doing so we ensure that the relationship between growth rates and corruption exists per se and not as an effect of income on variables as represented. Figure 3.6 maps CPI and GDP growth for advanced economies. Ireland is not in our data set, as it experienced excep-
cap3.qxd
22/05/2007
8.19
Pagina
46
46
MARCO ARNONE - ELENI ILIOPULOS
tionally stronger growth than its own average and the advanced country average for the period presented. It must therefore be regarded as an exception.
CPI
Figure 3.6 - Economic growth and domestic corruption, 1993-2002, 2003, advanced economies 11 10 9 8 7 6 5 4 3 2 1 0 0
1
2
3
4
5
6
GDP growth
© 2007 Vita e Pensiero
Source: Authors’ estimates from TI and IMF data. CPI=10 denotes absence of corruption while CPI=0 denotes highest corruption level.
In line with our expectations, data from this subset present much lower dispersion than the aggregate set as earlier discussed, for both CPI and GDP growth. We note that growth in these countries only varies in a 4 percent range from 1 to 5 percent for the period presented. CPI in these countries varies similarly and scores above 4, reflecting low corruption. The negative relationship between corruption and economic growth is confirmed. We now analyze corruption and GDP growth in emerging economies.
cap3.qxd
22/05/2007
8.19
Pagina
47
47
CORRUPTION AND MACROECONOMIC PERFORMANCE
Figure 3.7 - Economic growth and domestic corruption, 1993-2002, 2003, emerging economies
CPI
10 9 8 7 6 5 4 3 2 1 0 -2
Singapore Hong Kong Chile Israel
Cina
0
2
4
6
8
10
GDP growth
Source: Authors’ estimates from TI and IMF data. CPI=10 denotes absence of corruption while CPI=0 denotes highest corruption level.
© 2007 Vita e Pensiero
Data presented in Figure 3.7 show very high dispersion, especially for economic growth; the sensitivity to the different phases of economic development by individual countries is very high. With few exceptions, including Singapore and Hong Kong, CPI shows very low dispersion. We conclude our illustration of the relationship between growth and corruption with the last data set: that of developing countries. Dispersion is highest for countries in this data set. As we have earlier discussed, this characteristic reflects different stages of development of individual countries in this data set. CPI scores in the range 1 to 6.5 indicate in general high levels of corruption.
cap3.qxd
22/05/2007
8.19
Pagina
48
48
MARCO ARNONE - ELENI ILIOPULOS
Figure 3.8 - Economic growth and domestic corruption, 1993-2002, 2003, developing economies 7 6 5 CPI
4 3 2 1 0 -6
-4
-2
0
2
4
6
8
10
GDP growth
Source: Authors’ estimates from TI and IMF data. CPI=10 denotes absence of corruption while CPI=0 denotes highest corruption level.
© 2007 Vita e Pensiero
2. Corruption and effects on growth: an analysis of causal relations Empirical evidence shown in the previous paragraph provides no indication of the underlying dynamics nor of the causal direction between corruption and growth. It is necessary that we shift the focus of our analysis to discuss the channels through which these two variables influence each other. Because mutual dependence is very high, there is no possibility to establish only one direction of causation. We will highlight only the prevailing direction of causation, but we should remember that feedback effects are unavoidable. A survey of empirical literature on the effects of corruption shows that, given the same moral qualities and cultural inclination to follow the rule of law, governance variables are the principal factors at the basis of domestic corruption, while the effects of other variables are secondary (Mauro, 1995). This allows us to continue our study while we set aside the effects of growth on corruption. We will only consider causation as running from corrup-
cap3.qxd
22/05/2007
8.19
Pagina
49
CORRUPTION AND MACROECONOMIC PERFORMANCE
49
tion to growth and not viceversa. Nevertheless, we recognize that economic growth may have effects on CPI, though not prevalent, primarily through an impact on institutions (Pellegrini and Gerlagh, 2004). Growth has no unequivocal impact on domestic corruption: strong and sudden growth (e.g. the result of the discovery of new natural resources or existing resources in large quantities) tends to be associated with higher domestic corruption (Leite and Weidmann, 2002). Conversely, when economic growth is reflected in improved quality of institutions and equally-shared higher living standards, corruption tends to decrease. To estimate the effects of corruption, Pellegrini and Gerlagh (2004) run a regression whereby economic growth depends upon an initial level of income, domestic corruption and a vector of variables that economy literature on growth identifies as determinants; this regression shows that the direct effect of corruption on growth is slightly significant. A change of one standard deviation in the corruption variable increases growth by a modest 0.20 per cent. The direct effect on the growth rate of a reduction in the corruption index seems insubstantial, when compared to the contribution of any of the other independent variables. These results seem to contradict our earlier analysis and require further discussion.
© 2007 Vita e Pensiero
2.1. Indirect causation: investments, risk, and interest rates The empirical evidence of a strong relationship between corruption and growth leads us to think that, because it is not direct, this relationship must be of an indirect nature. Hence we take into consideration the variables that economic literature identifies as main determinants (Pellegrini and Gerlagh, 2004) and verify if, also based on available empirical evidence, corruption has a strong impact on them. First, we analyze gross investments. Empirical studies show that corruption significantly lower private investment, thereby reducing growth. Mauro (1995) estimates that a one standard deviation improvement of the corruption index leads to an increase in the investment rate by 2.9% of GDP. Analogously, Pellegrini and Gerlagh (2004) find that a one standard deviation increase in the CPI increases investments by 2.46 percentage points; this, in turn, enhances economic growth by 0.34% a year. As they remark, the
cap3.qxd
22/05/2007
50
8.19
Pagina
50
MARCO ARNONE - ELENI ILIOPULOS
© 2007 Vita e Pensiero
effect of the investment transmission channel exceeds substantially the direct corruption effect of 0.20 percent growth per year (calculated above). Robustness tests confirm the direction of causality: high degree of corruption hinders gross investments that, in turn, dampens growth. The negative relationship between investments and corruption reflects additional costs of bribery for firms. In addition to the amounts bribed, other charges must be considered in connection with the execution of bribery-based agreements. Agreements in connection with bribe payments are obviously illegal, and no external authority exists that may be called upon to guarantee their execution. Costs may be incurred in connection with illegal activities in the event of counterparty non-performance and to maintain secrecy throughout the procedure. We now present the relationship between investments and corruption based on recent empirical evidence. Which indicator is best suited to proxy gross investments is not an obvious choice, and must be further supplemented. We note that multiple factors cause capital movements internationally. Included are such determinants as liberalized capital movements on an international basis, access to finance and, above all, economic growth. To assess the impact of corruption on investments we measure the effect of corruption on investment risk, after controlling for other factors. This proxy allows us to determine how corruption may materially hinder investments, while we control for the direct effects of growth on investments; economic growth heavily impacts investments decisions and is difficult to isolate. We now consider the International Country Risk Guide (ICRG). This index reflects economic, financial and political risk ratings for 140 countries and helps determine the opportunity to invest or start new businesses in a country. It includes 22 variables2 in the
2
Political country risk rating includes such indicators as government stability, socioeconomic conditions, investment profile, internal and external conflicts, corruption, military in politics, religious tensions, law and order, ethnic tensions, democratic accountability (mechanisms whereby policy makers in democratic systems are held accountable to voters) and bureaucracy quality. Financial risk indicators include foreign debt in percent of GDP, foreign debt service and current account in percent of exports, international liquidity (in months of imports) and exchange rate stability. Economic risk components are GDP per head of population, real annual GDP growth,
cap3.qxd
22/05/2007
8.19
Pagina
51
51
CORRUPTION AND MACROECONOMIC PERFORMANCE
subcategories of political, economic or financial country risk ratings. As an indicator of investment risk, ICRG ratings are calculated with the contribution of several financial institutions and firms. It is reasonable that we assume that this index can proxy the cost of investment risk on a worldwide basis. This risk variable is a composite index and reflects expectations at the basis of investment decisions. Figure 3.9 - Cost of investment risk and corruption, 2002, 2003 100.00
Italy
Investment risk index
90.00 80.00 70.00 60.00 50.00 40.00 30.00 20.00 10.00 0.00 0
2
4
6
8
10
12
CPI
© 2007 Vita e Pensiero
Source: Authors’ estimates from TI and IMF data. CPI=10 denotes absence of corruption while CPI=0 denotes highest corruption level. Score of 0 indicates maximum risk, 100 indicates absence of risk.
Data show a clear relationship between investment risk and CPI: high corruption is associated with high risk. We note that this relation is very strong and data present very high concentration along the line that minimizes deviations. This results in increased significance of this relationship; we may hence conclude that risk in connection with investment decisions in a country is strongly cor-
annual inflation rate, budget balance in percent of GDP and current account in percent of GDP. We note that corruption is one sub-component of political risk. This suggests that domestic corruption has an impact on the relationship we are examining. Nevertheless, this effect is minimal.
cap3.qxd
22/05/2007
8.19
Pagina
52
52
MARCO ARNONE - ELENI ILIOPULOS
related with domestic corruption. In a country characterized by pervasive corruption, investment risk is substantial and creates a drag on economic activity. We now consider interest rates and verify if higher risk due to domestic corruption is reflected in higher cost of money. If so, it would be possible to obtain an explicit measure of the macroeconomic cost of corruption. We focus our attention on the spreads between interest rates applied to deposits versus loans. This variable proxies perceived risks on bank loans: the higher the risks of a loan, the higher the premium required by banks to lend the money. It is clear that if the cost of finance is high, this creates a drag on investment. Figure 3.10 shows the relationship between CPI and interest rate spreads for a worldwide-representative country data set. This data set excludes Brazil and Angola, for which interest rates spreads are highly in excess of their own average and the worldwide trend and must be considered outliers, representing extremely high inflation episodes. Figura 3.10 - Interest rate spreads and corruption, 2002- 2003 25.00
Spread
20.00 15.00 10.00
© 2007 Vita e Pensiero
5.00 0.00 0
2
4
Italy 6
8
10
12
CPI
Source: Authors’ estimates from TI and IMF data. CPI=10 denotes absence of corruption while CPI=0 denotes highest corruption level.
cap3.qxd
22/05/2007
8.19
Pagina
53
CORRUPTION AND MACROECONOMIC PERFORMANCE
53
Empirical evidence shows that high levels of corruption are associated with high cost of finance for a worldwide-representative data set3. This result is significant and has important implications: it allows us to calculate the impact of corruption on interest rate spreads and offers an accurate measure of the cost of corruption. The impact is represented by the slope of the straight line that minimizes quadratic deviations, as in Figure 3.10; this straight line represents the relationship under consideration. Hence, we calculate the slope of the straight line that minimizes deviations and obtain the relationship between CPI and interest rate spreads4. Data show that the slope of the regression line represented in Figure 3.10 has a coefficient of -1,1545 (-0.9571 if we exclude Angola and Brazil): for a unit increase in the CPI, spreads decrease by 1,1545 percentage points. This means that a unit increase of the CPI is associated with a more than proportional increase in the cost of money; corruption causes a higher cost of finance, that we can accurately calculate. 2.1.1. Foreign direct investment
© 2007 Vita e Pensiero
The impact of corruption is particularly significant for foreign direct investments (FDI). FDI is foreign capital flowing into lowliquidity activities as opposed to financial ones, through which foreign investors commit resources to a country on a medium-tolong-term basis. Foreign investors must carefully look at risks of the economic environment in which they commit resources. It is evident that corruption and the costs that it involves are part of the decision making of investors on an international basis. The role of FDI in driving growth is known to economic literature (Tanzi and Davoodi, 2002a). The significant technology and know-how that is part of FDI has a role in innovation. FDI is clearly a catalyst in improving the productivity of domestic investment. Finally, FDI represents an important means of financing invest-
3
We note, however, that interest rate spreads are indication not only of the degree of risk associated with money lending, but also with the degree of concentration of the banking sector. 4 Because there are no empirical studies that provide the value of this coefficient, we calculate it through a regression whereby interest rate spreads depend on CPI values (F-test and t-test confirm the significance of this relation).
cap3.qxd
22/05/2007
8.19
Pagina
54
54
MARCO ARNONE - ELENI ILIOPULOS
ment that may not be possible without contracting domestic consumption. Wei (1997) estimates that 1 point deterioration in the CPI causes an 11% decrease in FDI. It is important to remark that an equivalent increase of a tax on investments is estimated to have a negative impact on FDI of only 3.3%. Taxes are a lower cost than corruption for economic agents because there are no additional costs in connection with confidentiality and because they are established on an a priori basis, that makes them predictable. It is estimated that the less predictable corruption (the greater the dispersion of CPI) the greater the uncertainty of investors and the risk to investments (Wei, 1997). We show recent empirical evidence to confirm the relationship between corruption and FDI. To eliminate the effect of other income-related variables, again we split our worldwide data set into three subsets of advanced, emerging and developing countries, respectively. Figure 3.11 - Corruption and FDI, year 2002, advanced countries 0.08
the Netherlands
FDI/GDP, US $
0.07 0.06 0.05 0.04
Italy
0.03 0.02
Greece
0.01 0 0
2
4
6
8
10
12
© 2007 Vita e Pensiero
CPI
Source: Authors’ estimates from TI and IMF data. CPI=10 denotes absence of corruption while CPI=0 denotes highest corruption level.
Figure 3.11 shows that countries in which corruption is lower are characterized by higher FDI as a percentage of GDP. This means
cap3.qxd
22/05/2007
8.19
Pagina
55
55
CORRUPTION AND MACROECONOMIC PERFORMANCE
that international investors seem to prefer less corrupt countries as a destination for their lower-liquidity assets5. We show now the relationship between corruption and FDI as a percentage of GDP in emerging countries. High CPI levels are in association with high FDI as a percentage of GDP also for emerging countries. We notice that data present lower dispersion than for advanced countries and are more clustered along the trend line (except for the Czech Republic, that has both high FDI/GDP ratio and high corruption). This leads us to think that in emerging countries, for which bureaucracy provides fewer guarantees, both domestically and internationally, than for advanced countries, corruption seems to be a particularly important factor in the investment decisions of international investors. Figure 3.12 - Corruption and FDI, year 2002, emerging economies 0.12 Czech Republic
FDI/GDP, US $
0.1 0.08 0.06 0.04 0.02 0 -0.02
Indonesia 2
4
6
8
CPI
© 2007 Vita e Pensiero
Source: Authors’ estimates from TI and IMF data. CPI=10 denotes absence of corruption while CPI=0 denotes highest corruption level.
Finally, we consider a developing countries data set. We take the opportunity to emphasize that, particularly for this data set, we 5
We notice, however, that this data set excludes Luxembourg. Given its strategic role in the European Union, it is characterized by very high capital inflows that are accounted for as FDI in Luxembourg’s national accounting system. A small nation, Luxembourg has relatively small GDP. Therefore, it is clear that Luxembourg represents a particular exception as compared with other advanced countries and is not representative of this group.
cap3.qxd
22/05/2007
8.19
Pagina
56
56
MARCO ARNONE - ELENI ILIOPULOS
expect that the relationship between CPI and FDI may also be affected by variables like free capital movements and guarantees offered in individual countries. If in advanced countries open markets and solid international guarantees were seen to be significant factors, while capital market structure and guarantees were seen to be significant in emerging countries, these factors are key in developing countries. Figure 3.13 - Corruption and FDI, year 2002, developing countries 9.00E-02
Trinidad and Tobago
8.00E-02 FDI/GDP, US $
7.00E-02 6.00E-02 5.00E-02 4.00E-02 3.00E-02 2.00E-02 1.00E-02 0.00E+00 -1.00E-02
1
2
3
4
5
6
CPI
Source: Authors’ estimates from TI and WB data. CPI=10 denotes absence of corruption while CPI=0 denotes highest corruption level.
In line with our expectations, the relationship between CPI and FDI appears weaker and data show higher dispersion.
© 2007 Vita e Pensiero
2.1.2. Capital flows and exported corruption Frequently financial relations of multinationals based in several countries have brought to light factors characterizing domestic markets in countries around the world. Multinational corporations have began to confront corruption dynamics that create obstacles to certain markets more than others, and international investors have started taking these factors into consideration when making their investment decisions. The proliferation of multinational corporations has highlighted the fact that certain countries are more inclined to export corruption than others. Certain multi-
cap3.qxd
22/05/2007
8.19
Pagina
57
57
CORRUPTION AND MACROECONOMIC PERFORMANCE
national corporations are more inclined than others to bribe public officials in the country where they have their operations, thus ‘exporting’ corruption. This phenomenon involves primarily industrialized countries (that export capital worldwide) and emerging economies, to which capital flows are largely destined.
© 2007 Vita e Pensiero
Figure 3.14 - Exported corruption, countries where corporations tend to bribe public officials, years 1999, 2002 2002
1999
Rank
Country Data Set, Total
835
779
1 2 3 4 5 6 7 8 9 10 11 12 13 14 15 16 17 18 19 20 21
Australia Sweden Switzerland Austria Canada Netherlands Belgium United Kingdom Singapore Germany Spain France United States Japan Malaysia Hong Kong Italy South Korea Taiwan China Russia
8.5 8.4 8.4 8.2 8.1 7.8 7.8 6.9 6.3 6.3 5.8 5.5 5.3 5.3 4.3 4.3 4.1 3.9 3.8 3.5 3.2
8.1 8.3 7.7 7.8 8.1 7.4 6.8 7.2 5.7 6.2 5.3 5.2 6.2 5.1 3.9 -* 3.7 3.4 3.5 3.1 -**
OECD Convention 6
Ratified Ratified Ratified Ratified Ratified Ratified Ratified Ratified Not signed Ratified Ratified Ratified Ratified Ratified Not signed Not signed Ratified Ratified Not signed Not signed Not signed
Source: TI. Note: The question is related to the propensity of corporations from industrialized countries as listed in the table above to bribe public officials in emerging countries. A full score, that denotes no propensity to bribe payment, corresponds to 10.0; countries are ranked based on such score. * not considered as part of China in 1999. ** not included in 1999. 6
See chapter 6.
cap3.qxd
22/05/2007
8.19
Pagina
58
58
MARCO ARNONE - ELENI ILIOPULOS
Figure 3.14 lists countries from which capital flows originate, whose corporations are more inclined to make self-benefiting payments. In column 1 countries are ranked based on bribe-payment proneness; we notice that at the top of the list are those countries that are less prone to bribe foreign officials. At the bottom of the list we find countries whose corporations are more inclined to use bribery to obtain benefits in the foreign country where they have established their operations. Country ranking is based on country scores (see fourth and fifth column respectively). The last column illustrates whether individual countries ratified the OECD convention as described in chapter 6. This is an international convention which involves a large number of countries and makes a powerful stand against corruption. To verify if, in general, worldwide perceptions closely reflect domestic corruption, in figures 3.15 and 3.16 we represent the relationship between the two variables. If worldwide perceived corruption approaches CPI, interesting conclusions may be drawn. Figure 3.15 - Domestic corruption and exported corruption, year 1999 9 Exported corruption
8 7 6 5 4 3 2
© 2007 Vita e Pensiero
1 0 0
2
4
6
8
10
CPI
Source: Authors’ estimates from TI data. CPI=10 denotes absence of corruption while CPI=0 denotes highest corruption level. High scores of the exported corruption index denote low exported corruption.
cap3.qxd
22/05/2007
8.19
Pagina
59
59
CORRUPTION AND MACROECONOMIC PERFORMANCE
Figure 3.16 - Domestic corruption and exported corruption, year 2002
Exported corruption
9 8 7 6 5 4 3 2 1 0 0
2
4
6
8
10
CPI
© 2007 Vita e Pensiero
Source: Authors’ estimates from TI data. CPI=10 denotes absence of corruption while CPI=0 denotes highest corruption level. High scores of the exported corruption index denote low exported corruption.
Both figures graph a positive relationship between domestic corruption and corruption exported by individual countries. This means that countries in which corruption is high tend to export this corporate culture worldwide. We notice that data present low dispersion and the relationship has a high degree of persistence: this relationship holds strongly for both 1999 and 2002. The possibility that corrupt countries may spread corruption worldwide represents a danger for the international community as a whole. In this perspective, the importance of the role of international organizations and their commitment to combating corruption becomes of a particular significance. At the same time, the fact that domestic problems of corrupt states may reach other countries puts further pressure on countries to formulate policies to combat corruption. In this perspective, individual countries have responsibility with respect to the costs of domestic corruption that extends internationally. The fact that domestic corruption is exported from within one country by corporations with international operations highlights the responsibility of interna-
cap3.qxd
22/05/2007
8.19
Pagina
60
60
MARCO ARNONE - ELENI ILIOPULOS
tional organizations and individual governments with respect to the possibility of an expansion of corruption7. Combating corruption is a duty for all countries worldwide.
© 2007 Vita e Pensiero
2.2. Indirect causation: international trade Our earlier arguments on the role of foreign investment in growth may help understand the reason why empirical literature identifies a positive causal relationship between economic growth and international trade; capital and trade flows generally move in parallel. Moreover, if a country participates in international trade it will have the opportunity to specialize in the activity for which it has lower comparative costs than the rest of the world, hence gaining efficiency. Finally, access to new technology and knowhow fosters innovation and improves productivity. Deeply corrupt societies are generally characterized by constraints that tend to curtail access to foreign trade. Corrupt systems tend to favor conditions that allow personal benefits for elitist insiders to continue. Conversely, frequent relations with multinational corporations and other international investors jeopardize the secrecy that clouds bribery. International trade increases the number of outsiders in the economy, together with the probability that bribe practices be unveiled. Finally, international trade and finance are both under the control of international supervisors, such as international trade organizations (WTO) and international financial organizations (IMF, WB, FATF), that are generally under no individual country influence and are effective controllers. If we use the number of years that a country has had international trade operations as a proxy of an open country, it is possible to compute the effect of corruption on a country’s openness to international trade. Pellegrini and Gerlagh (2004) show that a one standard deviation decrease in corruption is associated with an increase in the openness of a country of 0.19, in turn associated with an increase in growth of 0.30 per cent per year.
7
See Arnone and Padoan (2007).
cap3.qxd
22/05/2007
8.19
Pagina
61
CORRUPTION AND MACROECONOMIC PERFORMANCE
61
2.3. Indirect causation: political instability The evaluation of the opportunity to invest in an economic activity should not be done without studying of environmental characteristics; expected returns, opportunity costs and risks must be weighted and compared at the same time. Hence, it is evident that political stability is one factor that international investors must take into consideration in the course of deciding where to commit their capital. In section 2.1 we emphasized that political risks are part of the ICRG components relating to investment risk. On the other hand, the relationship between growth and political stability reflects the fact that political risks inhibit economic activity. Not surprisingly, a decrease in corruption by one unit is associated with an increase in political stability of 0.06 percent and a final positive effect on growth of 0.14 per cent (Pellegrini and Gerlagh, 2004).
© 2007 Vita e Pensiero
2.4. Indirect causation: education A country’s literacy level is a determinant of economic growth. Tanzi and Davoodi (2002b) show that corruption is generally associated with low public revenues. An in-depth analysis of the effects of corruption on the public sector is beyond the scope of this section (see section 3.3). Nevertheless, it is evident that lower public revenues determine lower social expenditures. Empirical evidence shows that the higher the corruption levels, the lower the education budget (Mauro, 1998. See also Figures 3.22, 3.23 and 3.24 infra). In general, the higher the level of domestic corruption, the higher the budget for public activities that allow personal benefits; major benefits are generally obtained in sectors in which there is high concentration of economic and political power, and where money circulates in large amounts. Education has no such features, and is not favored in systems in which corruption is pervasive. Public spending on education is an economic and social policy choice: it represents the value that governments attribute to education. Given the strong relationship between economic growth and education, the importance that policymakers attribute to education systems has important implications for a country’s development: public spending may generally be representative of the quality of a country’s education system.
cap3.qxd
22/05/2007
8.19
Pagina
62
62
MARCO ARNONE - ELENI ILIOPULOS
© 2007 Vita e Pensiero
Figure 3.17 - Spending on education, year 2000 United Kingdom Uruguay United States Ukraine Turchia Turkey Trinidad and Tobago Tailandia Slovak Republic Senegal Russian Federeation Portugal Poland Philippines Paraguay Panama Pakistan Norway Niger New Zealand Morocco Moldova Mauritius Malaysia Madagascar Latvia Kenya Japan Giamaica Italy Israel Ireland Indonesia India Iceland Hungary Guatemala Greece Germany Georgia France Finland Ethiopia El Salvador Denmark Czech Republic Cote d’Ivoire Cote Rica Colombia Chile Canada Cameroon Brazil Bolivia Bangladesh Azerbaijan Austria Australia Argentina Angola 0.00
Source: TI.
Advanced countries average
Emerging countries average
Developing countries average
1.00
2.00
3.00
4.00
5.00
6.00
7.00
8.00
9.00
cap3.qxd
22/05/2007
8.19
Pagina
63
CORRUPTION AND MACROECONOMIC PERFORMANCE
63
In Figure 3.17 we show public spending on education for a worldwide-representative data set. Figure 3.17 graphs the education budget in various countries. Among advanced economies, Denmark has the highest education budget. Conversely, at the bottom of the list, Japan and Greece public spending on education are the lowest, with spending levels as a percentage of GDP lower than the average in developing countries. Amongst emerging economies, Israel’s is the highest spending on education, with levels significantly stronger than the advanced countries’ average. In the case of developing economies, Tunisia shows spending levels on education that are much higher than the average in both developing and advanced countries. Empirical studies find that the number of years spent on specialization studies decreases as domestic corruption worsens. In particular, Pellegrini and Gerlagh (2004) find that a one standard deviation decrease in corruption is associated with an increase of half a year of schooling of people aged over 25. This, in turn, leads to an increase in growth of 0.06 percent per year. While this result is robust with respect to the direction of causation in the relationship between corruption and education, our prior arguments on the allocation of talents (chapter 2) also suggest that, in turn, very corrupt societies favor education schemes that facilitate widespread corruption thanks to rent-seeking.
© 2007 Vita e Pensiero
2.4.1. Education and corruption We turn our attention now to the direction of causation that characterizes the existing relationship between corruption and education. We emphasized how lower public spending on education is one effect of corruption. Nevertheless, it is important that we also emphasize how education budgets (and education levels as such) are not affected by corruption only, but that education is one determinant of domestic corruption. Education impacts on corruption: high education levels are associated with good quality politicians and institutions. Educated and informed citizens can choose good policy makers and monitor their activity and performance. These characteristics have a strong impact on the quality of institutions and are effective constraints against bad governance. This, in turn, acts as an incentive to improve the quality of governance, with subsequent positive
cap3.qxd
22/05/2007
64
8.19
Pagina
64
MARCO ARNONE - ELENI ILIOPULOS
© 2007 Vita e Pensiero
effects on domestic corruption (see chapter 4). Hence, it is reasonable to think that ‘correlation between development and good political outcomes occur because more education improves political institutions’ (Glaeser and Sanchs, 2004). Our earlier arguments find support in recent empirical evidence from the United States (Glaeser and Sachs, 2004). If we proxy the level of education with variables other than public spending on education, the relationship between education and corruption is confirmed again. A significant relationship exists between the number of corrupt practices and the number of citizens with only a primary level of education. To highlight that the level of education is one determinant, and no mere consequence of domestic corruption, we may use alternative indicators. If we proxy schooling results with the ratio of qualifications obtained to the numbers of students enrolled, this correlation is validated again. The level of schooling is finally proxied using the degree of ‘congregationalism’ 8 in various US states. ‘Congregationalist’ states have historically spent more on education and have higher levels of schooling today. The correlation between education and corruption is confirmed yet again. We notice, however, that congregationalism may affect corruption also through causation independent of the level of education. In Figure 3.18 we show recent empirical evidence from an OECD country data set. Figure 3.18 shows domestic corruption and the percentage of population with a secondary school qualification. Data show that low domestic corruption is associated with a high percentage of population with a secondary school qualification.
8
Congregationalism is a type of Protestant church organization in which each congregation, or local church, has free control of its own affairs. America’s congregationalists were always prominent in education, but the institutions they founded Harvard, Yale, Williams, Amherst, Oberlin, and many others – have generally been free from sectarianism. (The Columbia Electronic Encyclopedia, Sixth Edition, 2003, Columbia University Press, www.cc.columbia.edu/cu/cup/ ).
cap3.qxd
22/05/2007
8.19
Pagina
65
65
CORRUPTION AND MACROECONOMIC PERFORMANCE
CPI
Figure 3.18 - Corruption and population with a secondary school qualification, year 2003 11 10 9 8 7 6 5 4 3 2 1 0 0
10
20
30
40
50
60
Secondary education, % population Source: Authors’ estimates from TI and OECD data. CPI=10 denotes absence of corruption while CPI=0 denotes highest corruption level.
© 2007 Vita e Pensiero
2.5. Direct and indirect causation: corruption and growth Now that we have investigated both the direct and indirect effects of corruption, the latter appear as one of the most significant factors having an impact on economic growth. According to Pellegrini and Gerlagh (2004), a one standard deviation decrease in corruption leads to an increase in growth of 1 per cent per year, for a given initial income level. The long-term income level increases by 140 percent. Finally, for what concerns the long term, a one standard deviation decrease in corruption levels increases the long-term level of investment by 4.86 per cent points, consistent with Mauro’s (1995) findings. It further increases schooling by 2.21 years (for the population more than 25 years old), increases the openness coefficient by 0.30 and increases the political instability index by 0.06.
cap3.qxd
22/05/2007
8.19
66
Pagina
66
MARCO ARNONE - ELENI ILIOPULOS
© 2007 Vita e Pensiero
3. Inflation With a view to providing a general analysis of the economy, we may not overlook inflation. This variable plays a fundamental role in the economy because it is an index of citizens’ purchasing power. If inflation is high, prices grow at a steady pace and citizens experience lower real income, unless nominal income grow also at parallel steady pace. However, negative inflation, or deflation, is not necessarily positive for the economy because deflation generally characterizes recessions. These examples, albeit too few to illustrate diverse dynamics in connection with inflation, are useful to understand the importance of this variable. When no authority controls inflation, price levels are established as a result of the interaction of demand and supply at an aggregate level; an increase in demand that is not accompanied by an equivalent increase in supply, (or negative supply shocks that are not accompanied by decreases in demand), have an upward effect on prices. Positive sectoral supply shocks that are not accompanied by correspondent increases in demand (or contractions of aggregate supply) have a downward effect on prices. It is clear that, if no authority monitors it, inflation may reflect demand and supply shocks and be very volatile. Among its goals, monetary authorities set inflation targets and pursue this through specific monetary policy instruments. This is the principal responsibility of central banks in the majority of countries9. Monetary policy is an effective policy instrument with effects that are visible even in the short term. Because of this, monetary policy operations must be in the hands of extremely competent authorities, characterized by independence, accountability and transparency (see chapter 5). If monetary authorities are corrupt, the pursuit of objectives as established is profoundly jeopardized in the definition of the objectives and in the policy measures necessary to achieve them. It is clear that the effects of corruption can be distinguished based 9
See Arnone, Laurens and Segalotto (2006b). It should be added that many central banks are also in charge of financial stability and, often, banking supervision. In this context, independence of the monetary authority extends to banking supervision, that we address in chapter 4.
cap3.qxd
22/05/2007
8.19
Pagina
67
67
CORRUPTION AND MACROECONOMIC PERFORMANCE
on the goals of the entities involved and the instruments used to achieve them. Nevertheless, recent studies (Lambsdorff and Schinke, 2002) emphasize that corruption generally leads to monetary authorities having to adopt measures in favor of higher inflation through the issuance of additional base money. Sometimes, this new money in excess is aimed at allowing selfappropriation of the same monetary authorities. This happened in 1979 with Zaire’s deputy central banker. Corruption may also aim at obtaining confidential information: Lambsdorff and Schinke (2002) mention that in 1999 Brazil’s central banker Francisco Lopes gave advance warning to a group of private banks before an eight percent devaluation, so that this devaluation benefited them; the same authors mention other instances related to governor Lopes, who was charged with fraud in 2000. We may also mention situations in which certain central banks are at the center of very tight connections (which should, however, be kept distinguished as such from corruption in a strict sense); this may cause excess ‘lender of last resort’ behaviors at times of financial distress or crises. Figure 3.19 - Corruption and inflation, 2000-2004, 2004
© 2007 Vita e Pensiero
CPI
11 10 9 8 7 6 5 4 3 2 1 0 -10
0
10
20
30
40
50
Inflation Source: Authors’ estimates from TI and IMF data. CPI=10 denotes absence of corruption while CPI=0 denotes highest corruption level.
cap3.qxd
22/05/2007
8.19
Pagina
68
68
MARCO ARNONE - ELENI ILIOPULOS
Sometimes it is beneficial for certain actors in the economy to lower monetary stocks. Nevertheless, ‘it is easier to increase one’s share when the whole cake increases’ (Lambsdorff and Schinke, 2002). Empirical evidence confirms these arguments. In Figure 3.19 we show the relation found between corruption (CPI) and inflation. Data show that as corruption decreases (the CPI goes up), inflation decreases.
4. The public sector Our analysis so far has emphasized the effects of corruption on markets and economic growth, with particular attention to the behavior of private actors in the economy. We now shift the focus of our analysis to corruption that involves both public and private entities. In these cases corruption results in distorsions that are not only a constraint to private activities, but also a charge for the public sector as such.
© 2007 Vita e Pensiero
4.1. Public revenues and domestic corruption It is reasonable to think that in bureaucracies deeply pervaded by corruption a share of public resources is appropriated by public officials. This view is supported by empirical evidence: data show that domestic corruption is negatively correlated to public revenues. If corruption increases in a system, the risk of being caught in corrupt deals diminishes and corruption among (self-interested insider) public officials increase to the detriment of public revenues. Tanzi and Davoodi (2002b) estimate that a unit point deterioration in the corruption index causes a 1.5 percent decrease in total public revenues (ratio to GDP), a decrease in tax revenues by 2.7 percent (ratio to GDP) and an increase by 1.3 percent of non-tax-revenues (ratio to GDP). Figure 3.20 shows the relationship between CPI and public revenues (in percent of GDP). Empirical evidence includes few advanced countries (easily identifiable in the Figure). CPI for advanced countries is generally higher than for other countries. CPI is also high for Singapore, an outlier with respect to the amount of public revenues to GDP. Excluding these outliers, the relationship is very strong and data show little dispersion.
cap3.qxd
22/05/2007
8.19
Pagina
69
69
CORRUPTION AND MACROECONOMIC PERFORMANCE
CPI
Figure 3. 20 - Public revenues (in percent of GDP) and CPI
10 9 8 7 6 5 4 3 2 1 0 0.00
Singapore
New Zealand
Canada
Denmark Switzerland United States
10.00
20.00
30.00
40.00
50.00
Public revenues, % GDP
© 2007 Vita e Pensiero
Source: Authors’ estimates from TI and IMF data. CPI=10 denotes absence of corruption while CPI=0 denotes highest corruption level.
We now turn to the relationship between tax revenues and corruption. Fiscal revenues are part of total public revenues and include all state tax collection. Tanzi and Davoodi (2002b) suggest a closer relationship than between public revenues and CPI. Figure 3.21 shows recent empirical evidence: data show very low dispersion with values concentrating closer to the general trend line. Few are the exceptions to this relation: Singapore, Canada and New Zealand are characterized by very low corruption with respect to the ratio of tax revenues to GDP. These countries are significant exceptions compared with other countries in this data set, but belong to a group of countries with much higher GDP. Available empirical evidence is based on very few advanced countries.
cap3.qxd
22/05/2007
8.19
Pagina
70
70
MARCO ARNONE - ELENI ILIOPULOS
CPI
Figure 3.21 - Tax revenues, year 2000, and corruption, year 2002 10 Singapore 9 8 Canada 7 Chile 6 5 4 3 2 1 0 0.00 10.00
New Zealand United States
20.00
30.00
40.00
50.00
Tax revenues/GDP
© 2007 Vita e Pensiero
Source: Authors’ estimates from TI and IMF data. CPI=10 denotes absence of corruption while CPI=0 denotes highest corruption level.
Certain taxes are more easily affected by domestic corruption. Sales taxes and excise taxes are established on an a priori basis and are collected centrally by the tax administration system. Individual income taxes may be more easily the subject of negotiation and are more easily affected by domestic corruption. Tanzi and Davoodi (2002a) estimate that a unit increase in corruption is associated with a decrease in income taxes (ratio to GDP) by 1.8 percent and a decrease in indirect taxes (ratio to GDP) by 1.2 percent: higher corruption is associated with a higher decrease in income taxes. That income taxes decrease in favor of higher taxes other than on income is not devoid of implications on redistribution; tax systems neutrality is questioned and income distribution policies are strongly distorted. Finally, we note that the higher the personal benefits (via tax extortion) for public officials, the more they tend to change tax collection in favor of instruments that are of advantage to them. However, in order to ensure stable tax revenues, corrupt countries tend to rely more on indirect taxes than on income tax. There is no empirical evidence supporting the relationship
cap3.qxd
22/05/2007
8.19
Pagina
71
CORRUPTION AND MACROECONOMIC PERFORMANCE
71
between sales taxes and domestic corruption (Tanzi and Davoodi, 2002a). However, the situation is more complex in the case of international trade: to confirm the fact that the association of customs regulations and corruption is empirically supported, statistical evidence shows a negative relationship between domestic corruption and efficiency of value added taxes (VAT efficiency)10 (Tanzi and Davoodi, 2002a). However, this relationship is statistically weak.
© 2007 Vita e Pensiero
4.2. Public spending In the paragraph above we have highlighted the fact that a negative relationship exists between the level of corruption in a country and public revenues: in very corrupt countries, part of public revenues are appropriated by self-interested state officials. The fact that the level of public resources is lower than what they would be in the absence of corruption implies that public spending decisions are influenced by domestic corruption. There is empirical evidence that supports the view that corruption affects public spending decisions in that it distorts resource allocation and the composition of public spending. Corruption has an impact on the provision of public services, while it causes higher costs and limits services. This is largely due to less resources being available to national and local governments. Costs may remain unchanged, but service quality may be affected by lower revenues. Based on diverse bribe-taking methods, Shleifer and Vishny (1993) make a distinction between corruption with theft from the state and corruption without such theft. In the first case, the cost of corruption impacts citizens because it raises the effective price of the service bribed. The case of corruption without theft is when the cost of corruption is in the form of an appropriation of public resources and has a secondround effect on citizens: through higher service price, lower service quality or an increase in public deficit. When public service prices increase and service quality is compromised, in both cases incentives are created that lower citizens’ demand for public services. Gupta, Davoodi and Tjongson (2002) 10
If we define VAT efficiency in terms of the ratio of VAT revenues and GDP divided by the VAT standard rate, we obtain a value that indicates the degree of efficiency of the VAT systems.
cap3.qxd
22/05/2007
© 2007 Vita e Pensiero
72
8.19
Pagina
72
MARCO ARNONE - ELENI ILIOPULOS
show that countries pervaded by high degrees of corruption (and inefficient public services) have on average 26 percent more students dropping out of school (relatively to less corrupted countries). Moreover, the empirical evidence is that a negative correlation exists between the quantity of public service and domestic corruption. Additionally, empirical evidence supports a further relationship between the quality of public healthcare and education, on the one hand, and corruption on the other. As we earlier discussed with regard to choices of different tax instruments, an incentive exists that drives politicians to allocate collective resources to where they may be better benefited personally and secrecy may be better maintained with respect to corrupt deals. The possibility to profit substantially is also at the basis of engaging in rent-seeking activities (see chapter 2). The possibility to extract rents in a sector exists if competition is low and exact product values are difficult to establish. This typically happens with advanced technology (Shleifer and Vishny, 1993) and where the consequences of discretion of public officials are not openly visible. Supporting this argument, empirical evidence shows a positive relationship between military spending and domestic corruption: high levels of corruption are generally associated with high military spending (Gupta, de Mello and Sharan, 2002; Gupta, Davoodi and Tjongson, 2002). The other side of the coin in a trend of corrupt goverments to allocate public resources to sectors where rent extraction possibilities are enhanced, is to neglect public service sectors in which rent extraction possibilities are lower. Hence, we may infer that public spending is particularly low in these sectors. Empirical studies support this assumption and find that corrupt countries spend very little on maintenance operations (Tanzi and Davoodi, 2002b). This results from lower revenue to finance these expenses or, even worse, from resource allocation that favors tenders for new projects versus maintenance works. Healthcare and education suffer the negative effects of corruption most; these are the sectors where corrupt governments typically cut finance (chapter 5 offers an in depth analysis of the adverse effects of corruption on revenues needed to finance social spending). Several studies confirm that a negative relationship exists between healthcare spending and corruption (Mauro, 1998); and between domestic corruption and spending on education
cap3.qxd
22/05/2007
8.19
Pagina
73
73
CORRUPTION AND MACROECONOMIC PERFORMANCE
(Mauro, 1998; Tanzi and Davoodi, 2002b). In particular, Mauro’s (1998) regression shows that a one standard deviation improvement in the corruption index leads education expenditure to rise by over 6 percentage points of total government consumption expenditure. This relationship is robust with respect to various functional forms and holds for various data subsets. In Figure 3.22 we show the relationship between CPI and public spending on education in advanced countries; we control for income by splitting the sample: richer countries generally tend to allocate more resources than other countries. This data set is not as extensive as the data sets used earlier because internationally comparable data on fiscal policy are relatively scarce. Figure 3.22 - Corruption, year 2002, and public spending on education, year 2000, advanced countries 12 10
CPI
8 6 4 2 0 0.00
2.00
4.00
6.00
8.00
10.00
Spending on education, % of GDP
© 2007 Vita e Pensiero
Source: Authors’ estimates from TI and IMF data. CPI=10 denotes absence of corruption while CPI=0 denotes highest corruption level.
The relationship between CPI and spending on education holds strongly in other country groups; less corrupt countries spend more on education. We now represent the same relationship for emerging economies. This subset is generally characterized by a spending-on-education-to-GDP ratio lower than advanced countries. Corruption levels are also generally higher in these countries (except for Chile).
cap3.qxd
22/05/2007
8.19
Pagina
74
74
MARCO ARNONE - ELENI ILIOPULOS
Figure 3.23 - Corruption, year 2002, and public spending on education, year 2000, emerging economies 8 7
Chile
6 CPI
5 4 3 2 1 0 0.00
1.00
2.00
3.00
4.00
5.00
6.00
7.00
8.00
Spending on education, % of GDP Source: Authors’ estimates from TI and IMF data. CPI=10 denotes absence of corruption while CPI=0 denotes highest corruption level.
We conclude our analysis of public spending showing the same relation for the developing countries data set (see Figure 3.24). Figure 3.24 - Corruption, year 2002, and public spending on education, year 2000, developing countries 6 5
CPI
4
Uruguay
3
© 2007 Vita e Pensiero
2 1 0 0.00
1.00
2.00
3.00
4.00
5.00
6.00
7.00
8.00
Spending on education, % of GDP Source: Authors’ estimates from TI and IMF data. CPI=10 denotes absence of corruption while CPI=0 denotes highest corruption level.
cap3.qxd
22/05/2007
8.19
Pagina
75
75
CORRUPTION AND MACROECONOMIC PERFORMANCE
Figure 3.24 shows that an adverse relationship between public spending on education and the degree of domestic corruption also holds for developing countries. Nevertheless, data show higher dispersion than for prior subsets. This reflects other factors affecting public spending on education in these countries. 4.3. Public investments Corruption and public investments have often coexisted. Large public projects and development of infrastructure create the possibility of high profitability for both bid-winning private contractors and bribe-taking public officials. Public tender processes are often very complex and based on the calculation of many uncertain factors; because of this, the likelihood that cases of corruption are unveiled can be very low. Empirical evidence finds a correlation between public investment spending (in percent of GDP) and domestic corruption; the higher corruption, the higher is spending on investments (Tanzi and Davoodi, 2002b).
© 2007 Vita e Pensiero
CPI
Figure 3.25 - Corruption, year 2002, and public investments, year 2000 10 9 8 7 6 5 4 3 2 1 0 0.00
Singapore
10.00
20.00
30.00
40.00
50.00
Public investments, % of GDP Source: Authors’ estimates from TI and IMF data. CPI=10 denotes absence of corruption while CPI=0 denotes highest corruption level.
cap3.qxd
22/05/2007
8.19
Pagina
76
© 2007 Vita e Pensiero
76
MARCO ARNONE - ELENI ILIOPULOS
Figure 3.25 shows that high corruption is associated with high public investment spending (in percent of GDP). We note that this correlation is often hidden behind a so-called investment bias (Tanzi and Davoodi, 2002b), or a trend in favor of public investment projects to the detriment of public consumption spending, on the basis that investments are a driver of a country’s development. Nevertheless, not all infrastructure developments are necessary investments, nor do all public contract awards reflect quality and merit criteria. Public contracts represent earning opportunities for private contractors; this possibility is often on condition that a commission is paid to public officials. As for public spending (see previous paragraph) the question arises as to who should bear this additional cost. The only alternative options are if the bid for the contract includes the cost of this commission, if upward adjustments are allowed, or no strict quality requirements are part of the bid package. The final result is either higher costs or lower quality. Another consequence of the interaction of public investments and corruption is a substantially lower capital productivity. We may mention public investments that are either white elephants, or investment projects with characteristics other than those required or cathedrals in the desert, large construction in non strategic locations, or locations where no such construction is needed, destined to be underutilized. Corruption also causes lower returns on existing capital. Given the high persistence of corruption there is a high likelihood that in corrupt economies existing capital is either contaminated by corruption, or results from corruption. We also notice that, as we discussed earlier, corruption is associated with low spending on maintenance of existing infrastructure: one implication is that returns on this capital drop drastically. Finally, we recall that there are cases when it is a deliberate choice not to execute any maintenance and cause existing infrastructure to deteriorate, so that new contracts may be awarded. 4.4. Size of the public sector Corruption between the public and private sectors is associated with discretionary and monopoly powers of government and bureaucracy. Many, including Nobel-prize winning economist Gary Becker assume that a positive relation exists between a coun-
cap3.qxd
22/05/2007
8.19
Pagina
77
77
CORRUPTION AND MACROECONOMIC PERFORMANCE
try’s public sector size and domestic corruption. Becker went so far as to state that corruption would be eliminated completely if the state was abolished (Tanzi, 2002). Setting aside the question of the impossibility of abolishing the public sector, we turn our attention to verify if this view is correct. It is well known that Scandinavian countries are characterized by significant state intervention and low corruption. To assess this commonly held view, we use the level of public revenues per individual country to proxy public sector size and public intervention. Figure 3.20 as presented above showed how, contrary to public opinion, large public revenues are associated with low corruption; also if we use tax revenues to proxy the degree of public intervention we obtain similar results: higher tax revenues are associated with lower corruption. Public revenue is also a reasonable proxy for public sector size: the larger the public sector, the greater the revenues needed to finance it. Figure 3.20 graphed how state revenues and corruption are inversely correlated; nevertheless, that data also reflect the impact of income in various countries. To control for this influence, we now consider another set of data: this data set includes OECD countries and the data is more recent. Figure 3.26 - Corruption and public sector size, year 2002, OECD countries 12 10
CPI
8 6 Italy
© 2007 Vita e Pensiero
4 2 0 0
10
20
30
40
50
60
Government revenues, % of GDP Source: Authors’ estimates from TI and WB data. CPI=10 denotes absence of corruption while CPI=0 denotes highest corruption level.
cap3.qxd
22/05/2007
78
8.19
Pagina
78
MARCO ARNONE - ELENI ILIOPULOS
© 2007 Vita e Pensiero
Figure 3.26 shows that the negative relation between state revenues and corruption holds also for this data set, though less so. Empirical evidence is not sufficient to prove causation; nevertheless, it is sufficient to reject current opinion that large public sector size help develop corruption. We have argued that the roots of corruption are not so much in the size of the public sector, as in the discretionary powers of public officials, in the bad management of possible conflicts of interest, and in low quality governance. Recent studies have clearly identified the (positive) impact of a transparent fiscal policy among all variables that affect domestic corruption. Hameed (2005) emphasizes how several effects of corruption may be curbed through transparent fiscal policy. Hameed finds that fiscal transparency has a positive impact on corruption; higher fiscal transparency is associated with greater “control of corruption” with a significant and positive coefficient. Once control variables are added, the coefficients are smaller but still significant. He shows that if countries in the lowest 10th percentile of transparency improve their transparency up to the highest 10th percentile average, they would see an improvement in the “control of corruption” index from -0.8 to 0.04. We note that in this regression corruption is proxied by the World Bank’s Corruption Control Index, which is a good proxy 11 of the CPI. Figure 3.27 shows the relationship between the fiscal transparency index and CPI, to further confirm the relationship between corruption and fiscal transparency. Empirical evidence confirm that an increase in corruption (a CPI decrease) is associated with lower fiscal transparency.
11
The ‘control of corruption’ variable and CPI have a correlation coefficient of 0.96.
cap3.qxd
22/05/2007
8.19
Pagina
79
79
CORRUPTION AND MACROECONOMIC PERFORMANCE
CPI
Figure 3.27 - Corruption and fiscal transparency, year 2004 10 9 8 7 6 5 4 3 2 1 0
Uruguay
Brazil 0
0.2
0.4
0.6
0.8
1
Fiscal transparency Source : Authors’ estimates from TI and IMF data. CPI=10 denotes absence of corruption while CPI=0 denotes highest corruption level.
© 2007 Vita e Pensiero
5. Economic inequality Corruption favors the interests of those who know the rules of a game in which there is a concentration of power and money; those who have no access to information in the hands of a close élite, nor sufficient capital to pay bribes, nor hold strategic positions are irreparably not favored compared with those who have part in these dynamics. The insider-outsider structure that comes to be inevitably determined results in vicious circles that tend to favor stronger strata of society, who have access to large resources or hold strategic positions. In both cases, insiders have access to resources that outsiders are denied (outsiders are those individuals lacking personal “connections”, access to exchanges of favors and benefits). We may hence assume that one main characteristic at the basis of corruption dynamics consists precisely in the disparity of conditions faced by different economic actors. Given different initial conditions and ‘rules of the game’, income distribution reflects the same rules that originated it; stronger actors have access to larger resources while weaker actors are excluded.
cap3.qxd
22/05/2007
8.19
Pagina
80
80
MARCO ARNONE - ELENI ILIOPULOS
Supporting these arguments, Figure 3.28 shows how countries in which economic inequality is high are also the most corrupt. To illustrate economic inequality levels we use empirical evidence as provided by values of the Gini coefficient for a worldwide-representative data set. The high Gini coefficient indicates a broader difference between income of richer versus poorer citizens and reflect higher inequality. This relationship is supported in that it holds also for data sets of advanced, emerging and developing countries separately, and is particularly strong for advanced countries. Figure 3.28 - Economic inequality and corruption, years 1984-2002 80 Gini coefficient
70 60 50 40 30 20 Italy
10 0 0
2
4
6
8
10
12
CPI
Source: Authors’ estimates from TI and WB data. CPI=10 denotes absence of corruption while CPI=0 denotes highest corruption level.
© 2007 Vita e Pensiero
6. Corruption and persistence So far in our analysis we have more than once mentioned that corruption is highly persistent. This means that domestic corruption is stable over time and does not vary significantly on a year-to-year basis. Persistence is due to the fact that corruption is the fruit of multiple coexisting factors, many of which are of an environmental nature, and is not significantly subject to influence from one-
cap3.qxd
22/05/2007
8.19
Pagina
81
81
CORRUPTION AND MACROECONOMIC PERFORMANCE
time, ad hoc policies with temporary effects. Economic, legal, and social policies must have permanent effects to impact socio-economic environments; once the environment has changed, the spreading of corruption is curbed by changing agents’ incentives, hence driving changed behaviors of agents in the economy. Figure 3.29 shows the relationship between CPI in 1995 and in 2004, that supports our arguments above. The relationship between CPI in 1995 and CPI in 2004 is very strong and data present very low dispersion around the trend line. This means that CPI values change little on a year-to-year basis with a stable trend of this index. That corruption is persistent in time allows us certain simplifications that facilitate our analysis. If no empirical evidence is available relative to the year for which CPI values are known, a comparison is nevertheless reasonable with neighbouring years; over time, values change very little and the fundamental relationship is stable. Figure 3.29 - CPI in 1995 and 2004: a comparison 10 9 8
CPI 2004
7 6 5 4 3 2 1 © 2007 Vita e Pensiero
0 0
1
2
3
4
5
6
7
8
9
10
CPI 1995
Source: Authors’ estimates from TI data. CPI=10 denotes absence of corruption while CPI=0 denotes highest corruption level.
Back to the Summary
cap4.qxd
22/05/2007
8.20
Pagina
82
CHAPTER IV
© 2007 Vita e Pensiero
Governance, corruption, and effects on institutions
In chapters 2 and 3 we discussed two types of costs of corruption: in chapter 2 we analyzed cost for markets and firms, and in chapter 3 the macroeconomic cost of corruption. These costs are largely on a direct, measurable basis. We now turn to an analysis of the relationship between corruption and institutions. We will look at corruption and society in chapter 5. Corruption has an impact on social organizations within both the public and private sector. When it does affect a public-private sphere, corruption may appear as an obstacle to the implementation of individual choices – hence, of individual freedoms, as we pointed out in chapter 2. In this case corruption affects bureaucracy and finds fertile ground in the discretion that public officials may enjoy. Corruption may also appear in the form of state capture or grand corruption (see chapter 1) and hinder the decision-making process of government and regulatory agencies. Distortions resulting in corrupt political and administrative systems have a strong adverse impact on the effectiveness of government policies and are a burden for society as a whole. If on the one hand bad governance is at the root of the development of corruption (as one of its main causes, Pellegrini and Gerlagh, 2004), on the other hand, corruption has an adverse impact on the quality of governance. In chapter 1 we highlighted that, in the relationship between governance and corruption, the main causal direction goes from the former to the latter, but the feedback effects from corruption to governance should not be underestimated. Good quality of institutions is reflected in efficient controls that may prevent vital state organizations from malfunctioning. If governmental agencies are held accountable for what they do, this limits discretion of public officials, and therefore the devel-
cap4.qxd
22/05/2007
8.20
Pagina
83
© 2007 Vita e Pensiero
GOVERNANCE AND INSTITUTIONS
83
opment of episodes of corruption finds substantial obstacles. However, very often, institutions can avoid being held accountable for their performance by hiding behind a system of rules not transparent to citizens: complexity of regulations may reflect low transparency. Difficulties in evaluating the performance of policymakers enable self-interested public officials to pursue their individual ends. In a system where corruption is pervasive and public officials pursue their individual interests, regulations governing society reflect bad governance. In these circumstances the laws appear not to oppose corruption and low-quality institutions. Vicious circles could only be interrupted through difficult and wide-ranging reforms. Sometimes reforms may not take place and institutions experience decline. In other cases, attemps at reforms affect only limited areas of public life and produce effects that are only temporary and partial. These arguments highlight the importance of regulatory and supervisory agencies. Complex institutional apparatuses are often difficult to comprehend for the general public. Supervisors may be established with the explicit objective of preventing degeneration and power abuse by an élite of insiders to whom the ‘rules of the game’ are known. Financial supervision must ensure that the behaviors of financial and economic actors is correct and competitive market rules are implemented. For this, it is necessary that external influence from political or economic power be eliminated or minimized. Supervision must hence conform to such principles as independence, autonomy and competence: only in its independence and autonomy supervisors may make decisions that are the fruit of clear criteria and without political influence. Autonomy must include sufficient financial resources to enable high quality structures and staff in support of supervision. Also, autonomy must include instruments of control and repression to enable effective supervision, prevention and punishment of deviant behaviors. Finally, supervisory authorities whose members are “of a high and recognized professional profile”1 can perform their duties under no external influence. Should such conditions
1
For instance, this is required by the Italian law for the appoinment of members to Italy’s Antitrust Authority.
cap4.qxd
22/05/2007
8.20
Pagina
84
84
MARCO ARNONE - ELENI ILIOPULOS
not be enforced, the quality and authoritativeness of supervisory authorities is compromised (Forti, 2005). Our analysis in this chapter aims primarily at highlighting the relationship between perceived corruption and market supervision and regulation; later in this chapter, we will broaden further our focus to an analysis of the relationship between corruption and public-governance-related variables.
1. Supervision and regulation The market consists of a set of rules, institutions and agents that interact mutually to achieve efficiency in the management of resources. In chapter 2 we emphasized how free demand and supply interaction is not a sufficient condition for perfect competition; market failures and anti-competitive behaviors are a serious threat to market functioning. Correctly functioning market dynamics depend upon existing efficient regulations and correct supervision. These conditions are both of the utmost importance; together with the existence of a specific authority to ensure that regulatory and supervisory duties are performed in an efficient manner. This section is designed to assess further the relationship between a country’s domestic corruption and the quality of regulation and supervision. As we discussed earlier, quality of market regulation may significantly impact a country’s domestic corruption at the same time that corrupt regulators show a general propensity to establish inefficient regulations that tend to favor abuse of power. The same logic applies to the quality of supervision.
© 2007 Vita e Pensiero
1.1. Regulatory quality Low quality institutions tend to establish laws that reflect their quality. Bad regulations, i.e. unclear and not transparent, favor dynamics that are at the basis of widespread corruption. To quantify regulatory quality in a cross-country analysis, we use a World Bank index (Kaufmann, Kray and Mastruzzi, 2004). The regulatory quality indicator reflects not only market regulatory quality, but also provides a broader focus on a general domestic regulatory environment as a proxy of market regulatory quality.
cap4.qxd
22/05/2007
8.20
Pagina
85
85
GOVERNANCE AND INSTITUTIONS
We show both the CPI and the regulatory quality index to identify the relationship, if any, between corruption and regulatory quality. The evidence in Figure 4.1 shows that in a worldwide sample, good regulatory quality is associated with low corruption (high CPI levels). Supporting the robustness of this correlation, data present very low dispersion around the trend line. Figure 4.1 - Regulatory quality and corruption
Quality of regulation
3.00 2.00 1.00 0.00 0
2
4
6
8
10
12
-1.00 -2.00 -3.00 CPI
© 2007 Vita e Pensiero
Source: Authors’ estimates from TI data, and Kaufmann, Kraay and Mastruzzi (2005). CPI=10 denotes absence of corruption while CPI=0 denotes highest corruption level.
Like many other governance variables, regulatory quality shows strong path-dependence, i.e. it tends to remain stable over time. This is due to the fact that governance variables depend on environmental and institutional factors that evolve slowly. Changes have limited material impact in the short term even in connection with reforms that are radical and sudden. In Figure 4.2 we show the regulatory quality indicator in 1996 and 2002, based on a geographic breakdown for an analysis of the dynamics of this variable over time. We may note that countries in Western Europe, North America and transition economies experienced a widespread, material improvement in regulatory quality for the period presented. There was no regulatory quality improvement in Latin America, Asia-Pacific and Sub-Saharan Africa.
cap4.qxd
22/05/2007
8.20
Pagina
86
86
MARCO ARNONE - ELENI ILIOPULOS
Figure 4.2 - Regulatory quality over time Global Governance Indicators: Regularity quality 2.00 1.57
1.54 1.50 1.09
1.22
1.00 0.50
0.29
0.17
0.05
0.00
0.00 -0.02
-0.10
-0.08
-0.18 -0.13
-0.31
-0.50
-0.58 -0.63 -1.00 Western Europe
North America
South America Transition economies 1996
Asia-Pacific Middle East and Sub-Saharan North Africa Africa
Caribbean
2002
Source: Authors’ estimates from Kaufmann, Kraay and Mastruzzi (2004).
© 2007 Vita e Pensiero
1.2. Quality and quantity of regulation Legal systems characterized by a high number of laws and regulations may prove inefficient. If, on the one hand, there is a need for laws that are binding for institutional and individual behavior and their relationships, on the other hand constraints on actors should not be too many. Too many constraints are reflected in overburdened bureaucracy that cause slower procedures and reduce freedom of agents. Excess regulation may indeed conceal that a system is incapable of meeting with citizens’ needs. Systems that are unable to address complex issues tend to address specific matters with ad-hoc rules. Necessary institutional reforms and adaptation to new problems slow down in this context. In chapter 2 we emphasized how highly complex regulatory systems may impose high costs on firms, representing a significant impediment to the development of their business. In Figure 4.3 we show the relationship between regulatory quality and quantity of regulation. Data show that, in general, regulatory quality and quantity of regulation are negatively correlated. The regulation variable used below is a Freedom House-built index of civil and economic freedom.
cap4.qxd
22/05/2007
8.20
Pagina
87
87
GOVERNANCE AND INSTITUTIONS
Figure 4.3 - Quality and quantity of regulations, year 2002
Amount of regulation
6 5 4 3 2 1 0 -3.00 -2.50 -2.00 -1.50 -1.00 -0.50 0.00
0.50
1.00 1.50 2.00 2.50
Quality of regulation
© 2007 Vita e Pensiero
Source: Authors’ estimates from Kaufmann, Kraay and Mastruzzi (2005) and Freedom House.
The chart shows that the higher the quantity of legislation (the higher our regulation variable) the lower the regulatory quality. Despite the fact that the regulation indicator shows very little variability and data assume discreet 1 to 5 values, the negative relationship of this index with regulatory quality is evident. Hence, it is reasonable to think that a negative relationship exists between perceived corruption and quantity of regulation, consistent with the relationship between perceived corruption and quality of regulation. Empirical evidence from a 142-country data set confirms our discussion (see Figure 4.4). The chart shows that high CPI (low corruption) is associated to a small amount of legislation. In chapter 1 we emphasized that in the presence of excessive regulations, there is wider scope to get round some of them for self-interested actors. The evidence shown above supports this discussion and how the ‘fewer but clearer rules’ principle proves both more efficient (see Figure 4.3) and effective (see Figure 4.4).
cap4.qxd
22/05/2007
8.20
Pagina
88
88
MARCO ARNONE - ELENI ILIOPULOS
Figure 4.4 - Regulation and corruption 6,0
Regulation
5,0 4,0 3,0 2,0 1,0 0,0 0
2
4
6
8
10
CPI
Source: Authors’ estimates from TI and Freedom House data. CPI=10 denotes absence of corruption while CPI=0 denotes highest corruption level.
© 2007 Vita e Pensiero
1.3. Supervisory agencies The role of supervisory agencies is to ensure general compliance with rules governing social activities. To perform their duties supervisors must act in conformity with quality standards as established to ensure that they remain extraneous to the interests of individual operators2. Autonomy (or independence) and competence are necessary features of supervisory authorities, given the critical role of these agencies. One important distinction is between goal and instrument autonomy. Supervisors may choose their goals, and/or the instruments needed to achieve such goals, depending on the laws establishing them. But these characteristics do not provide a sufficient condition to ensure an efficient supervision: to prevent supervision from being thwarted by possible external conditioning it is
2
A recent (and fortunately rare) case where these quality standards have been patently violated involved the former governor of the Bank of Italy, Antonio Fazio, who later resigned but only after months of widespread pressure from domestic and international institutions, public opinion and judicial investigations.
cap4.qxd
22/05/2007
8.20
Pagina
89
GOVERNANCE AND INSTITUTIONS
89
key that supervisory authorities be also financially independent and that staff be competent in the specific area under supervision. If these conditions are not all met, the quality of supervision cannot be guaranteed. Once established as independent (control) institutions, the supervisors must conform their behavior to the principles of accountability and transparency: they should act in such way that they can be held responsible for their actions, and their actions should be transparent to markets, agents, and the general public. These are minimal requirements for non-elected, public (control) institutions in a democratic society. 1.4. Financial supervision In sectors like banking, insurance, securities and pension funds, international organizations are increasingly setting the standards and monitoring compliance3. To define quality levels for supervisory authorities means to assess conformity of their actions with respect to established parameters; to enable international comparison, these parameters must achieve international recognition. Different markets have different types of supervision/regulation based on diverse sectoral needs. It is evident that markets open to cross-border exchanges must be regulated on the basis of internationally compatible rules; enforcement of standards and quality of the supervisors must be measured accordingly. Market globalization has favored international agreements that establish fundamental principles for market governance. Accordingly, these principles enabled the definition of criteria to evaluate supervision. An illustration of new indicators based on internationally accepted standards, as assessed by the International Monetary Fund and the World Bank, follows below.
© 2007 Vita e Pensiero
1.4.1. Banking supervision Because of their importance for domestic and international finance, banking markets are closely scrutinized by the International Monetary Fund and country authorities. Since 1997 the IMF has been committed to assessing compliance with the
3
See Arnone and Padoan (2007).
cap4.qxd
22/05/2007
8.20
Pagina
90
90
MARCO ARNONE - ELENI ILIOPULOS
Basel Core Principles (BCP) for banking supervision in banking systems around the world. We present here a numerical indicator with overall country scores as in Arnone, Darbar and Gambini (2007), and Arnone and Gambini (2006a and 2006b). Given the strategic importance of banking markets to the economy, it is useful to verify if our argument on the relationship between supervision and corruption may be reflected in an empirical relationship between the quality of a country’s banking supervision and domestic corruption. Any such relationship, if it exists, would corroborate our arguments as discussed above. In Figure 4.5 we show the relationship between a country’s compliance with the Basel Core Principles, (which is a good proxy for a country’s quality of banking supervision) and the CPI. Corruption and compliance with the BCP are negatively correlated: countries with high quality banking supervision experience lower corruption.
CPI
Figure 4.5 - Banking supervision and perceived corruption, year 2004 11 10 9 8 7 6 5 4 3 2 1 0 0
20
40
60
80
100
© 2007 Vita e Pensiero
Basel Core Principles Source: Authors’ estimates from TI and IMF-WB data. CPI=10 denotes absence of corruption while CPI=0 denotes the highest corruption level.
An indicator may also be identified for transparency of the banking supervisor: transparency is a proxy for good governance in
cap4.qxd
22/05/2007
8.20
Pagina
91
91
GOVERNANCE AND INSTITUTIONS
banking supervision4. This indicator is very important in the context of this book because, as we have emphasized many times, corruption finds fertile ground in environments dominated by secrecy and low transparency. If it were possible to identify a connection between the quality of supervision and compliance of supervisors with transparency practices (and therefore with good governance), economic policy implications would be clear. In this case, corruption would be negatively correlated with quality and transparency of supervision; hence, transparency-based reforms of supervision would be useful to achieve multiple objectives (better institutional governance, better supervision and lower corruption).
Transparency in banking supervision
Figure 4.6 - Transparency in banking supervision and conformity with Basel Core Principles, year 2004 120 100 80 60 40 20 0 0
10
20
30
40
50
60
70
80
90
100
Basel Core Principles
© 2007 Vita e Pensiero
Source: Authors’ estimates from IMF-WB data.
In Figure 4.6 we show the relationship between transparency of banking supervision and conformity with the Basel Core Principles in a worldwide sample. The correlation between transparency and regulatory quality is very strong: high transparency is generally associated with a high degree of conformity with regulatory quality standards. Hence, it is possible to deduce that
4
See Arnone, Darbar and Gambini (2007); Arnone and Gambini (2006b).
cap4.qxd
22/05/2007
8.20
Pagina
92
92
MARCO ARNONE - ELENI ILIOPULOS
domestic corruption and transparent banking supervision are negatively correlated: high corruption levels are associated to non-transparent banking supervision. Given the significant implications, this empirical evidence makes a statement in favor of transparency (and good governance) and emphasizes how important it is that actions of supervisory authorities comply with the principle and practices of transparency.
© 2007 Vita e Pensiero
1.4.2. Securities markets supervision Financial markets play a fundamental role in global wealth allocation; even more than the banking sector, financial markets are to be viewed in an international perspective because global savings move to where demand is higher based on risk and return criteria. The role of financial markets is clear if one thinks about the enormous magnitude of capital flows. However, financial and currency crises, and their ruinous consequences, make risks associated with financial market operations apparent. Financial markets are characterized by significant inherent risks and concentration of economic power. Hence, it is evident that the smooth functioning of these markets requires efficient regulation and effective controls. Supervision has a critical role in ensuring compliance with market rules and in protecting smaller agents from operators with larger capital and strong market power. The negative consequences of financial market failures provided the rationale for the creation of supervisory/regulatory standards that are binding not only for the agents but also for supervisors themselves. Based on the Basel Committee model, the International Organization of Securities Commission (IOSCO), a committee of securities markets supervisors, has established quality standards for securities markets supervision since 2000, while the International Monetary Fund and the World Bank have assessed conformity with respect to these standards. We processed this information into new indicators of quality and transparency of securities supervision. Given the importance of securities markets in the world wide economy and the strong capital concentration that characterizes these markets, it is possible that the general relationship between supervision and corruption is reflected in securities market supervision.
cap4.qxd
22/05/2007
8.20
Pagina
93
93
GOVERNANCE AND INSTITUTIONS
In Figure 4.7 we show the relationship between an indicator of quality of securities markets supervision and perceived corruption. We use a quality indicator based on principles established by the International Organization of Securities Commissions. This index reflects conformity of securities markets supervision with these standards. Figure 4.7 clearly shows that high corruption is associated to very low quality of securities markets supervision.
CPI
Figure 4.7 - Corruption and quality of securities markets supervision, year 2004 11 10 9 8 7 6 5 4 3 2 1 0 0
20
40
60
80
100
IOSCO Principles
© 2007 Vita e Pensiero
Source: Authors’ estimates from IMF-WB data. CPI=10 denotes absence of corruption while CPI=0 denotes highest corruption level.
By analogy with other segments of the financial markets, we show the relationship between quality and transparency of the securities market supervision. This information is particularly useful in its implications with respect to corruption: transparent financial supervision is associated with high quality supervision, hence, to low corruption levels.
cap4.qxd
22/05/2007
8.20
Pagina
94
94
MARCO ARNONE - ELENI ILIOPULOS
Transparency of securities market supervisors/regulators
Figure 4.8 - Quality and transparency of supervision in securities markets, year 2004 120 100 80 60 40 20 0 0
2
4
6
8
10
12
IOSCO Principles
Source: Authors’ estimates from IMF-WB data.
© 2007 Vita e Pensiero
1.4.3. Insurance markets supervision Good supervision of insurance markets protects operators in their risk management choices; given this broad perspective, supervision may not be exercised at a domestic level only, but must ensure compliance with standard criteria on an international basis5. As the International Association of Insurance Supervisors (IAIS) (1999) puts it: “The overall objective of insurance supervision is to maintain efficient, fair, safe and stable insurance markets for the benefit and protection of policyholders. To achieve this objective in an environment where many insurers and insurance groups are rapidly extending their international operations, often into new and emerging markets, there is an increasing need for insurance supervisors to co-operate with each other”. Globalization has recently accelerated a broader risk dimension calling for financial markets to assume an international dimension. This process implied the necessity that regulations be established for insurance markets that enable stability and reliability in an international context. Insurance markets are critical
5
See IAIS (1999).
cap4.qxd
22/05/2007
8.20
Pagina
95
95
GOVERNANCE AND INSTITUTIONS
to prevent losses that may trigger chain-reactions. For this reason, supervision in compliance with regulations to protect insurance markets strengthens both national and global financial stability. In the mid-1990s the IAIS established quality standards for insurance supervision. Compliance with these standards is assessed under the Financial Sector Assessment Programs (FSAP) established by the International Monetary Fund and the World Bank. These evaluations, which we present in a new numerical index6, are reflected in a related “IAIS index”. We show the CPI and IAIS indices to verify if corruption is correlated with the quality of insurance market supervision, as it is for banking and securities markets. The data in Fig. 4.9 show that good quality insurance market supervision is associated with low CPI; again, the relationship between corruption and quality of supervision is confirmed.
CPI
Figure 4.9 - Corruption and insurance markets supervision, year 2004 11 10 9 8 7 6 5 4 3 2 1 0 0
10
20
30
40
50
60
© 2007 Vita e Pensiero
IAIS Principles
Source: Authors’ estimates from TI and IMF-WB data. CPI=10 denotes absence of corruption while CPI=0 denotes highest corruption level.
Figure 4.10 shows the positive relationship between quality of supervision and transparency (and therefore good governance) of the supervisor, as found above for the banking and securities
6
See Arnone, Darbar and Gambini (2007); and Arnone and Gambini (2006a, b).
cap4.qxd
22/05/2007
8.20
Pagina
96
96
MARCO ARNONE - ELENI ILIOPULOS
markets: in our cross-country analysis, high transparency is associated with good quality of insurance market supervision. This argument supports the general relationship between transparent supervision and low corruption. Figure 4.10 - Quality and transparency of insurance markets supervision, year 2004
Transparency of supervisor/regulation in insurance markets
120 100 80 60 40 20 0 0
10
20
30
40
50
60
IAIS Principles
Source: Authors’ estimates from IMF-WB data.
© 2007 Vita e Pensiero
2. Monetary policy and transparency Similar to fiscal policy, monetary policy aims at preventing monetary variables from developing according to trajectories that may have an adverse impact on the economy. In chapter 3 we emphasized how one key objective of monetary policy consists of price stability, as it is possible for the central bank to influence interest rates and affect inflation. Monetary authorities ensure stability of money and financial markets and, in a number of cases, are in charge of banking supervision. Monetary policy is under the responsibility of central banks, and is managed on an independent basis unlike other government agencies. If the objectives of central banks are subject to those of national governments, it is not possible to ensure domestic and external stability of monetary
cap4.qxd
22/05/2007
8.20
Pagina
97
© 2007 Vita e Pensiero
GOVERNANCE AND INSTITUTIONS
97
macrovariables. Efficient monetary policy requires a central bank that is independent from political power7. Our analysis of regulatory and supervisory authorities emphasized the necessity that such agencies be independent and autonomous: their staff must be competent and act in conformity with accountability and transparency principles. As an agency with monetary policy authority, it must be held accountable for, and transparent with respect to, its actions before citizens, markets and institutions, at both domestic and international level. Public sector accountability is a key condition to ensure that established objectives and measures are effectively implemented and comply with public institutions’ good governance framework. Accountability must be extended to all spheres of government actions, without being limited to monetary policy only. In the paragraphs which follow we will show how accountability is necessary to the very structure of institutions in a democratic state. Accountability of institutions and governments with respect to policy management is a goal closely connected to transparency; lack of transparency in government actions and unclear regulations prevents supervisors and citizen from exercising adequate controls on the decisions taken by policy makers. To establish accountability of public institutions and bureaucrats, it is necessary that citizens be in a position to evaluate policymakers actions. Hence, transparency is a necessary condition at the foundation of good public governance. Our analysis in chapter 3 emphasized how, if there is no transparency of management, fiscal policies may be subject to corruption. This argument also applies to monetary policy management. In the absence of transparency, broad discretion of monetary policy authorities leaves scope for possible conflicts of interest and the pursuit of private benefits or personal interests. Empirical evidence supports our earlier arguments and shows how, in an analysis of a 60-country dataset, high corruption (low CPI) is associated with low transparency in monetary policy. Furthermore, high transparency in monetary policy is associated with high transparency in fiscal policy (see chapter 3), in an indication of a complementarity between aspects of monetary and fis7
For a review of the empirical literature see Arnone, Laurens and Segalotto (2006).
cap4.qxd
22/05/2007
8.20
Pagina
98
98
MARCO ARNONE - ELENI ILIOPULOS
cal policy. This result confirms (see Figure 4.11) that low quality of individual institutions has negative spillover effects on other institutions, hence favoring the preconditions for the development of corruption.
CPI
Figure 4.11 - Transparency of monetary policy, year 2004 11 10 9 8 7 6 5 4 3 2 1 0 0
20
40
60
80
100
120
140
160
Transparency of monetary policy Source: Authors’ estimates from TI and IMF data. CPI=10 denotes absence of corruption while CPI=0 denotes highest corruption level.
© 2007 Vita e Pensiero
3. Corruption and governance The above analysis focused on those features of governance which directly affect the functioning of markets; however, as already remarked, corruption is a manifold phenomenon and does not affect only markets. Corruption is an endogenous outcome deriving from the fundamentals of a society; in turn, its effects reach several dimensions of society. In this section we concentrate our attention on the dynamics that link corruption to the institutional-political dimension of countries. Here we analyze the transmission channels that link corruption with governance indicators. We first consider the legal-political dimension of governance; then, we focus on institutional variables. Finally, we will focus on an indicator of democracy.
cap4.qxd
22/05/2007
8.20
Pagina
99
GOVERNANCE AND INSTITUTIONS
99
© 2007 Vita e Pensiero
3.1. Institutions and governance indicators The quality of a country’ governance depends on a variety of institutional and social factors, and has a strong impact on the effectiveness of the specification and implementation of policies. The significance of governance qualitative features has recently stimulated a strong interest towards institutional variables; international organizations, such as the World Bank, has defined measures and produced a quantitative assessment of institutional features for empirical analysis. In the following, we aim at investigating the link between corruption and governance; our analysis is based on the empirical evidence of the World Bank Governance Indicators (see Kaufmann, Kraay and Mastruzzi, 2004 and 2005). These six indicators are composed of several sub-indicators and are the starting point of the empirical evidence on governance features. They focus on the processes by which governments are selected, monitored and replaced; the capacity of governments to effectively formulate and implement sound policies; the respect of citizens and goverment for the institutions that govern economic and social interactions among them. With respect to the process by which those in authority are selected and replaced, the indicator of voice and accountability includes a number of sub-indicators measuring many aspects of the political process, civil liberties and political rights. It measures the extent to which citizens of a country are able to participate in the selection of governments. Kaufmann, Kraay and Mastruzzi also include in this category indicators measuring the independence of the media. The indicator of political stability and absence of violence reflects the idea that the quality of governance in a country is compromised by the likelihood of wrenching changes in government. This would not only have a direct effect on the continuity of policies, but also at a deeper level would undermine the ability of all citizens to peacefully select and replace those in power. The indicator of rule of law includes several sub-indicators measuring the extent to which agents have confidence in, and abide by, the rules of society. It is composed of several sub-indices relative to perceptions of the incidence of crime, the effectiveness and predictability of the judiciary, and the enforceability of contracts. The indicator of control of corruption concerns the percep-
cap4.qxd
22/05/2007
8.20
Pagina
100
100
MARCO ARNONE - ELENI ILIOPULOS
tions of domestic bribery and is an alterative proxy to the CPI. Finally, the indicators of government effectiveness and regulatory quality focus on the ability of the government to formulate and implement sound policies. The indicator of government effectiveness combines measures of quality of public services, quality of the bureaucracy, competence of civil servants, its independence from political pressures, and the credibility of the government’s commitment to policies. The indicator of regulatory quality evaluates policies and includes measures of the incidence of marketunfriendly policies such as price controls or inadequate bank supervision, as well as perceptions of the burdens imposed by excessive regulation in areas such as foreign trade and business development. 3.1.1. Accountability When institutions are accountable to their citizens or towards supervisory authorities there is a strong incentive in favor of meritocratic selective processes. Discretional choices can no longer be managed arbitrarily and ‘objective’ criteria are needed. It is thus clear that accountable institutions should not tolerate abuses of power nor the pursuit of private interest. Figure 4.12 - Corruption and accountability
Voice and Accountability
© 2007 Vita e Pensiero
Corruption and ‘accountability’ 2.50 2.00 1.50 1.00 0.50 0.00 -0.50 0 -1.00 -1.50 -2.00 -2.50
2
4
6
8
10
12
CPI
Source: Authors’ estimates from TI data and Kaufmann, Kraay and Mastruzzi (2005). CPI ranges between 10 (highly clean) and 0 (highly corrupt).
cap4.qxd
22/05/2007
8.20
Pagina
101
101
GOVERNANCE AND INSTITUTIONS
Transparency and accountability both significantly affect the quality of institutions and the possibility that degenerative dynamics could hinder the attainment of public welfare. These considerations are supported by the following empirical evidence relative to more than 140 countries. High degrees of accountability are associated with high levels of CPI (i.e., low levels of corruption). See Figure 4.12. Among all governance indicators, the indicator of accountability is the one that probably presents the highest degree of persistence. This is due to the fact that the degree of institutional accountability is deeply rooted in the structure and culture of institutions. It is thus possible to affect significantly the accountability of a country only through a process of wide-ranging reform of government organizations. In the period considered, data show a positive trend for Western European and Transition countries and Latin America. In the same period, North America experienced only a minimal deterioration, while the rest of the world shows a significant decrease in accountability. See Figure 4.13. Figure 4.13 - Accountability over time, 1996-2002 Global Governance Indicators: Voice and Accountability 2.00 1.50
1.39 1.44
1.42 1.41
1.00 0.50
0.13 0.19
0.10
0.00 -0.20
-0.50
-0.08
-0.14
-0.07 -0.23 -0.61
-1.00
© 2007 Vita e Pensiero
Western Europe
North America
Latin America
Transition 1996
-0.70
-0.55 -0.62
Asia&Pacific Middle East & Sub-Saharan North Africa Africa
Caribbean
2002
Source : Authors’ estimates from TI data and Kaufmann, Kraay and Mastruzzi (2004).
cap4.qxd
22/05/2007
8.20
Pagina
102
102
MARCO ARNONE - ELENI ILIOPULOS
3.1.2. Political stability The quality of governance is also reflected in the ability of political institutions to ensure political stability. If institutions are not able to avoid that the government in power could be destabilized or overthrown by unconstitutional and/or violent means (including domestic violence and terrorism), or if institutions do not guarantee that the government in power is supported by a generalized consensus (majority principle), or do not assure that governments’ decisions are consistent with citizens’ generalized opinions, policies and private agents’ decisions are subjected to a high degree of uncertainty. This kind of uncertainty represents a cost for private agents and a significant obstacle for the implementation of policies. To give an idea, one can reasonably think of policy making on economic issues: if it is not credible enough, it may not be effective. Political stability also depends on the strength of the system to resist any attempt by interest groups to practice forms of state capture. If governance is solid, the possibility that the system could experience episodes of corruption drastically decreases. These considerations are at the root of the empirical evidence showing that high levels of political stability are associated with low degrees of corruption (high levels of CPI) as shown in Figure 4.14.
Political stability
© 2007 Vita e Pensiero
Figure 4.14 - Political stability and corruption 2.50 2.00 1.50 1.00 0.50 0.00 0 -0.50 -1.00 -1.50 -2.00 -2.50 -3.00
2
4
6
8
10
12
CPI
Source: Authors’ estimates from TI data and Kaufmann, Kraay and Mastruzzi (2005). CPI ranges between 10 (highly clean) and 0 (highly corrupt).
cap4.qxd
22/05/2007
8.20
Pagina
103
103
GOVERNANCE AND INSTITUTIONS
Political stability generally characterizes advanced economies. However, terrorism and political choices not supported by a generalized consensus in the recent years led to a deterioration of the index in North America. On the contrary, the stabilizing role played by the consolidation and enlargement of the European Union proved beneficial for political stability of European countries. In the same period, North Africa and the Middle East experienced an improvement in the index for the specified time period; this trend has been surely reversed in more recent years (outside the time span of the data set) because of conflicts and civil unrest in the region. Finally, the remaining areas experienced a generalized deterioration in political stability. See Figure 4.15. Figure 4.15 - Political stability over time, 1996-2002 Global Governance Indicators: Political Stability 1.50
1.23 1.06 0.91
1.00
0.70
0.50 0.06 0.01
0.26
0.12 0.09
0.00
0.00 -0.11-0.16
-0.27
-0.50
-0.39 -0.57
-0.66
-1.00 Western Europe
North America
Latin America
Transition 1996
Asia&Pacific
Middle East & North Africa
Sub-Saharian Africa
Caribbean
2002
Source: Authors’ estimates from TI data and Kaufmann, Kraay and Mastruzzi (2004).
© 2007 Vita e Pensiero
3.1.3. The rule of law The indicator of ‘rule of law’ of a country reflects the efficiency and the effectiveness of the set of rules that govern it. If laws and regulations are not respected, society is pervaded by a high degree of uncertainty and the set of rights and duties established by the legal system is not granted. In chapter 2 we remarked that for enterprises the cost of uncertainty can be significant indeed as it can cause several inefficiencies. The same considerations apply to society at large when compliance with the rules cannot be taken for granted.
cap4.qxd
22/05/2007
8.20
Pagina
104
104
MARCO ARNONE - ELENI ILIOPULOS
Low degree of ‘rule of law’ creates breeding ground for the diffusion of episodes of corruption. The latter spreads in an environment where it is possible to violate laws with a low probability of being caught and punished accordingly. Therefore, there is space to obtain illegal extra-profits. Figure 4.16 shows the existence of a correlation between the indicator of rule of law and the CPI. Data show that there is a significant positive relationship between the two indicators. In more than 143 countries, a strong rule of law is associated with low degrees of corruption. Figure 4.16 - Corruption and the rule of law
Rule of law
Corruption and rule of law 3.00 2.50 2.00 1.50 1.00 0.50 0.00 -0.50 0 -1.00 -1.50 -2.00 -2.50
2
4
6
8
10
12
CPI
© 2007 Vita e Pensiero
Source: Authors’ estimates from TI data and Kaufmann, Kraay and Mastruzzi (2005). CPI ranges between 10 (highly clean) and 0 (highly corrupt).
We now show the trends of the indicator of ‘rule of law’ comparing 1996 and 2002 (Figure 4.17). Data show an improvement of the indicator in Western European countries and Transition economies. The indicator is stable in North America, Middle East and Sub-Saharan Africa. Finally, it shows a deterioration in Latin America, Asia and Pacific, and the Caribbean.
cap4.qxd
22/05/2007
8.20
Pagina
105
105
GOVERNANCE AND INSTITUTIONS
Figure 4.17 - Rule of law over time, 1996-2002 Global Governance Indicators: Rule of law 2.00 1.55 1.62
1.74 1.74
1.50 1.00 0.50
0.23
0.10
0.08 0.09
0.00 -0.20
-0.50
-0.36
-0.24-0.30
-0.37-0.29 -0.69 -0.71
-1.00 Western Europe
North America
Latin America
Transition
1996
Asia&Pacific
Middle East & North Africa
Sub-Saharian Africa
Caribbean
2002
Source: Authors’ estimates from TI data and Kaufmann, Kraay and Mastruzzi (2005).
© 2007 Vita e Pensiero
3.1.4. Control of corruption The above analysis has been based on extensive economic literature and some new indicators; it shows the relationships that link corruption to many diverse variables. Also, we have provided rich empirical evidence that confirmed our considerations. Our empirical analysis is based on the trends of the Corruption Perception Index (CPI). However, alternative proxies for corruption can be found. One of them is the World Bank Governance Indicator of control of corruption: it reflects the perceptions of individuals concerning the frequency of episodes of bribery, estimates of episodes of state capture, and political corruption. The main difference between the CPI and the indicator of control of corruption is given by the methodology in collecting data and weighting the sub-indices. However, the two indicators present a very high degree of correlation (Kaufmann, Kraay and Mastruzzi, 2004). Figure 4.18 shows the evolution of control of corruption from 1996 to 2002. Notice that the index shows clear improvements in Western Europe, North America and the Middle East. On the contrary, it tended to deteriorate in Asia & Pacific, Sub-Saharan Africa and the Caribbean. The index is stable in Latin America and Transition countries.
cap4.qxd
22/05/2007
8.20
Pagina
106
106
MARCO ARNONE - ELENI ILIOPULOS
Figure 4.18 - Control of corruption and persistence over time, 1996-2002 Global Governance Indicators: Control of Corruption 2.50 2.00 1.50
1.72
1.80
1.90
1.44
1.00 0.50
0.14
0.00
-0.03
0.13
0.00 -0.26 -0.29
-0.50
-0.14 -0.22
-0.42 -0.41
-0.55
-1.00 Western Europe
North America
Latin America
Transition
1996
Asia& Pacific Middle East & North Africa
-0.65
Sub-Saharian Africa
Caribbean
2002
Source: Authors’ estimates from TI data and Kaufmann, Kraay and Mastruzzi (2004).
© 2007 Vita e Pensiero
3.1.5. Government effectiveness The indicator of government effectiveness reflects the ability of government bureaucracy to produce and implement good policies and deliver public goods – consistent with its mandate. Clearly, the degree of effectiveness is also reflected in government’s normative ability and in its ability to manage public goods. It is thus not surprising that high levels of CPI (lows degrees of corruption) are associated with good levels of government effectiveness. Indeed, the ability of governance structure to help the government in pursuing public welfare – without being affected by those private interests that corrode public bureaucracies through secret and illegal channels – is negatively correlated to the degree of domestic corruption. The correlation between government effectiveness and the CPI in Figure 4.19 is significant and data present a very low degree of dispersion around the regression line. Data in Figure 4.20 show that this indicator has recently experienced an improvement in Western Europe, North America, Transition economies, and the Caribbean. On the contrary, Latin America, Asia and Pacific, and Sub-Saharan Africa experienced a deterioration in their trends of government effectiveness. Finally, trends have remained stable in the Middle East and North Africa.
cap4.qxd
22/05/2007
8.20
Pagina
107
107
GOVERNANCE AND INSTITUTIONS
Figure 4.19 - Government effectiveness and domestic corruption
Government effectiveness
3.00 2.50 2.00 1.50 1.00 0.50 0.00
2
4
6
8
12
10
-0.50 -1.00 -1.50 -2.00 CPI
Source: Authors’ estimates from TI data and Kaufmann, Kraay and Mastruzzi (2005). CPI ranges between 10 (highly clean) and 0 (highly corrupt).
Figure 4.20 - Government effectiveness and persistence over time, 1996-2002 Global Governance Indicators: Government Effectiveness 2.00 1.50
1.70
1.79 1.59
1.42
1.00 0.50
0.25 0.19 -0.01 0.01
0.00 -0.07 -0.26
-0.50
-0.35
-0.33-0.26
-0.32 -0.67-0.71
© 2007 Vita e Pensiero
-1.00 Western Europe
North America
Latin America
Transition
1996
Asia&Pacific Middle East & North Africa
Sub-Saharian Africa
Caribbean
2002
Source: Authors’ estimates from TI data and Kaufmann, Kraay and Mastruzzi (2004).
cap4.qxd
22/05/2007
8.20
Pagina
108
108
MARCO ARNONE - ELENI ILIOPULOS
3.2. Parliament and laws There is a strong correlation between the quality of institutions and crime; indeed, several forms of crime find fertile ground in fragile institutions. In particular, a WB study has focused recently on this issue (see Kaufmann, 2004). Kaufmann concentrates his attention on all comparative costs of crime and focuses on factors that are more significantly correlated with crime. Figure 4.21 - Cost of organized crime, year 2004 Cost of organized crime % of firms reporting high costs
50 45 40 35 30 25
r = -0.65
r = -0.67
20 15 10 5 0 Qualitydel of Parliament Qualità parlamento Low institutional quality Bassa qualità istituzionale
of Police interna Qualità Quality della sicurezza Highqualità institutional quality Alta istituzionale
© 2007 Vita e Pensiero
Source: Kaufmann, 2004. Note: White histograms on the horizontal axis indicate low qualitative features of institutions; black histograms indicate high qualitative features of institutions. Data show that white histograms are associated with high costs of organized crime; black histogram are instead associated with low costs of organized crime.
Data show a strong correlation between the costs of organized crime and the quality of institutions. In particular, Figure 4.21 shows that the cost of organized crime is strongly correlated with the quality of parliament and domestic police. When institutions have high qualitative standards, costs related to crime are significantly lower than when institutions present low qualitative features. Indeed when parliament is capable of producing efficient laws and law enforcement is effective, organized crime and corruptive dynamics are hindered. The coefficient that links the
cap4.qxd
22/05/2007
8.20
Pagina
109
GOVERNANCE AND INSTITUTIONS
109
costs of crime to the quality of parliament is – 0.65, implying that a unit improvement in the quality of parliament index decrease costs by 0.65 unit; finally, the coefficient that links the costs of crime to the quality of police is – 0.67, very similar to the other one. The above empirical evidence confirms the significance of governance features for the control of domestic corruption.
© 2007 Vita e Pensiero
4. Democracy and corruption The above analysis has aimed at highlighting the manifold causal relations that link domestic corruption to governance. As remarked, these links concern both economic and financial supervision and the whole dimension of governance. It is thus clear that the significance of the phenomenon of corruption also derives from the sheer extension of its manifold effects. Our empirical analysis is based on international indicators aimed at offering key measures of some effects of bribery; however, many other effects cannot be proxied by quantitative indicators even if they have a dramatic impact on society. In chapter 5 we highlight some effects of corruption on civil society; spreading through a variety of diverse transmission channels, corruption reaches citizens’ most practical dimensions of life. The damage caused by corruption is much larger than the sum of all its measurable effects: corruption attacks the credibility of social organizations and generates mistrust in institutions as it hinders their ability to pursue their objectives, affects their decision-making process by modifying both general and specific goals, and decreases their ability to act efficiently. Corruption therefore corrodes the ‘intangible goods’ of society, but these effects cannot be measured, even indirectly, because it is extremely difficult to isolate them. However, these dangerous effects are partly reflected in the political structure of countries. We now focus our attention on structural features of modern states. In Figure 4.22 we aim at verifying if bribery is associated with non-democratic forms of government. Hameed (2005) has noticed the existence of a negative correlation between domestic corruption and democracy; according to his empirical study, high degrees of corruption are associated to low levels of democracy. We now consider a numerical elaboration of the Polity IV Democracy Index. It
cap4.qxd
22/05/2007
8.20
Pagina
110
110
MARCO ARNONE - ELENI ILIOPULOS
evaluates the structure of 132 countries according to consistency (or not) with the principles of democracy. Even if it is not possible for us to find a robust causal relationship between the two indicators, data show the existence of a negative correlation between the index of democracy and corruption. Even if the index of democracy presents a low degree of variability, in general low levels of the CPI (high levels of corruption) are clearly associated with low levels of democracy. Therefore, it is possible that, by attacking the root of social organizations, the negative effects of corruption on the intangible goods of society contribute to create an environment where democracy reaches very low qualitative standards.
CPI
Figure 4.22 - Corruption and democratic governance, 2003-2004 11 10 9 8 7 6 5 4 3 2 1 0
Bolivia Lebanon
-8
-6
-4
-2
Iraq
Singapore
0
2 4 Democracy
6
8
10
12
© 2007 Vita e Pensiero
Source: Authors’ estimates from TI data and Polity IV Democracy Index. CPI ranges between 10 (highly clean) and 0 (highly corrupt). High levels of the democracy index indicate a high degree of democracy.
This chapter has presented an analysis of the effects of corruption on institutions; first, we have focused our attention on the role of regulatory/supervisory institutions as control institutions and in strengthening the forces of competitive markets. Then, we shifted our attention to countries’ fundamental institutions. Indeed, if corruption pervades the economic and institutional dimension of society, all intangible goods are attacked: the credibility of institutions and rules; relationships and transactions amongst agents; the willingness to contribute to create a solid and ethically strong consensus. If this happens, the cost of corruption weighs on society and on citizens’ life. Chapter 5 concentrates on the social effects of corruption. Back to the Summary
cap5.qxd
22/05/2007
8.20
Pagina
111
CHAPTER V
© 2007 Vita e Pensiero
Social costs of corruption: human development and social exclusion
The analysis in the previous chapters was aimed at spreading light on the manifold causal relations that link corruption to several economic-institutional indicators. In chapters 2 and 3 we showed how corruption affects market competitiveness and the main international macrovariables. In chapter 4, we analyzed the links between the quality of governance and corruption: low quality governance is indeed at the root of episodes of corruption. In addition, corruption itself negatively affects the quality of governance. These feedback effects create dangerous vicious circles, which are very difficult to stop. Bribery is characterized by multidimensional transmission channels and manifold effects that also reach a country’s social dimension. It implies significant costs both for governmental institutions, and for countries’ economic development. We will show how corruption spreads throughout the social dimension of countries via its economic and institutional effects. Thus, although it is not possible to ascertain a simple, unidirectional causal relationship between corruption and social indicators, it is nevertheless possible to track the direct correlation between corruption and some economic-institutional factors, which do affect society (and thus, the social indicators). In what follows we focus on a group of socio-environmental factors, which are linked to corruption and contribute to foster an “inclusive society” with equal opportunities for is members. An “inclusive society” does stimulate the development of certain conditions, which ensure for each of its members the satisfaction of some basic needs: health care, human development, quality of life, education, and minorities’ protection. We introduce an analysis based on some social indicators such as the United Nations Human Development Indicator, public spending for health and gender empowerment. Also, as Popper remarks, an
cap5.qxd
22/05/2007
8.20
Pagina
112
112
MARCO ARNONE - ELENI ILIOPULOS
“open society” is indeed to be fostered. We proxy the concept of openness within society with indicators of empowerment of women and women in parliament; we proxy the concept of openness toward the rest of the world with the number of foreign residents. In addition, we include an indicator of freedom of the media. Finally, we concentrate our attention on the concept of fairness; we present empirical evidence relative to the fairness of justice as a social factor. We show the negative effect of corruption on all these social indicators.
© 2007 Vita e Pensiero
1. Corruption and human development It is reasonable to believe that a society that is characterized by good levels of human development is not affected by high degrees of corruption. If we leave for a moment the intuitive definition of human development and consider the definition of official statistics, we need to analyze the trends of the UN Human Development Indicator (HDI) and verify the existence of a possible correlation with the CPI. The Human Development Indicator consists of the weighted average of 3 sub-indices: an index that measures the level of education in the country (the index for education combines the level of domestic literacy with the number of enrolments at school), life expectancy and the income of the country (the GDP index). Notice also that there could normally be some interrelationship between the different sub-indices; it is reasonable to think that education and life expectancy both depend on domestic income. Given the sub-indices that compose the HDI it is possible to highlight the transmission channel through which corruption can affect human development in a country. The main channel consists of specific features of governance: corrupt governments tend to devote fewer resources to education (see above). Notice also the inverse process where low levels of education are at the root of low quality governance. Similar considerations apply for the health care system: we show how high degrees of domestic corruption are associated with low levels of public spending for health care. Finally, the earlier analysis showed corruption’s depressing impact on economic growth.
cap5.qxd
22/05/2007
8.20
Pagina
113
113
SOCIAL COSTS OF CORRUPTION
The empirical evidence confirms the effectiveness of the channels that link bribery to human development: low degrees of domestic corruption (high levels of CPI) are associated with high degrees of human development (see Figure 5.1). As mentioned above, the two variables are strongly linked via an indirect relationship. Figure 5.1 shows that for a sample of more than 140 countries, high levels of the human development indicators are associated with low degrees of corruption; the effects of bribery therefore reach the deepest aspects of people’s personal and social life.
CPI
Figure 5.1 - Corruption and human development 11 10 9 8 7 6 5 4 3 2 1 0
Botswana
0
0.2
0.4
0.6
0.8
1
1.2
HDI
Sources: Authors’ estimates from United Nations (2004) and TI data. CPI ranges between 10 (highly clean) and 0 (highly corrupt).
© 2007 Vita e Pensiero
2. Public spending on health Corruption distorts the allocation of public spending in favour of sectors characterized by a high degree of political and economic power. Therefore, the remaining sectors are left aside. In chapter 2 we highlighted the existence of a negative correlation between the degree of domestic corruption and the amount of public spending on health. In the same chapter we also showed the existence of an inverse causal relationship between education and corruption: high levels of corruption dampen public spending for education, and thus, the cultural level of society.
cap5.qxd
22/05/2007
8.20
Pagina
114
114
MARCO ARNONE - ELENI ILIOPULOS
Since a positive correlation between the quality of public health care and public spending on health has been reported in economic literature, we show some empirical evidence relative to corruption and public spending on health. In order to control for the positive correlation between the governments’ propensity to devote resources to public services (i.e., income effects), we divide the whole sample into three groups by GDP: advanced, emerging, and developing countries.
CPI
Figure 5.2 - Corruption and public spending on health, advanced economies 11 10 9 8 7 6 5 4 3 2 1 0
Italy Greece
0
2
4
6
8
10
Public spending on health, % GDP
© 2007 Vita e Pensiero
Sources: Authors’ estimates from United Nations (2004) and TI data. CPI ranges between 10 (highly clean) and 0 (highly corrupt).
Figure 5.2 shows that for a sample of advanced economies, high levels of public spending on health are associated with low degrees of domestic corruption. This correlation shows a low degree of dispersion around the regression line. However, some exceptions can be found: Greece and Italy are characterized by degrees of corruption that are significantly higher than the other countries of the sample (low levels of CPI). We now show the empirical evidence for emerging market economies; also in this sample, low degrees of domestic bribery (high levels of CPI) are associated with high levels of public spending on health.
cap5.qxd
22/05/2007
8.20
Pagina
115
115
SOCIAL COSTS OF CORRUPTION
Figure 5.3 - Corruption and public spending on health, emerging economies 8
Chile
7 6 CPI
5 4 3 2 1 0 0
1
2
3
4
5
6
7
8
Public spending on health, % GDP Sources: Authors’ estimates from United Nations (2004) and TI data. CPI ranges between 10 (highly clean) and 0 (highly corrupt).
Figure 5.4 shows that also within the sample of developing countries, the correlation between domestic corruption and public spending on health is significant. As expected, countries are concentrated around low levels of public spending and high levels of corruption. Figure 5.4 - Corruption and public spending on health, developing countries 8 7 6 CPI
5 4
© 2007 Vita e Pensiero
3 2 1 0 0
1
2
3
4
5
6
Public spending on health, % GDP Sources: Authors’ estimates from United Nations (2004) and TI data. CPI ranges between 10 (highly clean) and 0 (highly corrupt).
7
cap5.qxd
22/05/2007
116
8.20
Pagina
116
MARCO ARNONE - ELENI ILIOPULOS
© 2007 Vita e Pensiero
3. Gender discrimination and corruption The degree of development of a society depends on a multiplicity of factors, some of which are not captured by the HDI - not directly nor indirectly; nonetheless those factors are good proxies for both human development and cultural openness of societies. For the purpose of a better understanding of the social dimension of a country, we need therefore to consider additional proxies. The attitude towards the weakest part of the population reflects the degree of civil culture in a society. Legal systems that discriminate directly or indirectly against certain members of society violate one of the principles on which democracy is based. Respect for rights which is at the root of a democratic state may not be granted to all citizens. If government by majority is the first pillar of democracy, the protection of the rights of minorities is the second one. Democracy is based on both of them, at the very least; their violation undermines the core of a democratic system. Discriminations can be direct, whenever one part of the population is explicitly excluded from some benefits. But it can also be indirect; the lack of protections for the weakest part of the population can hinder the participation of these citizens to some dimensions of social life. If the government tends to favour discriminations (either directly or indirectly) it inevitably shows a weak form of democracy. Discrimination is usually the result of hard-to-die cultural habits and concepts of social organizations; it represents an impediment to human development in a cultural, social and political context. The potential contribution of minorities is lost and the élite in power has the right to impose its vision of society without the need of confronting itself and its vision with other perspectives. A country is thus pervaded by a high degree of dogmatic rigidity reflected in social rules (including laws) and institutions – and thus in a country’s social life. Highly male-dominated societies (because of religious or cultural reasons) create rules that prevent women from participating in economic or political life. At the same time, institutions of these societies tend to perpetuate (through the creation of laws and culture) the exclusion of women from the political life of a country. This vicious cycle is in many countries at the root of the social exclusion of women; often, cultural or religious issues cre-
cap5.qxd
22/05/2007
8.20
Pagina
117
117
SOCIAL COSTS OF CORRUPTION
ate significant obstacles to any possible step in the direction of gender equality. We now present some empirical evidence on women discrimination. We show that a high degree of domestic corruption is associated to a high degree of discrimination. This correlation is based on some important transmission channels: a culture of discrimination against women could be the result of a low quality educational system, and an old-fashioned, male-dominated family structure; alternatively, it could be the outcome of laws that explicitly forbid women’s access to political life. Since legal systems are the indirect outcome of political choices, they eventually reflect the quality of public governance. As discussed above, low cultural standards have devastating effects on the quality of governance: less educated citizens are inevitably less conscious voters and tend to choose politicians according to prejudice and discrimination-prone habits. The data represented in Figure 5.5 confirm the above considerations; they show that in general, countries characterized by a small number of women in parliament are pervaded by a high degree of corruption.
© 2007 Vita e Pensiero
CPI
Figure 5.5 - Women in parliament and corruption, year 2004 11 10 9 8 7 6 5 4 3 2 1 0 0
10
20
30
40
Women in parliament Sources: Authors’ estimates from United Nations (2004) and TI data. CPI ranges between 10 (highly clean) and 0 (highly corrupt).
50
cap5.qxd
22/05/2007
118
8.20
Pagina
118
MARCO ARNONE - ELENI ILIOPULOS
© 2007 Vita e Pensiero
The empirical evidence in Figure 5.5 must be interpreted in light of the transmission channels analyzed above. Behavioral attitudes with respect to gender are not the subject of our study and do not explain our results. Notice, however, that the degree of emancipation of women in a country is not necessarily reflected in the number of seats in parliament that are held by women. In fact, in some countries electoral laws are created ad hoc in order to transmit to the rest of the world an image of cultural emancipation. In these cases women are still far from the possibility of successfully advancing ideas for social reform. The index of women in parliament needs, therefore, to be interpreted in light of these significant constraints. The Gender Empowerment Measure (GEM) reflects the degree of women’s participation in the social life of a country. This index consists in the weighted average of 3 sub-indices: the indicator of participation in economic life (this includes the two indicators that account for both the number of female legislators, senior officials and managers, and the number of female professionals and technicians), the indicator of participation of women in political life (seats in parliament held by women) and the indicator of income differentials (i.e. the ratio of estimated female to male earned income). This last indicator reflects possible discrimination in income distribution. The GEM index offers a more complete representation of the degree of participation of women to public life; however, it has the disadvantage of covering a limited sample of countries. In order to check on a possible correlation between the GEM and the CPI we present some data: it is reasonable to think that the same transmission channels that link corruption to the indicator of women in parliament, link also the CPI to the GEM. Figure 5.6 shows that high degrees of participation of women in the social, political and economic life of society are associated with low degrees of domestic corruption.
cap5.qxd
22/05/2007
8.20
Pagina
119
119
SOCIAL COSTS OF CORRUPTION
CPI
Figure 5.6 - Corruption and gender empowerment, year 2004 11 10 9 8 7 6 5 4 3 2 1 0 0
0.2
0.4
0.6
0.8
1
GEM
Sources: Authors’ estimates from United Nations (2004) and TI data. CPI ranges between 10 (highly clean) and 0 (highly corrupt).
© 2007 Vita e Pensiero
4. Immigration We now focus our attention to the concept of socio-cultural openness toward the rest of the world. In the previous section we showed that countries characterized by high levels of socio-cultural openness within society are generally less corrupt. Here we show that the dynamics that indirectly link the degree of domestic corruption to discriminatory behavior toward women, also favor discriminatory behavior toward foreigners. Open-minded societies are generally characterized by high levels of education. The dynamics that are at the root of gender discrimination against women are of the same nature as those leading to discrimination against foreign immigrants. Even if the object of discrimination is different, the logic at the base of discrimination against minorities or “weaker” groups of society is the same: strongest groups of individuals enjoy the benefits of some rights from which other members of society are excluded. Having said that, even if the logic at the root of discrimination against immigrants is the same at the root of any type of discrimination against minorities, xenophobic behaviors follow also from
cap5.qxd
22/05/2007
© 2007 Vita e Pensiero
120
8.20
Pagina
120
MARCO ARNONE - ELENI ILIOPULOS
a deeply-rooted motivation: the fear of the “new and unknown”. Women or minorities who share the same cultural background represent well known situations, which are only characterized by features that make these groups weaker relative to the members of the majority. Those minorities who do not share the same cultural backgrounds as the majority represent an unknown territory; and thus represent a potential danger. The fears towards foreign minorities are embodied in two basic fears: firstly, the fear of being dominated by foreign cultures and, secondly, the fear of being surpassed in or excluded from the allocation of domestic resources. Regarding the first fear, it tends to be negatively correlated with the level of education of the members of a society: the higher the cultural standard of citizens, the broader their cultural perspective. Thus, the more educated citizens are, the lower their fears toward the “unknown”: education is indeed associated with increased awareness and knowledge of foreign cultures. Also, more educated citizens are more conscious of their own culture, of its limits, roots and potential, and generally tend to be less intimidated by other cultures. With regard to the second fear, fear of economic exclusion is reflected in forms of discrimination by the poorest segments of insiders; this type of behaviour finds a breeding ground in less developed areas – where standards of life are low – of wealthy societies: the level of education is generally low, employment opportunities are uncertain, and there is little chance of economic betterment and upward social integration. Clearly, in this environment, immigrants represent potential rivals in the allocation of employment opportunities and domestic resources (think, for instance, of the banlieues of Paris, poor neighborhoods where many inhabitants are of North African origin, although the younger generation is generally French). Indeed, there exist a strong link between episodes of discrimination, cultural standards and the wealth of a society: with better employment conditions and good educational levels, the poorest insiders’ fears of economic exclusion tend to decrease, and the social and psychological gap with foreign minorities and the second generation of immigrants tend to level off. The channels through which these forms of racism are
cap5.qxd
22/05/2007
8.20
Pagina
121
SOCIAL COSTS OF CORRUPTION
121
© 2007 Vita e Pensiero
embodied in discriminatory elements in the legal system are similar to those that embody and transmit gender discrimination throughout society. In addition, as we previously mentioned, there are significant feedback effects from governance to the cultural level of citizens. The strong link between the propensity towards discriminatory behavior on the one hand, and economic and cultural standards on the other hand, can constitute an important transmission channel also for bribery. The above analysis relative to the negative effects of corruption both on growth and educational standards suggest that immigration inflows should not be associated with high levels of domestic corruption (as xenophobic opinions stress). Empirical evidence shows that, far from “exporting corruption”, immigration inflows are associated to low degrees of domestic corruption in destination countries. Figure 5.7 shows current trends of domestic corruption and immigration inflows in a group of advanced economies. The sample we consider consists of only 30 countries and therefore the correlation we analyze could be subject to sample bias. Notice, however, that if we exclude migration flows towards the Middle East (that depend on the peculiar features related to oil resources), migration flows are mostly directed toward advanced economies. Data show that within the OECD area, large immigration inflows are associated with low degrees of corruption. Given the small size of our sample, data do not allow for general rules; however, the data allow us to reject the common opinion according to which migrants export corruption toward destination countries1.
1
Notice that our data are based on official statistics and do not account for illegal immigration.
cap5.qxd
22/05/2007
8.20
Pagina
122
122
MARCO ARNONE - ELENI ILIOPULOS
CPI
Figure 5.7 - Corruption and immigration, year 2001 11 10 9 8 7 6 5 4 3 2 1 0 0.00
5.00
10.00
15.00
20.00
25.00
Number of foreigners, % total pop.
© 2007 Vita e Pensiero
Sources: Authors’ estimates from United Nations (2004) and TI data. CPI ranges between 10 (highly clean) and 0 (highly corrupt).
Our results are in keeping with Solivetti (2004), who shows that, in a sample of Western European countries, crime rates by ethnic groups are related to such variables as economic development, social protection, education, openness to diversity, institutional transparency, rule of law and black economy; specifically, crime rates by ethnic groups are inversely correlated with the above variables, except the black economy where the relationship is positive2. Additionally, in a study (with a somewhat different focus than this book) on criminal organizations composed of foreign-born members in Italy, Becucci (2006) shows that these organizations are much more vulnerable to repression policies than the criminal organizations formed by locally-born members; the reason is that the latter are well connected to local politicians and professionals and therefore more deeply rooted in the legal sectors of Italy than the former criminal organizations: these are thus less dangerous than local criminal organizations because they can be more easily eradicated. Although Becucci’s work deals specifically with criminal organizations in Italy, it confirms that even from a criminal perspective, the role of foreigners in illegal markets is less dangerous than that of well-connected locals. 2
Cited in Becucci (2006), p. 127-128.
cap5.qxd
22/05/2007
8.20
Pagina
123
© 2007 Vita e Pensiero
SOCIAL COSTS OF CORRUPTION
123
Mariani (2006) shows that migration is generally associated with low degrees of corruption also in source countries. He shows how in source countries the probability of migrating to a richer country reduces the relative return of rent-seeking; it follows that, if people can migrate, the fraction of skilled inhabitants of source countries who opt for rent-seeking activities generally tends to decrease. Thus migration per se is certainly not associated with high degrees of corruption. In keeping with theoretical research on immigration by Bosi, Iliopulos and Magris (2006), our empirical findings point to the opportunity of managing flows, and reject calls for closing doors to immigration. People have always moved from poorest lands towards better life conditions; migration is at the root of the survival of humankind. It is thus reasonable to think that migration will exist as long as economic wealth is concentrated in some developed areas of the world. It is not efficient to eliminate the phenomenon, but it is important that migrations flows are efficiently regulated. Granting immigrants legal status is not only a way to foster destination-country management of flows. It is first of all to the advantage of the destination-country’s population: indeed, the larger the share of the immigrant population that cannot live under a legal status, the more difficult it is for them to integrate in society and have a positive impact. The relevance of the contribution of immigrants to the economic and social development of a society can be shown with a direct reference to the experience of Silicon Valley: some of the most important ventures have been launched by non-American residents, and have greatly contributed to generate huge economic activity, attract highly skilled people in the area, generate new investments, and make people better off both economically and socially. Internet stars like Google and Yahoo! had immigrant founders, like the majority of the less spectacular – but nevertheless prosperous – ventures: recent research reported in Liedtke (2006) shows that in the period 1990-2005 one quarter of all the venture-backed initial public offerings (IPO) of stocks in Silicon Valley had at least one immigrant founder, and this proportion only drops a little (20%) over a 35-year period. Moreover, these firms complete their venture cycle and hit the market with an IPO in a shorter time span (6.8 years) than the ones founded by
cap5.qxd
22/05/2007
8.20
Pagina
124
124
MARCO ARNONE - ELENI ILIOPULOS
American-born entrepreneurs (9.3 years). Employers in Silicon Valley are using this clear evidence to pressurize the US authorities to let more immigrants in. How much Europeans could learn from this!
© 2007 Vita e Pensiero
5. Freedom of the media Freedom of speech and expression is one of the main principles at the basis of modern democracies. Clearly, freedom of thought, speech and expression are also necessary conditions for scientific and cultural progress. If these conditions are not granted, innovative and revolutionary ideas are hindered, impeding innovative reforms. Therefore, countries that experience low degrees of freedom of expression are also characterized by low degrees of human and cultural development. Restrictions to the freedom of speech and expression are not features of oppressing dictatorships or customs of ancient times only. Freedom of expression can be constrained (directly or indirectly) through a variety of means; in general, these restrictions take the form of direct or indirect censorship, which act as filters to the circulation of ideas. Indeed, indirect restrictions to freedom of expression are common practices throughout the advanced world too. Censorship is the outcome of explicit political choices of dictatorship-oriented politicians. Alternatively, censorship can take more hidden and masked forms – nonetheless very effective – and be practiced by powerful élites. Indeed, these practices are nothing more than “legal” tools aimed at constraining the free circulation of ideas; they thus violate the democratic principle of freedom of expression. The degree of freedom of expression in a country is reflected also in the condition of its media; it depends on the possibility that media can operate without being conditioned by external factors. In particular, a low degree of media freedom is associated with domestic markets which are not free or explicit political decisions not to intervene (e.g. via the lack of appropriate regulatory/supervisory authorities). In both cases, public access to information is limited and specific information kept secret. Obstacles to the freedom of expression are thus reflected in a significant
cap5.qxd
22/05/2007
8.20
Pagina
125
125
SOCIAL COSTS OF CORRUPTION
deterioration of the domestic degree of transparency; and therefore, in a significant decrease of the degree of accountability of institutions. Given the strong link between media freedom and the quality of governance and markets, it is reasonable to expect the existence of an additional correlation between media freedom and domestic corruption. Among the most important transmission channels, secrecy plays a significant role as an incentive for episodes of bribery. Figure 5.8 confirms the above considerations; data show that a high degree of domestic corruption is generally associated with a low degree of freedom of the press. Given its low degree of domestic corruption and its medium degree of press freedom, Singapore can be considered an outlier.
CPI
Figure 5.8 - Freedom of the media, year 2004 11 10 9 8 7 6 5 4 3 2 1 0
Singapore
0
20
40
60
80
100
120
Press freedom
© 2007 Vita e Pensiero
Sources: Authors’ estimates from TI and Freedom House (2004) data. CPI ranges between 10 (highly clean) and 0 (highly corrupt).
Education acts as an additional transmission channel that reinforces the link between corruption and media freedom. Indeed, high levels of education and good cultural standards are associated with a higher propensity to read newspapers (at the expenses of other media, such as television). This implies that the higher the level of education, the larger the amount of newspapers copies sold in a country (including the number of both different
cap5.qxd
22/05/2007
8.20
Pagina
126
126
MARCO ARNONE - ELENI ILIOPULOS
papers and copies of the same paper). Since the increase in educational standards is associated with a decrease in domestic bribery, we expect the existence of an additional (negative) correlation between the number of copies of newspaper sold each year in a country and its degree of domestic corruption. Figure 5.9 - Corruption and number of copies of newspapers, year 2004 12 10
CPI
8 6 4 2 0 0
100
200
300
400
500
600
Copies of newspapers, for thousand inhabitants Sources: Authors’ estimates from TI and The Economist (2004) data. CPI ranges between 10 (highly clean) and 0 (highly corrupt).
Figure 5.9 confirms the above considerations and shows that for the sample of 30 countries the larger the amount of copies, the lower their degree of domestic bribery. We can thus confirm the importance of the transmission channel that links education to corruption.
© 2007 Vita e Pensiero
6. Equity of justice The degree of human and social development of a country is reflected also in the capacity of its institutions to protect the rights of its citizens and to satisfy their needs; these conditions contribute to create a fair, equal and “inclusive” society3. It is important, though,
3
In chapter 3 the Gini index allowed us to focus on economic inequality.
cap5.qxd
22/05/2007
8.20
Pagina
127
127
SOCIAL COSTS OF CORRUPTION
to distinguish the qualitative features of legal systems (also reflected in the compliance with international standards, see chapter 4) and the perceptions of the citizens. Here we focus on the latter: high qualitative standards and good enforcement levels are not sufficient conditions for citizens to perceive that they are living with a fair judicial system. Citizens’ perceptions depend on the ability of the judiciary to be accessible and attentive to their needs. Notice again that the role of perceptions should not be underestimated: these perceptions are an indicator of the degree of citizens’ satisfaction with the ability of their institutions to confront current issues. They also reflect the trends of governance’ features (see chapter 4): the degree of satisfaction of the population can affect the “rule of law” of a country, as reflected in illegal acts, while institutions’ inability to understand the needs of citizens can hinder reforms.
CPI
Figure 5.10 - Equity of justice, year 2004 11 10 9 8 7 6 5 4 3 2 1 0 0
2
4
6
8
10
Justice
© 2007 Vita e Pensiero
Sources: Authors’ estimates from IMD (2004) and TI data. CPI ranges between 10 (highly clean) and 0 (highly corrupt). High levels of the Justice index indicate positive perceptions on the equity of the judiciary.
It is reasonable to believe that the strong link between the quality of governance and domestic bribery affects citizens’ perceptions relative to the fairness of justice (here defined as the legal and judicial system as a whole). Figure 5.10 confirms the above considerations; it shows that high levels of bribery are associated with citizens’ perceptions of injustice and unfairness.
cap5.qxd
22/05/2007
8.20
Pagina
128
128
MARCO ARNONE - ELENI ILIOPULOS
In Figure 5.11 we enlarge our analysis to citizens’ perceptions on domestic personal security. This context allows us to analyze current trends in light of the same transmission channels we considered relative to the perceptions on the judicial system. Figure 5.11 shows that low degrees of domestic corruption are generally associated with perceptions of high degrees of personal security.
CPI
Figure 5.11 - Personal security and private property, year 2004 11 10 9 8 7 6 5 4 3 2 1 0 0
2
4
6
8
10
Personal security and private property
© 2007 Vita e Pensiero
Sources: Authors’ estimates from IMD (2004) and TI data. CPI ranges between 10 (highly clean) and 0 (highly corrupt). High levels of the index of personal security indicates good positive perceptions.
Both chapter 4 and 5 have shown some of the many indirect costs of corruption for both institutions and society. It is important to remark that these costs have been underestimated. Also, social costs are heavier on the weakest segments of population, those with the lowest “social voice”; as a consequence, they have less impact on political decision making and are less represented: among these groups we wish to mention minors and immigrants. A society willing to give “voice” to these groups would be very wise; the recent debate to grant voting rights to legal immigrants in local elections and the proposal advanced by Campiglio (2005) to grant voting rights also to minors go exactly in this direction. Back to the Summary
cap6.qxd
22/05/2007
8.20
Pagina
129
CHAPTER VI
International Financial Institutions and their role in strengthening the “rule of law”
© 2007 Vita e Pensiero
1. Introduction In the last few decades several factors contributed to increase public awareness with regard to illegal international activities, like money laundering and corruption; since the early Nineties this has stimulated new research on their impact on the economy, institutions and society. The fall of the Soviet Union and the end of the Cold War, the diffusion of democracy, globalization of markets, and the development of internet and Information and Communication Technology (ICT) has made possible an incredible flow of information, goods and money. This resulted in increased difficulties for the authorities, equipped only with nation-wide repressive powers, to limit the growth of illegal financial activities internationally. This increased public awareness mentioned above has been stimulated by the catalyst role of the multilateral financial institutions: they promoted multilateral initiatives to fight corruption and money laundering, contributed to make public the negative impact of these activities, stimulated governments to take a more pro-active role in this fight. Among the most sensitive institutions, there are the UN, regional organizations like the African Union, the Council of Europe, the World Customs Organization, the European Union, the League of Arab States, the OECD, the Organization of American States, in addition to the IMF and the WB, and not-governmental organizations (NGO) like Transparency International. Given the multiplicity of initiatives intended to promote the “rule of law”, in this chapter we mainly concentrate on the most relevant projects led by the IMF and the WB.
cap6.qxd
22/05/2007
8.20
Pagina
130
130
MARCO ARNONE - ELENI ILIOPULOS
© 2007 Vita e Pensiero
2. International, non-governmental, and multilateral organization, and the “rule of law” An important contribution of multilateral and international organization in the fight against corruption and money laundering can be summarized in the creation of a set of rules/incentives finalized to direct and constrain economic agents’ behavior. Multilateral financial organizations, the WTO, and supervisory/regulatory institutions have spent plenty of resources in the definition of international transparency standards and codes of conduct. This regulatory activity has been twinned with an intense surveillance effort in member states. Even the disbursement of funds has, in some cases, been linked with the introduction of anticorruption or “law enhancing” rules; by constraining agents to “virtuous” behavior, many elements at the root of corruption have been removed. Moreover, by forcing governments to adopt more transparent data, consistent with international standards, the surveillance activity of the multilateral organization has indirectly favored a more transparent management of economic policies. With respect to non-governmental organizations, the risk that public resources could be used inefficiently or illegally induced some of them to extend the scope of their mission to include the rule of law. Among them we mention specifically Transparency International, whose mission is to fight corruption exclusively. The roots of the multilateral action against corruption rest in the “US Foreign Corrupt Practices Act” of 1977. The US example stimulated international organizations to take the same stand on corruption and illegal economic activities in general. In 1994 the OECD adopted regulations along the same lines and in 2003 the G8 issued a declaration against corruption (see below).
3. The World Bank initiatives The WB commitment against illegal activities, and specifically corruption, is extremely important for both the amount of resources
cap6.qxd
22/05/2007
8.20
Pagina
131
INTERNATIONAL FINANCIAL INSTITUTIONS
131
deployed and the number of countries involved1: from 1996 to 2004 it developed more than 600 initiatives involving around 100 countries. It has lent on average more than $5 billion per year to help member countries build efficient and transparent institutions. At the moment, more than 40% of the WB resources are devoted to the creation of a governance system in its member countries in line with international standards of good conduct. Governance-enhancing and anti-corruption initiatives are usually adopted jointly, in the context of a medium-term Country Assistance Strategy aimed at public expenditure management, fighting corruption, public services and judiciary reforms, tax and administration policies, decentralization, and the supply of public services. The WB activity against corruption has made clear that it is necessary to focus on four objectives: assistance to countries willing to fight corruption, introduction of anti-corruption policies as evaluation criterion for financial aid, support for anti-corruption initiatives, and financing initiatives to prevent corruption. The WB tools to fight corruption are presented below.
© 2007 Vita e Pensiero
3.1. World Bank strategies and instruments to strengthen the “rule of law” Given the complexity of the issue and the multiplicity of agents involved, the fight against corruption requires multi-faceted strategies. These strategies impact, on one side, the relationship between governments and, on the other, the relationship between the government and society, aiming at the following objectives: • Political accountability: Competition and credibility of political parties, transparent party financing, assets, and elimination of conflict of interest. • Civil society awareness and participation: the role of the NGO, freedom of information, and the possibility to intervene in the debate on bills under discussion. • Private sector competition: economic policy making, monopoly reforms, reduction of bureaucratic entry barriers; transparent management of firms and industrialists associations. 1
See Arnone and Mannozzi (2006), and World Bank (2005).
cap6.qxd
22/05/2007
132
8.20
Pagina
132
MARCO ARNONE - ELENI ILIOPULOS
• Limits to political powers: independent and transparent judiciary, conduct of the legislative power and implementation of laws. • Public sector management: meritocracy in the public sector with adequate rewards, budget management, tax and customs, decentralization, and accountability.
© 2007 Vita e Pensiero
These strategies must be implemented through several initiatives and with the help of diagnostic tools for the evaluation of government activities, databases and reports. The diagnostic tools are the result of the adaptation of some basic analytical tools to different environments. Among these, we mention Institutional and Governance Reviews (IGR), Public Expenditure Reviews (PER), Social and Structural Reviews, (SSR) and Poverty Reduction Strategy Papers (PRSP); the standardized instruments are addressed to: • Approval of legislative activity of a country’s government; • Evaluation of the constraints for public services supply; • Approval of a country’s institutional structure; • Diagnostics for public revenues management; • Evaluation of relationships among governments; • Evaluation of a country’s legal and judiciary system; • Evaluation of public expenditure systems; • Economic planning models. The WB prepares the following group of reports on corruption issues: • Country reports on families, public officers and private enterprises (World Bank Institute Step-by-Step Guide to the Implementation of the New Empirical Tools for Anti-Corruption and Institutional Reform – which include specific reports on Cambodia, Albania, Slovakia and Latvia; Diagnostic Surveys of Corruption in Romania, Bosnia and Herzegovina; Diagnostic Surveys of Corruption, 2001; A Diagnostic Study of Corruption in Indonesia. 2002). • Reports on business and enterprises (World Business Environment Survey; Measuring and Understanding Corruption at the Micro Level; World Business Environment Survey Interactive Dataset; Business Environment and Enterprise Performance Surveys (BEEPS); Anticorruption in Transition. A Contribution to the Policy Debate). • Reports on public officials (Albania, Argentina, Bangladesh, Bolivia, Bulgaria, Guyana, Indonesia, Kenya, Macedonia, Moldavia, and six Caribbean states).
cap6.qxd
22/05/2007
8.20
Pagina
133
INTERNATIONAL FINANCIAL INSTITUTIONS
133
• Public Expenditure Tracking Surveys • Data base on countries’ governance (World Bank Institute WebInteractive Access to Governance Indicators; World Bank Institute Governance Indicators World Map; World Bank Institute Step-by-Step Guide to the Implementation of the New Empirical Tools for AntiCorruption and Institutional Reform). • Other (Transparency International’s Bribe Payers Index (BPI); Transparency International's Corruption Perceptions Index (CPI); Corruption in Latvia: Survey Evidence, 1998).
© 2007 Vita e Pensiero
4. The role of the International Monetary Fund The prominence given to corruption control is linked directly to the activities within the scope of its mandate: corruption can influence a country’s economic performance so that the traditional duties of the Fund - macroeconomic surveillance, financial support to countries in a financial/balance of payment crisis, and technical assistance – are affected. In the case of countries where economic performance had been negatively affected by corruption, the Fund requested the implementation of anti-corruption reforms. The Fund has increased its collaboration with the WB to encourage countries’ behavior in the direction indicated in the codes of good conduct; moreover, it cooperates with the Financial Action Task Force on Money Laundering (FATF), the organization funded in 1989 by the G7 to define a common strategy and action against money laundering. Countries characterized by a weak financial sector – likely targets for illegal financial activities – are assisted by the Fund in the context of the Financial Sector Assessment Program (FSAP, in cooperation with the WB) through the utilization of standards and codes (see below). The surveillance activity initially limited to exchange rate policies has recently been extended and today it covers the financial sector, institutional aspects (including the creation of international codes and standards), and the evaluation of risks and weaknesses deriving from capital market volatility.
cap6.qxd
22/05/2007
134
8.20
Pagina
134
MARCO ARNONE - ELENI ILIOPULOS
© 2007 Vita e Pensiero
4.1. The Financial Action Task Force, the IMF, anti-money laundering and the international financial standards At end-2001, following the Sept. 11 attack to the Twin Towers and the Pentagon, the United States “encouraged” the international community to take a tougher stand on illegal money dealings that could be used to finance international terrorism. Under these circumstances, the International Monetary Fund and the World Bank, in conjunction with the Financial Action Task Force (FATF), launched in early 2002 a joint program: the Anti-Money Laundering and Combating the Financing of Terrorism (AML/CFT), whereby assessments of countries anti-money laundering (AML) framework – thus far undertaken by the FATF 2 and a host of regional bodies – would also be conducted by the IMF and the WB with the support of external experts, possibly affiliated to FATF or to its regional bodies (e.g.: GAFISUD). This specific program became another instrument in the set of tools that the international financial institutions have adopted in their long-standing efforts to uphold the “rule of law” considered a necessary condition for economic development. Therefore we briefly describe the instruments adopted by the international financial institutions to promote the “rule of law” in their quasiuniversal membership. The international organization designed to fight money laundering is the Financial Action Task Force on Money Laundering (FATF). Founded in 1989 by the G7, its mission was guided by the 40 Recommendations. After Sept. 11, 2001 its members subscribed 8 new Special Recommendations. The FATF strengthened collaboration with the IMF, the WB, the UN and other regional multilateral organizations for the implementation of these new special Eight Recommendations. The IMF added the Eight Recommendations to its Reports on Observance of Standards and Codes (ROSC): these reports assess the degree of compliance of countries to internationally agreed standards and codes of behavior in the financial sector. The Eight Recommendations specifically address the issue of terrorism financing: the first obliges member countries to adopt 2
For a definition of the Financial Action Task Force see Reuter and Truman (2004).
cap6.qxd
22/05/2007
8.20
Pagina
135
© 2007 Vita e Pensiero
INTERNATIONAL FINANCIAL INSTITUTIONS
135
the UN Convention against corruption (see above); the second financing terrorism and money laundering; the third requires seizure of goods and money belonging to terrorists; the fourth requires countries to communicate suspicious money transfer activities. Moreover, countries commit to adopt and implement an anti-money laundering framework that allow them to control all types of transactions (origin and intermediate steps, including international ones), remittances, and organizations, including NGO. Lastly, there is a requirement for international cooperation. Since 2004 assessment of the AML/CFT framework in member countries has become part of standard Fund activity. The AML/CFT assessment is undertaken usually as part of the FSAP. The latter aims at strengthening financial systems. It consists of the identification of weaknesses in the financial system and its stability, resilience to macroeconomic shocks, and specific remedial measures. The specific FSAP documents are not published (but are distributed to the IMF and WB Executive Boards), but summaries of the key elements constitutes the FSSA, which is published together with the Article IV consultation documents. In this context the IMF assesses the observance of standards and codes designed on the basis of best practices and aimed at “directing” member countries behaviors toward these practices. Among them, the codes promoting transparency among fiscal, monetary and financial institutions are: • The Code of Good Practices on Fiscal Transparency: it defines standards to collect and distribute information and data on the member countries fiscal system. It was adopted in 1998 and revised in 2001. • The Code of Good Practices on Transparency in Monetary and Financial Policies: it identifies practices used by central banks and financial agencies, and promotes transparency. It considers the roles, responsibilities and objectives of these institutions; transparency in the process of creation and dissemination of information on monetary and financial policies; accountability and “assurance” of central banks and financial institution integrity. Among the standards we mention: • Special Data Dissemination Standards (SDDS); for countries with capital market access. • General Data Dissemination System (GDDS); for all countries.
cap6.qxd
22/05/2007
8.20
Pagina
136
136
MARCO ARNONE - ELENI ILIOPULOS
5. The role of the G8 The G8 is the group of highly industrialized countries (G7) plus Russia that provides major directions in global economic policy. It deals with macroeconomic management, international trade and relations with developing countries. Several times it has dealt with East-West relations, energy, and terrorism. Its role has evolved to include in its agenda microeconomic issues, international organized crime and drug trafficking, global security and human rights, and arms dealings3. At the Evian Summit in France in June 2003 the G8 expressed a clear political direction regarding anticorruption activities. Keeping in mind that the G8 represents the major “shareholders” of international financial organizations, their political directions establish priorities for these organizations and a commitment on the G8 side. In their declaration at Evian the G8 requested, among other measures, the adoption of the OECD Convention on corruption of foreign public officials. Here is the text of the declarations: Box 6.1
© 2007 Vita e Pensiero
FIGHTING CORRUPTION AND INCREASING TRANSPARENCY G8 DECLARATION
[...] 2. We will strengthen the enforcement of our Anti-Bribery Laws and will encourage the private sector to develop related compliance programs. We will: 2.1. accelerate peer reviews of each country’s implementation of the OECD Convention on Combating Bribery of Foreign Public Officials, accompanied by the public release of these results, so as to complete a first cycle of reviews by 2007. We will work together with our OECD Convention partners to ensure stable, long-term financing for these reviews; 2.2. encourage the private sector to develop, implement and enforce corporate compliance programs relating to our domestic laws criminalizing foreign bribery.
3
G8 Research Group at the University of Toronto (www.g8.utoronto.ca/what_is_g8.html).
cap6.qxd
22/05/2007
8.20
Pagina
137
INTERNATIONAL FINANCIAL INSTITUTIONS
137
© 2007 Vita e Pensiero
3. We are committed to actively contributing to the completion of a UN Convention against Corruption. This should include effective preventive measures, effective mechanisms for international cooperation in criminal matters and asset recovery and it should provide an effective follow-up mechanism for monitoring implementation of the Convention. We encourage technical assistance for this purpose. We will each seek in accordance with national laws to deny safe haven to public officials guilty of corruption, by denying them entry, when appropriate, and using extradition and mutual legal assistance laws and mechanisms more effectively. 4. We reaffirm our commitment to fight financial abuses and to: 4.1. encourage wider accession to and ratification of the U.N. Convention on Transnational Organised Crime so that money laundering, corruption and other relevant crimes are universally criminalized and that all countries have the power to identify, trace, freeze or seize and ultimately confiscate and dispose of assets from the proceeds of these crimes. 4.2. require that our own financial institutions establish procedures and controls to conduct enhanced due diligence on accounts of “politically exposed persons”, and thereby to detect and report transactions that may involve proceeds of foreign official corruption. 4.3. support issuance in June by the Financial Action Task Force (FATF) of a revised 40 Recommendations that includes strong customer due diligence provisions, enhanced scrutiny for politically exposed persons and a requirement to make corruption and bribery a predicate offence for money laundering. 4.4. encourage all countries to work to come into compliance with the revised FATF Recommendations, and to apply the Basel Committee’s guidance on customer due diligence for their banking sectors. [...]
Back to the Summary
appendice_I.qxd
22/05/2007
8.20
Pagina
138
APPENDIX I
Notes on Figures
Figure 2.1: Corruption and new business creation, year 2004 Countries in the sample: Argentina, Australia, Austria, Belgium, Brazil, Canada, Chile, China, Colombia, Czech Republic, Denmark, Estonia, Finland, France, Germany, Greece, Hong Kong, Hungary, Iceland, India, Indonesia, Ireland, Israel, Italy, Japan, Jordan, Korea, Luxemburg, Malaysia, Mexico, Netherlands (The), New Zealand, Norway, Philippines, Poland, Portugal, Romania, Russia, Singapore, Slovak Republic, Slovenia, South Africa, Spain, Sweden, Switzerland, Taiwan, Thailand, Turkey, United Kingdom, USA, Venezuela. Figure 2.2: Corruption and days required to start a new business, year 2003 Countries in the sample: Argentina, Australia, Austria, Belgium, Brazil, Canada, Chile, China, Colombia, Czech Republic, Denmark, Estonia, Finland, France, Germany, Greece, Hong Kong, Hungary, Iceland, India, Indonesia, Ireland, Israel, Italy, Japan, Jordan, Korea, Luxemburg, Malaysia, Mexico, Netherlands (The), New Zealand, Norway, Philippines, Poland, Portugal, Romania, Russia, Singapore, Slovak Republic, Slovenia, South Africa, Spain, Sweden, Switzerland, Taiwan, Thailand, Turkey, United Kingdom, USA, Venezuela.
© 2007 Vita e Pensiero
Figure 2.3: Cost of capital and corruption, year 2004 The effects of cost of capital are very negative for values next to 0, and nil for values next to 10. The variable “effects of capital” reflects perceptions of agents with respect to the effects of decisions that influence the cost of capital in the economy. Countries in the sample: Argentina, Australia, Austria, Belgium, Brazil, Canada, Chile, China, Colombia, Czech Republic, Denmark, Estonia, Finland, France, Germany, Greece, Hong Kong, Hungary, Iceland, India, Indonesia, Ireland, Israel, Italy, Japan, Jordan, Korea, Luxemburg, Malaysia, Mexico, Netherlands (The), New Zealand, Norway, Philippines, Poland, Portugal, Romania, Russia, Singapore,
appendice_I.qxd
22/05/2007
8.20
Pagina
139
NOTES ON FIGURES
139
Slovak Republic, Slovenia, South Africa, Spain, Sweden, Switzerland, Taiwan, Thailand, Turkey, United Kingdom, USA, Venezuela. Figure 2.7: Efficient regulation of competition and corruption, year 2004 Countries in the sample: Argentina, Australia, Austria, Belgium, Brazil, Canada, Chile, China, Colombia, Czech Republic, Denmark, Estonia, Finland, France, Germany, Greece, Hong Kong, Hungary, Iceland, India, Indonesia, Ireland, Israel, Italy, Japan, Jordan, Korea, Luxemburg, Malaysia, Mexico, Netherlands (The), New Zealand, Norway, Philippines, Poland, Portugal, Romania, Russia, Singapore, Slovak Republic, Slovenia, South Africa, Spain, Sweden, Switzerland, Taiwan, Thailand, Turkey, United Kingdom, USA, Venezuela. Figure 2.8: Regulation of competition and firms’ competitiveness, year 2004 Countries in the sample: Argentina, Australia, Austria, Belgium, Brazil, Canada, Chile, China, Colombia, Czech Republic, Denmark, Estonia, Finland, France, Germany, Greece, Hong Kong, Hungary, Iceland, India, Indonesia, Ireland, Israel, Italy, Japan, Jordan, Korea, Luxemburg, Malaysia, Mexico, Netherlands (The), New Zealand, Norway, Philippines, Poland, Portugal, Romania, Russia, Singapore, Slovak Republic, Slovenia, South Africa, Spain, Sweden, Switzerland, Taiwan, Thailand, Turkey, United Kingdom, USA, Venezuela. Figure 2.9: Competitiveness and corruption, year 2004
© 2007 Vita e Pensiero
Countries in the sample: Argentina, Australia, Austria, Belgium, Brazil, Canada, Chile, China, Colombia, Czech Republic, Denmark, Estonia, Finland, France, Germany, Greece, Hong Kong, Hungary, Iceland, India, Indonesia, Ireland, Israel, Italy, Japan, Jordan, Korea, Luxemburg, Malaysia, Mexico, Netherlands (The), New Zealand, Norway, Philippines, Poland, Portugal, Romania, Russia, Singapore, Slovak Republic, Slovenia, South Africa, Spain, Sweden, Switzerland, Taiwan, Thailand, Turkey, United Kingdom, USA, Venezuela. Figure 2.10: Sectors where bribe payments to public officials are more frequent, perceptions for 2002 Precise comparisons are not possible between the 1999 and 2002 figures as values have changes substantially. The 2002 BPI has been calculated for the following countries: Argentina, Brazil, Colombia, Hungary, India, Indonesia, Mexico, Morocco, Nigeria, Philippines, Poland, Russia, South Africa, South Korea and Thailand.
appendice_I.qxd
22/05/2007
8.20
Pagina
140
140
APPENDIX I
Figure 2.11: Sectors where bribe payments to public officials are higher in amount, perceptions for 2002 The 2002 BPI has been calculated for the following countries: Argentina, Brazil, Colombia, Hungary, India, Indonesia, Mexico, Morocco, Nigeria, Philippines, Poland, Russia, South Africa, South Korea and Thailand. Figure 2.12: Corruption and business environment, year 2003 Countries in the sample: Argentina, Australia, Austria, Belgium, Brazil, Canada, Chile, China, Colombia, Czech Republic, Denmark, Finland, France, Germany, Greece, Hong Kong, Hungary, India, Ireland, Israel, Italy, Japan, Malaysia, Mexico, Netherlands (The), New Zealand, Norway, Philippines, Poland, Portugal, Russia, Singapore, Slovak Republic, South Africa, South Korea, Spain, Sweden, Switzerland, Taiwan, Thailand, United Kingdom, United States.
© 2007 Vita e Pensiero
Figure 3.1: Gross National Product per capita and domestic corruption, year 2003 Countries in the sample: Australia, Austria, Belgium, Canada, Denmark, Finland, France, Germany, Greece, Iceland, Ireland, Italy, Japan, Luxemburg, Netherlands (The), New Zealand, Norway, Portugal, Spain, Sweden, Switzerland, United Kingdom e United States, Argentina, Brazil, Bulgaria, Chile, China, Colombia, Czech Republic, Egypt, Estonia, Hong Kong, Hungary, India, Indonesia, Israel, Korea, Malaysia, Mexico, Pakistan, Peru, Philippines, Poland, Romania, Russia, Singapore, Slovak Republic, Slovenia, South Africa, Thailand e Turkey, Albania, Algeria, Angola, Armenia, Azerbaijan, Bangladesh, Belarus, Belize, Bolivia, Bosnia ed Herzegovina, Botswana, Cameroon, Congo, Costa Rica, Croatia, Dominican Republic, Ecuador, El Salvador, Ethiopia, Gambia, Georgia, Ghana, Guatemala, Haiti, Honduras, Iran, Iraq, Ivory Coast, Jamaica, Jordan, Kazakhstan, Kenya, Kuwait, Kyrgyzstan, Latvia, Lebanon, Libya, Lithuania, Macedonia, Madagascar, Malawi, Mali, Mauritius, Moldova, Morocco, Mozambique, Namibia, Nicaragua, Nigeria, Oman, Panama, Papua, Paraguay, Saudi Arabia, Senegal, Serbia and Montenegro, Sierra Leon, Sri Lanka, Sudan, Syria, Tajikistan, Tanzania, Trinidad e Tobago, Tunisia, Uganda, Ukraine, United Arab Emirates, Uruguay, Uzbekistan, Venezuela, Vietnam, Yemen, Zambia, Zimbabwe. Figure 3.2: Gross National Product per capita and domestic corruption, year 2003, advanced economies Countries in the sample: Australia, Austria, Belgium, Canada, Denmark,
appendice_I.qxd
22/05/2007
8.20
Pagina
141
NOTES ON FIGURES
141
Finland, France, Germany, Greece, Iceland, Ireland, Italy, Japan, Luxemburg, Netherlands (The), New Zealand, Norway Portugal, Spain, Sweden, Switzerland, United Kingdom and United States. Figure 3.3: Gross National Product per capita and domestic corruption, year 2003, emerging economies Countries in the sample: Argentina, Brazil, Bulgaria, Chile, China, Colombia, Czech Republic, Egypt, Estonia, Hong Kong, Hungary, India, Indonesia, Israel, Korea, Latvia, Malesya, Maroc, Mexico, Pakistan, Peru, Philippines, Philippines, Poland, Poland, Romania, Russia, Singapore, Slovak Republic, Slovenia, South Africa, Thailand, Turkey, Venezuela. Figure 3.4: Gross National Product per capita and domestic corruption, year 2003, developing economies Countries in the sample: Albania, Algeria, Angola, Armenia, Azerbaijan, Bangladesh, Belarus, Belize, Bolivia, Bosnia ed Erzegovina, Botswana, Cameroon, Congo, Costa Rica, Croazia, Dominican Republic, Ecuador, El Salvador, Ethiopia, Gambia, Georgia, Ghana, Guatemala, Haiti, Honduras, Iran, Iraq, Ivory Coast, Jamaica, Jordan, Kazakstan, Kenya, Kuwait, Kyrgyzstan, Lebanon, Libya, Lithuania, Macedonia, Madagascar, Malawi, Mali, Mauritius, Moldova, Mozambique, Namibia, Nicaragua, Nigeria, Oman, Panama, Papua, Paraguay, Saudi Arabia, Senegal, Serbia and Montenegro, Sierra Leon, Sri Lanka, Sudan, Syria, Tajikistan, Tanzania, Trinidad e Tobago, Tunisia, Uganda Ukraine, United Arab Emirates, Uruguay, Uzbekistan, Vietnam, Yemen, Zambia, Zimbabwe.
© 2007 Vita e Pensiero
Figure 3.5: Economic growth and domestic corruption, 1993-2002, 2003 The CPI refers to 2003, while GDP growth rates are averages of 1993-2002. Countries in the sample: Australia, Austria, Belgium, Canada, Denmark, Finland, France, Germany, Greece, Iceland, Italy, Japan, Luxemburg, Netherlands (The), New Zealand, Norway, Portugal, Spain, Sweden, Switzerland, United Kingdom e United States, Argentina, Brazil, Bulgaria, Chile, China, Colombia, Czech Republic, Estonia, Hong Kong, Hungary, India, Indonesia, Israel, Korea, Malesya, Mexico, Pakistan, Philippines, Romania, Russia, Singapore, Slovak Republic, South Africa, Thailand, Turkey, Albania, Algeria, Angola, Armenia, Azerbaijan, Bahrain, Bangladesh, Belarus, Belize, Bolivia, Botswana, Cameroon, Cipro, Congo, Costa Rica, Croazia, Dominican Republic, Ecuador, Egypt, El Salvador, Ethiopia, Gambia, Georgia, Ghana,
appendice_I.qxd
22/05/2007
142
8.20
Pagina
142
APPENDIX I
Guatemala, Haiti, Honduras, Iran, Ivory Coast, Jamaica, Jordan, Kazakstan, Kenya, Kuwait, Kyrgyzstan, Latvia, Lebanon, Lithuania, Macedonia, Madagascar, Malawi, Mali, Maroc, Mauritius, Moldova, Mozambique, Namibia, Nicaragua, Nigeria, Oman, Panama, Papua, Paraguay, Peru, Poland, Senegal, Sierra Leon, Sri Lanka, Sudan, Syria, Tajikistan, Tanzania, Trinidad e Tobago, Tunisia, Uganda, Ukraine, United Arab Emirates, Uruguay, Uzbekistan, Venezuela, Vietnam, Yemen, Zambia, Zimbabwe Figure 3.6: Economic growth and domestic corruption, 1993-2002, 2003, advanced economies The CPI refers to 2003, while GDP growth rates are averages of 19932002. Countries in the sample: Australia, Austria, Belgium, Canada, Cyprus, Denmark, Finland, France, Germany, Greece, Iceland, Italy, Japan, Luxemburg, Netherlands (The), New Zealand, Norway, Portugal, Spain, Sweden, Switzerland, United Kingdom and United States. Figure 3.7: Economic growth and domestic corruption, 1993-2002, 2003, emerging economies The CPI refers to 2003, while GDP growth rates are averages of 19932002. Countries in the sample: Argentina, Brazil, Bulgaria, Chile, China, Colombia, Czech Republic, Estonia, Hong Kong, Hungary, India, Indonesia, Israel, Korea, Latvia, Lithuania, Malaysia, Mexico, Morocco, Pakistan, Peru, Philippines, Poland, Romania, Russia, Singapore, Slovak Republic, South Africa, Thailand, Turkey, Venezuela.
© 2007 Vita e Pensiero
Figure 3.8: Economic growth and domestic corruption, 1993-2002, 2003, developing economies The CPI refers to 2003, while GDP growth rates are averages of 19932002. (see paragraph 3.6). Countries in the sample: Albania, Algeria, Angola, Armenia, Azerbaijan, Bahrain, Bangladesh, Belarus, Belize, Bolivia, Botswana, Cameroon, Cipro, Congo, Costa Rica, Croazia, Dominican Republic, Ecuador, El Salvador, Ethiopia, Gambia, Georgia, Ghana, Guatemala, Haiti, Honduras, Iran, Ivory Coast, Jamaica, Jordan, Kazakstan, Kenya, Kuwait, Kyrgyzstan, Lebanon, Macedonia, Madagascar, Malawi, Mali, Mauritius, Moldova, Mozambique, Namibia, Nicaragua, Nigeria, Oman, Panama, Papua, Paraguay, Senegal, Sierra Leon, Sri Lanka, Sudan, Syria, Tajikistan, Tanzania, Trinidad e Tobago, Tunisia, Uganda, Ukraine,
appendice_I.qxd
22/05/2007
8.20
Pagina
143
NOTES ON FIGURES
143
United Arab Emirates, Uruguay, Uzbekistan, Vietnam, Yemen, Zambia, Zimbabwe. Figure 3.9: Cost of investment risk and corruption, 2002, 2003 The risk index refers to 2002. Given the high degree of persistence and the larger sample size, the CPI refers to 2003. Countries in the sample: Albania, Algeria, Angola, Argentina, Armenia, Australia, Austria, Azerbaijan, Bahrain, Bangladesh, Belarus, Belgium, Bolivia, Bosnia ed Herzegovina, Botswana, Brazil, Bulgaria, Cameroon, Canada, Chile, China, Colombia, Congo, Costa Rica, Croatia, Cyprus, Czech Republic, Denmark, Dominican Republic, Ecuador, Egypt, El Salvador, Estonia, Ethiopia, Finland, France, Gambia, Georgia, Germany, Ghana, Greece, Guatemala, Haiti, Honduras, Hong Kong, Hungary, Iceland, India, Indonesia, Iran, Iraq, Ireland, Israel, Italy, Ivory Coast, Jamaica, Japan, Jordan, Kazakhstan, Kenya, Latvia, Lebanon, Libya, Lithuania, Luxemburg, Madagascar, Malawi, Malaysia, Mali, Mauritius, Mexico, Moldova, Morocco, Mozambique, Myanmar, Namibia, Netherlands (The), New Zealand, Nicaragua, Nigeria, Norway, Oman, Pakistan, Panama, Papua, Paraguay, Peru, Philippines, Poland, Portugal, Qatar, Romania, Russia, Saudi Arabia, Senegal, Serbia and Montenegro, Sierra Leon, Singapore, Slovak Republic, Slovenia, South Africa, South Korea, Spain, Sri Lanka, Sudan, Sweden, Switzerland, Syria, Tajikistan, Tanzania, Thailand, Trinidad and Tobago, Tunisia, Turkey, Uganda, Ukraine, United Arab Emirates, United Kingdom, United States, Uruguay, Venezuela, Vietnam, Yemen, Zambia, Zimbabwe.
© 2007 Vita e Pensiero
Figure 3.10: Interest rate spreads and corruption, 2002-2003 The CPI refers to 2003, while the spread (lending rate minus deposit rate) refers to 2002. Countries in the sample: Albania, Algeria, Angola, Argentina, Armenia, Australia, Austria, Azerbaijan, Bahrain, Bangladesh, Belarus, Belgium, Bolivia, Bosnia ed Herzegovina, Botswana, Brazil, Bulgaria, Cameroon, Canada, Chile, China, Colombia, Congo, Costa Rica, Croatia, Cyprus, Czech Republic, Denmark, Dominican Republic, Ecuador, Egypt, El Salvador, Estonia, Ethiopia, Finland, France, Gambia, Georgia, Germany, Ghana, Greece, Guatemala, Haiti, Honduras, Hong Kong, Hungary, Iceland, India, Indonesia, Iran, Iraq, Ireland, Israel, Italy, Ivory Coast, Jamaica, Japan, Jordan, Kazakhstan, Kenya, Latvia, Lebanon, Libya, Lithuania, Luxemburg, Madagascar, Malawi, Malaysia, Mali, Mauritius, Mexico, Moldova, Morocco, Mozambique, Myanmar, Namibia, Netherlands (The), New Zealand, Nicaragua, Nigeria, Norway, Oman, Pakistan, Panama, Papua, Paraguay, Peru, Philippines, Poland,
appendice_I.qxd
22/05/2007
8.20
Pagina
144
144
APPENDIX I
Portugal, Qatar, Romania, Russia, Saudi Arabia, Senegal, Serbia and Montenegro, Sierra Leon, Singapore, Slovak Republic, Slovenia, South Africa, South Korea, Spain, Sri Lanka, Sudan, Sweden, Switzerland, Syria, Tajikistan, Tanzania, Thailand, Trinidad and Tobago, Tunisia, Turkey, Uganda, Ukraine, United Arab Emirates, United Kingdom, United States, Uruguay, Venezuela, Vietnam, Yemen, Zambia, Zimbabwe. Figure 3.11: Corruption and FDI, year 2002, advanced countries Countries in the sample: Australia, Austria, Belgium, Canada, Denmark, Finland, France, Germany, Greece, Iceland, Ireland, Italy, Japan, Netherlands (The), New Zealand, Norway, Spain, Sweden, Switzerland, United Kingdom, United States. Figure 3. 12: Corruption and FDI, year 2002, emerging economies Countries in the sample: Argentina, Brazil, Chile, China, Colombia, Croazia, Czech Republic, Egypt, Estonia, Estonia, Hong Kong, Hungary, India, Indonesia, Israel, Korea, Latvia, Lithuania, Malesya, Maroc, Mexico, Pakistan, Peru, Philippines, Poland, Romania, Russia, Singapore, Slovak Republic, Slovenia, South Africa, Thailand, Turkey, Venezuela. Figure 3.13: Corruption and FDI, year 2002, developing countries Countries in the sample: Albania, Bangladesh, Belarus, Bolivia, Botswana, Bulgaria, Cameroon, Costa Rica, Dominican Republic, Ecuador, El Salvador, Ethiopia, Georgia, Ghana, Guatemala, Haiti, Honduras, Ivory Coast, Jamaica, Jordan, Kazakhstan, Kenya, Madagascar, Malawi, Mauritius, Moldova, Mozambique, Nicaragua, Nigeria, Panama, Paraguay, Senegal, Slovenia, Sri Lanka, Tanzania, Trinidad and Tobago, Tunisia, Uganda, Ukraine, Uruguay, Uzbekistan, Vietnam, Zambia, Zimbabwe.
© 2007 Vita e Pensiero
Figure 3.14: Exported corruption, countries where corporations tend to bribe public officials, years 1999, 2002 Countries in the sample are: Argentina, Brazil, Colombia, Hungary, India, Indonesia, Mexico, Morocco, Nigeria, Philippines, Poland, Russia, South Africa, South Korea and Thailand. Figure 3.15: Domestic corruption and exported corruption, year 1999 Countries in the sample are: Argentina, Brazil, Colombia, Hungary, India, Indonesia, Mexico, Morocco, Nigeria, Philippines, Poland, Russia, South Africa, South Korea and Thailand.
appendice_I.qxd
22/05/2007
8.20
Pagina
145
NOTES ON FIGURES
145
Figure 3.16: Domestic corruption and exported corruption, year 2002 Countries in the sample are: Argentina, Brazil, Colombia, Hungary, India, Indonesia, Mexico, Morocco, Nigeria, Philippines, Poland, Russia, South Africa, South Korea and Thailand. Figure 3.17: Spending on education, year 2000 In percent of GDP; UK 1999. Figure 3.18: Corruption and population with a secondary school qualification, year 2003 Countries in the sample: Austria, Belgium, Canada, Denmark, Finland, Germany, Greece, Ireland, Italy, Netherlands (The), Portugal, Spain, United Kingdom, United States.
© 2007 Vita e Pensiero
Figure 3.19: Corruption and inflation, 2000-2004, 2004 Inflation is an average of 2000-2004. Countries in the sample: Albania, Algeria, Argentina, Armenia, Australia, Austria, Azerbaijan , Bahrain, Bangladesh, Barbados, Belgium, Belize, Benin, Bolivia, Botswana, Brazil, Bulgaria, Cameroon, Canada, Chad, Chile, China, Cipro, Colombia, Costa Rica, Croazia, Czech Republic, Denmark, Dominican Republic, Ecuador, Egypt, El Salvador, Estonia, Ethiopia, Finland, France, Gabon, Georgia, Germany, Ghana, Greece, Guatemala, Haiti, Honduras, Hong Kong, Hungary, Iceland, India, Indonesia, Iran, Ireland, Israel, Italy, Ivory Coast, Jamaica, Japan, Jordan, Kazakstan, Kenya, Korea, Kuwait, Kyrgyzstan, Latvia, Lebanon, Libya, Lithuania, Luxemburg, Macedonia, Madagascar, Malawi, Malesya, Mali, Malta, Maroc, Mauritius, Mexico, Moldova, Mongolia, Mozambique, Namibia, Nepal, Netherlands (The), New Zealand, Nicaragua, Niger, Nigeria, Norway, Oman, Pakistan, Panama, Papua, Paraguay, Peru, Philippines, Poland, Portugal, Qatar, Romania, Russia, Senegal, Seychelles, Sierra Leon, Singapore, Slovak Republic, Slovenia, South Africa, Spain, Sri Lanka, Sudan, Sweden, Switzerland, Syria, Taiwan, Tajikistan, Tanzania, Thailand, Trinidad and Tobago, Tunisia, Turkey, Turkmenistan, Uganda, Ukraine, United Arab Emirates Uniti, United Kingdom, United States, Uruguay, Uzbekistan, Venezuela, Vietnam, Yemen, Zambia. Figure 3.20: Public revenues (in percent of GDP) and CPI Public revenues (in percent of GDP, transfers excluded) refer to 2000, while the CPI to 2002.
appendice_I.qxd
22/05/2007
8.20
Pagina
146
146
APPENDIX I
Countries in the sample: Argentina, Belarus, Bolivia, Bulgaria, Canada, Chile, Costa Rica, Croazia, Czech Republic, Denmark, Dominican Republic, El Salvador, Estonia, Georgia, Haiti, Hungary, India, Indonesia, Israel, Ivory Coast, Jamaica, Jordan, Kazakstan, Latvia, Lithuania, Madagascar, Mauritius, Mexico, Moldova, Namibia, New Zealand, Nicaragua, Pakistan, Panama, Paraguay, Peru, Philippines, Poland, Romania, Russia, Senegal, Singapore, Slovak Republic, Slovenia, South Africa, Sri Lanka, Switzerland, Thailand, Tunisia, Turkey, Uganda, Ukraine, Uruguay, USA, Venezuela, Vietnam. Figure 3.21: Tax revenues, year 2000, and corruption, year 2002 Fiscal revenues (in percent of GDP, transfers excluded) refer to 2000, while the CPI to 2002. Countries in the sample: Argentina, Belarus, Bolivia, Bulgaria, Canada, Chile, Costa Rica, Croatia, Czech Republic, El Salvador, Estonia, Georgia, Hungary, India, Indonesia, Israel, Ivory Coast, Jamaica, Jordan, Kazakhstan, Latvia, Lithuania, Mauritius, Moldova, New Zealand, Nicaragua, Pakistan, Paraguay, Peru, Philippines, Poland, Romania, Russia, Senegal, Singapore, Slovak Republic, Slovenia, South Africa, Sri Lanka, Thailand, Turkey, Uganda, Ukraine, Uruguay, USA, Venezuela, Vietnam. Figure 3.22: Corruption, year 2002, and public spending on education, year 2000, advanced countries Education expenditure (in percent of GDP) refer to 2000, and CPI to 2002. Countries in the sample: Australia, Austria, Canada, Denmark, Finland, France, Germany, Greece, Iceland, Ireland, Italy, Japan, New Zealand, Norway, Portugal, USA.
© 2007 Vita e Pensiero
Figure 3.23: Corruption, year 2002, and public spending on education, year 2000, emerging economies Education expenditure (in percent of GDP) refer to 2000, and CPI to 2002. Countries in the sample: Argentina, Brazil, Chile, Czech Republic, Hungary, India, Indonesia, Israel, Latvia, Malaysia, Morocco, Pakistan, Philippines, Poland, Russia, Slovak Republic, Thailand, Turkey. Figure 3.24: Corruption, year 2002, and public spending on education, year 2000, developing countries Education expenditure (in percent of GDP) refer to 2000, and CPI to 2002.
appendice_I.qxd
22/05/2007
8.20
Pagina
147
NOTES ON FIGURES
147
Countries in the sample: Angola, Azerbaijan, Bangladesh, Bolivia, Cameroon, Colombia, Costa Rica, El Salvador, Ethiopia, Georgia, Guatemala, Ivory Coast, Jamaica, Kenya, Madagascar, Mauritius, Moldova, Niger, Panama, Paraguay, Senegal, Trinidad and Tobago, Tunisia, Ukraine, Uruguay. Figure 3.25: Corruption, year 2002, and public investments, year 2000 Public investments (in percent of GDP) refers to 2000, and the CPI to 2002. Countries in the sample: Argentina, Belarus, Bolivia, Bulgaria, Canada, Chile, Costa Rica, Croazia, Czech Republic, Denmark, Dominican Republic, El Salvador, Estonia, Georgia, Haiti, Hungary, India, Israel, Ivory Coast, Jamaica, Jordan, Kazakstan, Latvia, Lithuania, Madagascar, Mauritius, Mexico, Moldova, Namibia, New Zealand, Nicaragua, Pakistan, Panama, Paraguay, Peru, Philippines, Poland, Romania, Russia, Senegal, Singapore, Slovak Republic, Slovenia, South Africa, Sri Lanka, Switzerland, Thailand, Tunisia, Turkey, Uganda, Ukraine, Uruguay, USA, Venezuela, Vietnam. Figure 3.26: Corruption and public sector size, year 2002, OECD countries Countries in the sample: Sweden, Denmark, Belgium, Finland, France, Norway, Italy, Austria, Iceland, Netherlands (The), Germany, Spain, United Kingdom, New Zealand, Canada, Australia, Ireland, Switzerland, Japan, USA. Figure 3.27: Corruption and fiscal transparency, year 2004
© 2007 Vita e Pensiero
Countries in the sample: Albania, Armenia, Azerbaijan, Bangladesh, Benin, Brazil, Bulgaria, Cameroon, Canada, Chile, Colombia, Czech Republic, Estonia, France, Georgia, Germany, Ghana, Greece, Honduras, Hungary, India, Iran, Israel, Italy, Japan, Kazakstan, Korea, Kyrgyzstan, Latvia, Lithuania, Malawi, Mali, Mexico, Mongolia, Mozambique, Nicaragua, Pakistan, Papua, Peru, Philippines, Poland, Portugal, Romania, Slovak Republic, Slovenia, Sri Lanka, Sweden, Tanzania, Tunisia, Turkey, Uganda, Ukraine, United States, Uruguay. Figure 3.28: Economic inequality and corruption, years 1984-2002 Countries in the sample: Albania, Algeria, Argentina, Armenia, Australia, Austria, Azerbaijan, Bangladesh, Belarus, Belgium, Bolivia, Bosnia ed Erzegovina, Botswana, Brazil, Bulgaria, Cameroon, Canada, Chile, China, Colombia, Costa Rica, Croazia, Czech Republic, Denmark, Dominican Republic, Ecuador, Egypt, El Salvador, Estonia, Ethiopia,
appendice_I.qxd
22/05/2007
8.20
Pagina
148
148
APPENDIX I
Finland, France, Gambia, Georgia, Germany, Ghana, Greece, Guatemala, Honduras, Hong Kong, Hungary, India, Indonesia, Iran, Ireland, Israel, Italy, Ivory Coast, Jamaica, Japan, Jordan, Kazakstan, Kenya, Kyrgyzstan, Latvia, Le, Lithuania, Luxemburg, Macedonia, Madagascar, Malawi, Malesya, Mali, Maroc, Mexico, Moldova, Mozambique, Namibia, Netherlands (The), New Zealand, Nicaragua, Nigeria, Norway, Pakistan, Panama, Papua, Paraguay, Peru, Philippines, Poland, Portugal, Romania, Russia, Senegal, Sierra Leon, Singapore, Slovak Republic, Slovenia, South Africa, South Korea, Spain, Sri Lanka, Sweden, Switzerland, Tajikistan, Tanzania, Thailand, Trinidad e Tobago, Tunisia, Turkey, Uganda, Ukraine, United Kingdom, Uruguay, USA, Uzbekistan, Venezuela, Vietnam, Yemen, Zambia, Zimbabwe. Figure 3.29: CPI in 1995 and 2004: a comparison Countries in the sample: Argentina, Australia, Austria, Belgium, Brazil, Canada, Chile, China, Colombia, Denmark, Finland, France, Germany, Greece, Hong Kong, Hungary, India, Indonesia, Ireland, Italy, Japan, Malaysia, Mexico, Netherlands (The), New Zealand, Norway, Philippines, Portugal, Singapore, South Africa, South Korea, Spain, Sweden, Switzerland, Taiwan, Thailand, Turkey, United Kingdom, USA, Venezuela.
© 2007 Vita e Pensiero
Figure 4.1: Regulatory quality and corruption CPI 2004 and governance variables 2002 in order to have larger comparable samples. Countries in the sample: Albania, Algeria, Angola, Argentina, Armenia, Australia, Austria, Azerbaijan, Bahrain, Bangladesh, Barbados, Belarus, Belgium, Belize, Benin, Bolivia, Bosnia ed Herzegovina, Botswana, Brazil, Bulgaria, Cameroon, Canada, Chad, Chile, China, Colombia, Costa Rica, Croatia, Cuba, Cyprus, Czech Republic, Democratic republic of Congo, Denmark, Dominican Republic, Ecuador, Egypt, El Salvador, Eritrea, Estonia, Ethiopia, Finland, France, Gabon, Gambia, Georgia, Germany, Ghana, Greece, Guatemala, Haiti, Honduras, Hong Kong, Hungary, Iceland, India, Indonesia, Iran, Iraq, Ireland, Israel, Italy, Jamaica, Japan, Jordan, Kazakhstan, Kenya, Kuwait, Kyrgyzstan, Latvia, Lebanon, Libya, Lithuania, Luxemburg, Macedonia, Madagascar, Malawi, Malaysia, Mali, Malta, Mauritius, Mexico, Moldova, Mongolia, Morocco, Mozambique, Myanmar, Namibia, Nepal, Netherlands (The), New Zealand, Nicaragua, Niger, Nigeria, Norway, Oman, Pakistan, Panama, Papua, Paraguay, Peru, Philippines, Poland, Portugal, Qatar, Republic of Congo, Romania, Russia, Saudi Arabia, Senegal, Sierra Leon, Singapore, Slovak Republic, Slovenia, South Africa, South Korea, Spain, Sri Lanka, Sudan, Suriname, Sweden,
appendice_I.qxd
22/05/2007
8.20
Pagina
149
NOTES ON FIGURES
149
Switzerland, Syria, Taiwan, Tajikistan, Tanzania, Thailand, Trinidad and Tobago, Tunisia, Turkey, Turkmenistan, Uganda, Ukraine, United Arab Emirates, United Kingdom, Uruguay, USA, Uzbekistan, Venezuela, Vietnam, Yemen, Zambia, Zimbabwe. Figure 4.3: Quality and quantity of regulations, year 2002 Countries in the sample: Albania, Algeria, Angola, Argentina, Armenia, Australia, Austria, Azerbaijan, Bahrain, Bangladesh, Barbados, Belarus, Belgium, Belize, Benin, Bolivia, Bosnia ed Erzegovina, Botswana, Brazil, Bulgaria, Cameroon, Canada, Chad, Chile, China, Cipro, Colombia, Costa Rica, Croazia, Cuba, Czech Republic, Denmark, Dominican Republic, Ecuador, Egypt, El Salvador, Eritrea, Estonia, Ethiopia, Finland, France, Gabon, Gambia, Gamica, Georgia, Germany, Ghana, Greece, Guatemala, Haiti, Honduras, Hong Kong, Hungary, Iceland, India, Indonesia, Iran, Iraq, Ireland, Israel, Italy, Japan, Jordan, Kazakstan, Kenya, Kuwait, Kyrgyzstan, Latvia, Lebanon, Libya, Lithuania, Luxemburg, Macedonia, Madagascar, Malawi, Malesya, Mali, Malta, Maroc, Mauritius, Mexico, Moldova, Mongolia, Mozambique, Myanmar, Namibia, Nepal, Netherlands (The), New Zealand, Nicaragua, Niger, Nigeria, Norway, Oman, Pakistan, Panama, Papua, Paraguay, Peru, Philippines, Poland, Portugal, Qatar, Repubblica del Congo, Repubblica Democratica del Congo, Romania, Russia, Saudi Arabia, Senegal, Sierra Leon, Singapore, Slovak Republic, Slovenia, South Africa, South Korea, Spain, Sri Lanka, Sudan, Suriname, Sweden, Switzerland, Syria, Taiwan, Tajikistan, Tanzania, Thailand, Trinidad and Tobago, Tunisia, Turkey, Turkmenistan, Uganda, Ukraine, United Arab Emirates, United Kingdom, Uruguay, USA, Uzbekistan, Venezuela, Vietnam, Yemen, Zambia, Zimbabwe.
© 2007 Vita e Pensiero
Figure 4.4: Regulation and corruption Countries in the sample: Albania, Algeria, Angola, Argentina, Armenia, Australia, Austria, Azerbaijan, Bahrain, Bangladesh, Barbados, Belarus, Belgium, Belize, Benin, Bolivia, Bosnia ed Erzegovina, Botswana, Brazil, Bulgaria, Cameroon, Canada, Chad, Chile, China, Cipro, Colombia, Costa Rica, Croazia, Cuba, Czech Republic, Denmark, Dominican Republic, Ecuador, Egypt, El Salvador, Eritrea, Estonia, Ethiopia, Finland, France, Gabon, Gambia, Gamica, Georgia, Germany, Ghana, Greece, Guatemala, Haiti, Honduras, Hong Kong, Hungary, Iceland, India, Indonesia, Iran, Iraq, Ireland, Israel, Italy, Japan, Jordan, Kazakstan, Kenya, Kuwait, Kyrgyzstan, Latvia, Lebanon, Libya, Lithuania, Luxemburg, Macedonia, Madagascar, Malawi, Malesya, Mali, Malta, Maroc, Mauritius, Mexico, Moldova, Mongolia, Mozambique,
appendice_I.qxd
22/05/2007
150
8.20
Pagina
150
APPENDIX I
Myanmar, Namibia, Nepal, Netherlands (The), New Zealand, Nicaragua, Niger, Nigeria, Norway, Oman, Pakistan, Panama, Papua, Paraguay, Peru, Philippines, Poland, Portugal, Qatar, Repubblica del Congo, Repubblica Democratica del Congo, Romania, Russia, Saudi Arabia, Senegal, Sierra Leon, Singapore, Slovak Republic, Slovenia, South Africa, South Korea, Spain, Sri Lanka, Sudan, Suriname, Sweden, Switzerland, Syria, Taiwan, Tajikistan, Tanzania, Thailand, Trinidad and Tobago, Tunisia, Turkey, Turkmenistan, Uganda, Ukraine, United Arab Emirates, United Kingdom, Uruguay, USA, Uzbekistan, Venezuela, Vietnam, Yemen, Zambia, Zimbabwe. Figure 4.5: Banking supervision and perceived corruption, year 2004 Countries in the sample: Albania, Algeria, Armenia, Austria, Azerbaijan, Bahrain, Bangladesh, Barbados, Belize, Bolivia, Botswana, Brazil, Bulgaria, Cameroon, Canada, Chile, Cipro, Colombia, Costa Rica, Croazia, Czech Republic, Dominican Republic,, Ecuador, Egypt, El Salvador, Estonia, Finland, France, Gabon, Georgia, Germany, Ghana, Guatemala, Honduras, Hong Kong, Hungary, Iceland, India, Indonesia, Iran, Ireland, Israel, Italy, Ivory Coast, Jamaica, Japan, Jordan, Kazakstan, Kenya, Korea, Kuwait, Kyrgyzstan, Latvia, Lebanon, Lithuania, Luxemburg, Macedonia, Madagascar, Malta, Mauritius, Mexico, Mozambique, New Zealand, Nigeria, Oman, Pakistan, Panama, Peru, Philippines, Poland, Russia, Seychelles, Singapore, Slovak Republic, Slovenia, South Africa, Sri Lanka, Sweden, Switzerland, Tanzania, Thailand, Tunisia, Turkey, Uganda, Ukraine, United Arab Emirates Uniti, United Kingdom, Yemen, Zambia.
© 2007 Vita e Pensiero
Figure 4.6: Transparency in banking supervision and conformity with Basel Core Principles, year 2004 Countries in the sample: Armenia, Bangladesh, Barbados, Brazil, Bulgaria, Cameroon, Canada, Costa Rica, Croazia, Czech Republic, Dominican Republic, Egypt, Estonia, Finland, France, Gabon, Georgia, Germany, Ghana, Guatemala, Hong Kong, Hungary, Iceland, India, Iran, Ireland, Israel, Ivory Coast, Kazakstan, Korea, Kyrgyzstan, Latvia, Lithuania, Luxemburg, Malta, Malta, Mauritius, Mexico, Nigeria, Peru, Philippines, Poland, Russia, Slovak Republic, Sri lanka, Switzerland, Tunisia, Uganda, Ukraine, United Arab Emirates Uniti, United Kingdom, Zambia. Figure 4.7: Corruption and quality of securities markets supervision, year 2004 Countries in the sample: Argentina, Armenia, Bangladesh, Barbados, Brazil, Bulgaria, Croazia, Czech Republic, Egypt, Estonia, Finland,
appendice_I.qxd
22/05/2007
8.20
Pagina
151
NOTES ON FIGURES
151
Georgia, Germany, Ghana, Hong Kong, Hungary, Iceland, India, Ireland, Israel, Kazakstan, Korea, Latvia, Lithuania, Luxemburg, Malta, Maroc, Mexico, Nigeria, Philippines, Poland, Russia, Senegal, Slovak Republic, Slovenia, South Africa, Sri Lanka, Sweden, Switzerland, Tunisia, Ucraine, United Kingdom. Figure 4.8: Quality and transparency of supervision in securities markets, year 2004 Countries in the sample: Argentina, Armenia, Bangladesh, Barbados, Brazil, Bulgaria, Croazia, Czech Republic, Estonia, Estonia, Finalndia, Germany, Hong Kong, Hungary, Iceland, India, Ireland, Israel, Kazakstan, Korea, Latvia, Lithuania, Luxemburg, Malta, Maroc, Mexico, Nigeria, Philippines, Poland, Russia, Slovak Republic, Sri Lanka, Tunisia, Ukraine, United Kingdom. Figure 4.9: Corruption and insurance markets supervision, year 2004 Countries in the sample: Argentina, Armenia, Barbados, Brazil, Bulgaria, Cameroon, Canada, Croazia, Czech Republic, Dominican Republic, Egypt, Estonia, Finland, Gabon, Georgia, Ghana, Hong Kong, Hungary, Iceland, Ireland, Israel, Kazakstan, Korea, Latvia, Lithuania, Luxemburg, Mexico, Nigeria, Philippines, Poland, Russia, Senegal, Slovak Republic, Slovenia, South Africa, Sweden, Switzerland, Tunisia, United Kingdom. Figure 4.10: Quality and transparency of insurance markets supervision, year 2004 Countries in the sample: Argentina, Barbados, Brazil, Canada, Croatia, Czech Republic, Egypt, Estonia, Finland, Gabon, Georgia, Ghana, Hong Kong, Hungary, Iceland, Ireland, Israel, Kazakhstan, Korea, Latvia, Lithuania, Luxemburg, Mexico, Nigeria, Poland, Russia, Slovak Republic, Switzerland, Tunisia, United Kingdom.
© 2007 Vita e Pensiero
Figure 4.11: Transparency of monetary policy, year 2004 Countries in the sample: Albania, Algeria, Argentina, Armenia, Bangladesh, Barbados, Bolivia, Brazil, Bulgaria, Cameroon, Canada, Chile, Costa Rica, Croatia, Czech Republic, Dominican Republic, Egypt, El Salvador, Estonia, Gabon, Georgia, Ghana, Guatemala, Hong Kong, Hungary, Iceland, India, Iran, Israel, Japan, Kazakhstan, Kenya, Korea, Kyrgyzstan, Latvia, Lithuania, Malta, Mauritius, Mexico, Morocco, New Zealand, Nigeria, Oman, Pakistan, Peru, Philippines, Poland, Romania, Russia, Senegal, Singapore, Slovak Republic, Sri Lanka, Switzerland,
appendice_I.qxd
22/05/2007
8.20
Pagina
152
152
APPENDIX I
Tunisia, Uganda, Ukraine, United Arab Emirates, United Kingdom, Zambia. Figure 4.12: Corruption and accountability CPI 2004 and governance variables 2002 in order to have larger comparable samples. Countries in the sample: Albania, Algeria, Angola, Argentina, Armenia, Australia, Austria, Azerbaijan, Bahrain, Bangladesh, Barbados, Belarus, Belgium, Belize, Benin, Bolivia, Bosnia ed Erzegovina, Botswana, Brazil, Bulgaria, Cameroon, Canada, Chad, Chile, China, Cipro, Colombia, Costa Rica, Croazia, Cuba, Czech Republic, Denmark, Dominican Republic, Ecuador, Egypt, El Salvador, Eritrea, Estonia, Ethiopia, Finland, France, Gabon, Gambia, Gamica, Georgia, Germany, Ghana, Greece, Guatemala, Haiti, Honduras, Hong Kong, Hungary, Iceland, India, Indonesia, Iran, Iraq, Ireland, Israel, Italy, Japan, Jordan, Kazakstan, Kenya, Kuwait, Kyrgyzstan, Latvia, Lebanon, Libya, Lithuania, Luxemburg, Macedonia, Madagascar, Malawi, Malesya, Mali, Malta, Maroc, Mauritius, Mexico, Moldova, Mongolia, Mozambique, Myanmar, Namibia, Nepal, Netherlands (The), New Zealand, Nicaragua, Niger, Nigeria, Norway, Oman, Pakistan, Panama, Papua, Paraguay, Peru, Philippines, Poland, Portugal, Qatar, Repubblica del Congo, Repubblica Democratica del Congo, Romania, Russia, Saudi Arabia, Senegal, Sierra Leon, Singapore, Slovak Republic, Slovenia, South Africa, South Korea, Spain, Sri Lanka, Sudan, Suriname, Sweden, Switzerland, Syria, Taiwan, Tajikistan, Tanzania, Thailand, Trinidad and Tobago, Tunisia, Turkey, Turkmenistan, Uganda, Ukraine, United Arab Emirates, United Kingdom, Uruguay, USA, Uzbekistan, Venezuela, Vietnam, Yemen, Zambia, Zimbabwe.
© 2007 Vita e Pensiero
Figure 4.14: Political stability and corruption CPI 2004 and governance variables 2002 in order to have larger comparable samples. Countries in the sample: Albania, Algeria, Angola, Argentina, Armenia, Australia, Austria, Azerbaijan, Bahrain, Bangladesh, Barbados, Belarus, Belgium, Belize, Benin, Bolivia, Bosnia ed Herzegovina, Botswana, Brazil, Bulgaria, Cameroon, Canada, Chad, Chile, China, Colombia, Costa Rica, Croatia, Cuba, Cyprus, Czech Republic, Democratic Republic of Congo, Denmark, Dominican Republic, Ecuador, Egypt, El Salvador, Eritrea, Estonia, Ethiopia, Finland, France, Gabon, Gambia, Georgia, Germany, Ghana, Greece, Guatemala, Haiti, Honduras, Hong Kong, Hungary, Iceland, India, Indonesia, Iran, Iraq, Ireland, Israel, Italy, Jamaica, Japan, Jordan, Kazakhstan, Kenya, Kuwait,
appendice_I.qxd
22/05/2007
8.20
Pagina
153
NOTES ON FIGURES
153
Kyrgyzstan, Latvia, Lebanon, Libya, Lithuania, Luxemburg, Macedonia, Madagascar, Malawi, Malaysia, Mali, Malta, Mauritius, Mexico, Moldova, Mongolia, Morocco, Mozambique, Myanmar, Namibia, Nepal, Netherlands (The), New Zealand, Nicaragua, Niger, Nigeria, Norway, Oman, Pakistan, Panama, Papua, Paraguay, Peru, Philippines, Poland, Portugal, Qatar, Republic of Congo, Romania, Russia, Saudi Arabia, Senegal, Sierra Leon, Singapore, Slovak Republic, Slovenia, South Africa, South Korea, Spain, Sri Lanka, Sudan, Suriname, Sweden, Switzerland, Syria, Taiwan, Tajikistan, Tanzania, Thailand, Trinidad and Tobago, Tunisia, Turkey, Turkmenistan, Uganda, Ukraine, United Arab Emirates, United Kingdom, Uruguay, USA, Uzbekistan, Venezuela, Vietnam, Yemen, Zambia, Zimbabwe.
© 2007 Vita e Pensiero
Figure 4.16: Corruption and the rule of law CPI 2004 and governance variables 2002 in order to have larger comparable samples. Countries in the sample: Albania, Algeria, Angola, Argentina, Armenia, Australia, Austria, Azerbaijan, Bahrain, Bangladesh, Barbados, Belarus, Belgium, Belize, Benin, Bolivia, Bosnia ed Herzegovina, Botswana, Brazil, Bulgaria, Cameroon, Canada, Chad, Chile, China, Colombia, Costa Rica, Croatia, Cuba, Cyprus, Czech Republic, Democratic Republic of Congo, Denmark, Dominican Republic, Ecuador, Egypt, El Salvador, Eritrea, Estonia, Ethiopia, Finland, France, Gabon, Gambia, Georgia, Germany, Ghana, Greece, Guatemala, Haiti, Honduras, Hong Kong, Hungary, Iceland, India, Indonesia, Iran, Iraq, Ireland, Israel, Italy, Jamaica, Japan, Jordan, Kazakhstan, Kenya, Kuwait, Kyrgyzstan, Latvia, Lebanon, Libya, Lithuania, Luxemburg, Macedonia, Madagascar, Malawi, Malaysia, Mali, Malta, Mauritius, Mexico, Moldova, Mongolia, Morocco, Mozambique, Myanmar, Namibia, Nepal, Netherlands (The), New Zealand, Nicaragua, Niger, Nigeria, Norway, Oman, Pakistan, Panama, Papua, Paraguay, Peru, Philippines, Poland, Portugal, Qatar, Republic of Congo, Romania, Russia, Saudi Arabia, Senegal, Sierra Leon, Singapore, Slovak Republic, Slovenia, South Africa, South Korea, Spain, Sri Lanka, Sudan, Suriname, Sweden, Switzerland, Syria, Taiwan, Tajikistan, Tanzania, Thailand, Trinidad and Tobago, Tunisia, Turkey, Turkmenistan, Uganda, Ukraine, United Arab Emirates, United Kingdom, Uruguay, USA, Uzbekistan, Venezuela, Vietnam, Yemen, Zambia, Zimbabwe. Figure 4.19: Government effectiveness and domestic corruption CPI 2004 and governance variables 2002 in order to have larger comparable samples.
appendice_I.qxd
22/05/2007
8.20
Pagina
154
154
APPENDIX I
Countries in the sample: Albania, Algeria, Angola, Argentina, Armenia, Australia, Austria, Azerbaijan, Bahrain, Bangladesh, Barbados, Belarus, Belgium, Belize, Benin, Bolivia, Bosnia ed Herzegovina, Botswana, Brazil, Bulgaria, Cameroon, Canada, Chad, Chile, China, Colombia, Costa Rica, Croatia, Cuba, Cyprus, Czech Republic, Democratic Republic of Congo, Denmark, Dominican Republic, Ecuador, Egypt, El Salvador, Eritrea, Estonia, Ethiopia, Finland, France, Gabon, Gambia, Georgia, Germany, Ghana, Greece, Guatemala, Haiti, Honduras, Hong Kong, Hungary, Iceland, India, Indonesia, Iran, Iraq, Ireland, Israel, Italy, Jamaica, Japan, Jordan, Kazakhstan, Kenya, Kuwait, Kyrgyzstan, Latvia, Lebanon, Libya, Lithuania, Luxemburg, Macedonia, Madagascar, Malawi, Malaysia, Mali, Malta, Mauritius, Mexico, Moldova, Mongolia, Morocco, Mozambique, Myanmar, Namibia, Nepal, Netherlands (The), New Zealand, Nicaragua, Niger, Nigeria, Norway, Oman, Pakistan, Panama, Papua, Paraguay, Peru, Philippines, Poland, Portugal, Qatar, Republic of Congo, Romania, Russia, Saudi Arabia, Senegal, Sierra Leon, Singapore, Slovak Republic, Slovenia, South Africa, South Korea, Spain, Sri Lanka, Sudan, Suriname, Sweden, Switzerland, Syria, Taiwan, Tajikistan, Tanzania, Thailand, Trinidad and Tobago, Tunisia, Turkey, Turkmenistan, Uganda, Ukraine, United Arab Emirates, United Kingdom, Uruguay, USA, Uzbekistan, Venezuela, Vietnam, Yemen, Zambia, Zimbabwe.
© 2007 Vita e Pensiero
Figure 4.22: Corruption and democratic governance, 2003-2004 CPI 2004 and governance variables 2002 in order to have larger comparable samples. Countries in the sample: Albania, Algeria, Angola, Argentina, Armenia, Australia, Austria, Azerbaijan, Bahrain, Bangladesh, Belarus, Belgium, Benin, Bolivia, Bosnia, Botswana, Brazil, Bulgaria, Cameroon, Canada, Chad, Chile, China, Colombia, Costa Rica, Croatia, Cuba, Cyprus, Czech Republic, Denmark, Dominican Republic, Ecuador, Egypt, El Salvador, Eritrea, Estonia, Ethiopia, Finland, France, Gabon, Gambia, Georgia, Germany, Ghana, Greece, Guatemala, Haiti, Honduras, Hungary, India, Indonesia, Iran, Iraq, Ireland, Israel, Italy, Jamaica, Japan, Jordan, Kazakhstan, Kenya, Korea, Kyrgyzstan, Latvia, Lebanon, Libya, Lithuania, Macedonia, Madagascar, Malawi, Malaysia, Mali, Mauritius, Mexico, Moldova, Mongolia, Morocco, Mozambique, Myanmar, Namibia, Nepal, Netherlands (The), New Zealand, Nicaragua, Niger, Nigeria, Norway, Oman, Pakistan, Panama, Papua, Paraguay, Peru, Philippines, Poland, Portugal, Qatar, Romania, Russia, Saudi Arabia, Senegal, Serbia and Montenegro, Sierra Leon, Singapore, Slovak Republic, Slovenia, South Africa, Spain, Sri Lanka, Sudan,
appendice_I.qxd
22/05/2007
8.20
Pagina
155
NOTES ON FIGURES
155
Sweden, Switzerland, Syria, Taiwan, Tajikistan, Tanzania, Thailand, Trinidad, Tunisia, Turkey, Turkmenistan, Uganda, Ukraine, United Arab Emirates, United Kingdom, Uruguay, USA, Uzbekistan, Venezuela, Vietnam, Yemen, Zambia, Zimbabwe. Figure 5.1: Corruption and human development Countries in the sample: Albania, Algeria, Angola, Argentina, Armenia, Australia, Austria, Azerbaijan, Bahrain, Bangladesh, Barbados, Belarus, Belgium, Belize, Benin, Bolivia, Bosnia and Herzegovina, Botswana, Brazil, Bulgaria, Cameroon, Canada, Chad, Chile, China, China, Cipro, Colombia, Congo, Costa Rica, Croatia, Csta d'Avorio, Cuba, Czech Republic, Denmark, Dominican Republic, Ecuador, Egypt, El Salvador, Eritrea, Estonia, Ethiopia, Finland, France, Gabon, Gambia, Georgia, Germany, Ghana, Greece, Guatemala, Haiti, Honduras, Hong Kong, Hungary, Iceland, India, Indonesia, Iran, Ireland, Israel, Italy, Jamaica, Japan, Jordan, Kazakstan, Kenya, Korea, Kuwait, Kyrgyzstan, Latvia, Lebanon, Libya, Lithuania, Luxemburg, Macedonia, Madagascar, Malawi, Malesya, Mali, Malta, Maroc, Mauritius, Mexico, Moldova, Mongolia, Mozambique, Myanmar, Namibia, Nepal, Netherlands (The), New Zealand, Nicaragua, Niger, Nigeria, Norway, Oman, Pakistan, Panama, Papua, Paraguay, Peru, Philippines, Poland, Portugal, Qatar, Rep. Dem.del Congo, Romania, Russia, Saudi Arabia, Senegal, Seychelles, Sierra Leon, Singapore, Slovak Republic, Slovenia, South Africa, Spain, Sri Lanka, Sudan, Suriname, Sweden, Switzerland, Syria, Tajikistan, Tanzania, Thailand, Trinidad and Tobago, Tunisia, Turkey, Turkmenistan, Uganda, Ukraine, United Arab Emirates, United Kingdom, Uruguay, USA, Uzbekistan, Venezuela, Vietnam, Yemen, Zambia, Zimbabwe.
© 2007 Vita e Pensiero
Figure 5.2: Corruption and public spending on health, advanced economies Health expenditure data for 2001, CPI 2004. Countries in the sample: Australia, Austria, Belgium, Canada, Denmark, Finland, France, Germany, Greece, Iceland, Ireland, Italy, Japan, Luxemburg, Netherlands (The), New Zealand, Norway, Portugal, Spain, Sweden, Switzerland, United Kingdom, USA. Figure 5.3: Corruption and public spending on health, emerging economies Health expenditure data for 200, and CPI 2004. Countries in the sample: Argentina, Bolivia, Brazil, Bulgaria, Chile, China, Cipro, Cipro, Colombia, Croazia, Czech Republic, Egypt, Estonia, Georgia, Hungary, India, Indonesia, Israel, Korea, Korea,
appendice_I.qxd
22/05/2007
8.20
Pagina
156
156
APPENDIX I
Latvia, Lithuania, Malesya, Malta, Mexico, Pakistan, Philippines, Poland, Romania, Russia, Slovak Republic, Slovenia, South Africa. Singapore has been excluded as outlier. Chile also shows significant distance from the regression line of emerging economies. Figure 5.4: Corruption and public spending on health, developing countries Countries in the sample: Albania, Algeria, Angola, Armenia, Azerbaijan, Bahrain, Bangladesh, Barbados, Belarus, Belize, Benin, Bosnia and Herzegovina, Botswana, Cameroon, Chad, Democratic Republic of Congo, Republic of Congo, Costa Rica, Côte d'Ivoire, Cuba, Dominican Republic, Ecuador, El Salvador, Eritrea, Ethiopia, Gabon, Gambia, Ghana, Guatemala, Haiti, Honduras, Iran, Jamaica, Jordan, Kazakhstan, Kenya, Kuwait, Kyrgyzstan, Lebanon, Libya, Macedonia, Madagascar, Malawi, Mali, Mauritius, Moldova, Mongolia, Morocco, Mozambique, Myanmar, Namibia, Nepal, Nicaragua, Niger, Nigeria, Oman, Panama, Papua, Paraguay, Peru, Qatar, Saudi Arabia, Senegal, Seychelles, Sierra Leon, Sri Lanka, Sudan, Suriname, Syria, Tajikistan, Tanzania, Thailand, Trinidad and Tobago, Tunisia, Turkey, Turkmenistan, Uganda, Ukraine, United Arab Emirates, Uruguay, Uzbekistan, Venezuela, Vietnam, Yemen, Zambia, Zimbabwe.
© 2007 Vita e Pensiero
Figure 5.5: Women in parliament and corruption, year 2004 Countries in the sample: Albania, Algeria, Angola, Argentina, Armenia, Australia, Austria, Azerbaijan, Bahrain, Bangladesh, Barbados, Belarus, Belgium, Belize, Benin, Bolivia, Bosnia and Herzegovina, Botswana, Brazil, Bulgaria, Cameroon, Canada, Chad, Chile, China, China, Colombia, Costa Rica, Côte d'Ivoire, Croatia, Cuba, Cyprus, Czech Republic, Democratic Republic of Congo, Denmark, Dominican Republic, Ecuador, Egypt, El Salvador, Eritrea, Estonia, Ethiopia, Finland, France, Gabon, Gambia, Georgia, Germany, Ghana, Greece, Guatemala, Haiti, Honduras, Hong Kong, Hungary, Iceland, India, Indonesia, Iran, Ireland, Israel, Italy, Jamaica, Japan, Jordan, Kazakhstan, Kenya, Korea, Kuwait, Kyrgyzstan, Latvia, Lebanon, Libya, Lithuania, Luxemburg, Macedonia, Madagascar, Malawi, Malaysia, Mali, Malta, Mauritius, Mexico, Moldova, Mongolia, Morocco, Mozambique, Myanmar, Namibia, Nepal, Netherlands (The), New Zealand, Nicaragua, Niger, Nigeria, Norway, Oman, Pakistan, Panama, Papua, Paraguay, Peru, Philippines, Poland, Portugal, Qatar, Republic of Congo, Romania, Russia, Saudi Arabia, Senegal, Seychelles, Sierra Leon, Singapore, Slovak Republic, Slovenia, South Africa, Spain, Sri Lanka, Sudan, Suriname, Sweden, Switzerland, Syria, Tajikistan, Tanzania, Thailand, Trinidad and Tobago, Tunisia, Turkey, Turkmenistan,
appendice_I.qxd
22/05/2007
8.20
Pagina
157
NOTES ON FIGURES
157
Uganda, Ukraine, United Arab Emirates, United Kingdom, Uruguay, USA, Uzbekistan, Venezuela, Vietnam, Yemen, Zambia, Zimbabwe. Figure 5.6: Corruption and gender empowerment, year 2004 Countries in the sample: Argentina, Australia, Austria, Bahrain, Bangladesh, Barbados, Belgium, Belize, Bolivia, Botswana, Canada, Chile, Cipro, Colombia, Costa Rica, Croazia, Czech Republic, Denmark, Dominican Republic, Ecuador, Egypt, El Salvador, Estonia, Finland, Georgia, Germany, Greece, Honduras, Hungary, Iceland, Iran, Ireland, Israel, Italy, Japan, Korea, Latvia, Lithuania, Macedonia, Malesya, Malta, Mexico, Moldova, Mongolia, Namibia, Netherlands (The), New Zealand, Norway, Pakistan, Panama, Paraguay, Peru, Philippines, Poland, Portugal, Romania, Russia, Saudi Arabia, Singapore, Slovak Republic, Slovenia, Spain, Sri Lanka, Sweden, Switzerland, Thailand, Trinidad and Tobago, Turkey, Ukraine, United Kingdom, Uruguay, USA, Venezuela, Yemen. Figure 5.7: Corruption and immigration, year 2001 Data on Poland, France, New Zealand and Mexico refer to the previous year. Countries in the sample: Australia, Austria, Belgium, Canada, Czech Republic, Denmark, Finland, France, Germany, Greece, Hungary, Ireland, Italy, Japan, Korea, Mexico, Netherlands (The), New Zealand, Norway, Poland, Portugal, Slovak Republic, Spain, Switzerland.
© 2007 Vita e Pensiero
Figure 5.8: Freedom of the media, year 2004 Countries in the sample: Albania, Algeria, Angola, Argentina, Armenia, Australia, Austria, Azerbaijan, Bahrain, Bangladesh, Barbados, Belarus, Belgium, Belize, Benin, Bolivia, Bosnia and Herzegovina, Botswana, Brazil, Bulgaria, Cameroon, Canada, Chad, Chile, China, Cipro, Colombia, Congo, Costa Rica, Cote d´Ivoire, Croazia, Cuba, Czech Republic, Denmark, Dominican Republic, Ecuador, Egypt, El Salvador, Eritrea, Estonia, Ethiopia, Finland, France, Gabon, Gambia, Georgia, Germany, Ghana, Greece, Guatemala, Haiti, Honduras, Hungary, Iceland, India, Indonesia, Iran, Iraq, Ireland, Israel, Italy, Jamaica, Japan, Jordan, Kazakstan, Kenya, Korea, Kuwait, Kyrgyzstan, Latvia, Lebanon, Libya, Lithuania, Luxemburg, Macedonia, Madagascar, Malawi, Malesya, Mali, Malta, Maroc, Mauritius, Mexico, Moldova, Mongolia, Mozambique, Namibia, Nepal, Netherlands (The), Nicaragua, Niger, Nigeria, Norway, Oman, Pakistan, Panama, Papua, Paraguay, Peru, Philippines, Poland, Portugal, Qatar, Repubblica
appendice_I.qxd
22/05/2007
8.20
Pagina
158
158
APPENDIX I
Democratica del Congo, Romania, Russia, Saudi Arabia, Senegal, Seychelles, Sierra Leon, Singapore, Slovak Republic, Slovenia, South Africa, Spain, Sri Lanka, Sudan, Suriname, Sweden, Switzerland, Syria, Taiwan, Tajikistan, Tanzania, Thailand, Trinidad and Tobago, Tunisia, Turkey, Turkmenistan, Uganda, Ukraine, United Arab Emirates, United Kingdom, Uruguay, USA, Uzbekistan, Venezuela, Vietnam, Yemen, Yugoslavia, Zambia, Zimbabwe. Figure 5.9: Corruption and number of copies of newspapers, year 2004 Countries in the sample: Australia, Austria, Belgium, Bulgaria, China, Croatia, Czech Republic, Denmark, Estonia, Finland, France, Germany, Hong Kong, Hungary, Ireland, Japan, Latvia, Malaysia, Netherlands (The), New Zealand, Norway, Singapore, Slovak Republic, Slovenia, Spain, Sweden, Switzerland, Ukraine, United Kingdom, United States. Figure 5.10: Equity of justice, year 2004 Countries in the sample: Argentina, Australia, Austria, Belgium, Brazil, Canada, Chile, China, Colombia, Czech Republic, Denmark, Estonia, Finland, France, Germany, Greece, Hong Kong, Hungary, Iceland, India, Indonesia, Ireland, Israel, Italy, Japan, Jordan, Korea, Luxemburg, Malaysia, Mexico, Netherlands (The), New Zealand, Norway, Philippines, Poland, Portugal, Romania, Russia, Singapore, Slovak Republic, Slovenia, South Africa, Spain, Sweden, Switzerland, Taiwan, Thailand, Turkey, United Kingdom, USA, Venezuela. Figure 5.11: Personal security and private property, year 2004
© 2007 Vita e Pensiero
Countries in the sample: Argentina, Australia, Austria, Belgium, Brazil, Canada, Chile, China, Colombia, Czech Republic, Denmark, Estonia, Finland, France, Germany, Greece, Hong Kong, Hungary, Iceland, India, Indonesia, Ireland, Israel, Italy, Japan, Jordan, Korea, Luxemburg, Malaysia, Mexico, Netherlands (The), New Zealand, Norway, Philippines, Poland, Portugal, Romania, Russia, Singapore, Slovak Republic, Slovenia, South Africa, Spain, Sweden, Switzerland, Taiwan, Thailand, Turkey, United Kingdom, USA, Venezuela.
Back to the Summary
appendice_II.qxd
22/05/2007
8.20
Pagina
159
APPENDIX II
Data sources
The Corruption Perceptions Index (CPI) evaluates the level of perception related to the domestic corruption. Its reliability, internationally acknowledged, is due to the fact that this index is the result of components taken from different sources and appropriately weighed. Ratings range in value from 10 (least corrupt) to 0 (most corrupt). The CPI focuses on corruption in the public sector and defines corruption as the abuse of public office for private gain. In the CPI, data from 14 surveys are combined to measure the perceptions of local residents, expatriates, business people, academics, and risk analysts. Assessments from the past three years (1999-2001) are combined. For further information, consult: J.G. Lambsdorff. 2001. Background Paper to the 2001 Corruption Perceptions Index. Available on-line at http://www.transparency.org/cpi/2001/ dnld/methodology.pdf
© 2007 Vita e Pensiero
The Polity Index of Democracy/Autocracy is a scale from -10 to +10 measuring the degree to which a nation is either autocratic or democratic. A score of +10 indicates a strongly democratic state; a score of -10 a strongly autocratic state. According to the structure of this indicator, fully democratic governments have three essential elements: 1- fully competitive political participation, 2 - institutionalized constraints on executive power 3 - guarantee of civil liberties to all citizens in their daily lives and in political participation. A fully autocratic system sharply restricts or suppresses competitive political participation. A complete explanation of the index is available in the Polity IV Project Dataset User’s Manual, online at http://www.bsos.umd.edu/cidcm/inscr/polity/polreg.htm The indicators of ease of doing business, creation of firms, cost of capital, start up days, competition legislation, competitiveness, justice, personal security and private property, are released on a yearly frequency by IMD (see the World Competitiveness Yearbook), together with a variety of indicators concerning competitiveness and firms. The World Competitiveness Yearbook features 51 industrialized and emerging countries, including 9 regional economies (Bavaria, Catalonia, Ile-de-France, Lombardy,
appendice_II.qxd
160
22/05/2007
8.20
Pagina
160
APPENDIX II
Maharashtra, Rhone-Alps, Scotland, State of Sao Paulo and Zhejiang). It provides 323 different criteria, grouped into four Competitiveness Factors. The data are taken from international, national and regional organizations and private institutes and the survey data are drawn from the annual Executive Opinion Survey (over 4,000 respondents). Accuracy is assurde through various collaborations with 57 Partner Institutes worldwide. It has been published since 1989. For further information on the indicators, consult: IMD, IMD World Competitiveness Yearbook, http://www01.imd.ch/wcc/yearbook/. The indicator of business environment measures the degree of opportunity of creating a new business in a country. Scores are the result of a weighted sum of various sub-indices such as the market potential, fiscal policies and labor regulation, infrastructures, labor potentialities and skills, the political framework. For further information on the indicators, see: World in Figures, 2004 Edition, The Economist.
© 2007 Vita e Pensiero
The index of fiscal transparency is released in the framework of the Code on Good Practices on Fiscal Transparency, signed by IMF in 1998. According to the Code, IMF evaluate the consistency of countries policies with the guide principles; these evaluations are recorded in the Fiscal Transparency Reports on Standard Codes (ROCS). The index of fiscal transparency is based on qualitative information contained in the ROCS. For further information, see Haamed (2005). The indicators World Bank Governance Indicators of voice and accountability, quality of regulation, political stability and absence of violence, government effectiveness and control of corruption measure six key dimensions of governance. They cover 213 countries and territories, and are based on several hundred variables, drawn from 31 separate data sources constructed by 25 different organizations. These six indicators are the starting point of all disposable empirical evidence on governance features. They focus on the processes by which governments are selected, monitored and replaced; on the capacity of governments to effectively formulate and implement sound policies; and on the respect of citizens and the state for the institutions that govern economic and social interactions among them. For further methodological aspects, see Kaufmann, Kraay and Mastruzzi (2004) and www.worldbank.org/wbi/governance/govdata2002/ The indicators of transparency of monetary policy, banking supervision transparency, financial supervision transparency, insurance market supervision transparency are based on the IMF-WB FSAP evaluations. Similar considerations apply for the indicator of quality of banking supervision (relative
appendice_II.qxd
22/05/2007
8.20
DATA SOURCES
Pagina
161
161
to the consistency with the Basel Core Principles), the indicator of quality of financial supervision (relative to the consistence with the IOSCO principles) and the indicator of quality of insurance markets supervision (relative to the consistence with the IAIS principles). See Arnone, Darbar and Gambini (2007). The Gender Empowerment Measure (GEM) reflects the level of women’s participation to the socio-political-economic life of society. The data we use are recorded in the UN Human Development Report 2004. This index consists in the weighted average of 3 sub-indices: the indicator of participation to economic life (i.e. both the indicator that account for the number of female legislators, senior officials and managers, and the indicator that accounts for the number of female professionals and technicians), the indicator of women participation to the political life (the indicator of the number of seats in parliament held by women) and the indicator of income differences (i.e. the ratio of estimated female to male earned income). The latter reflects all possible discriminations in income distribution.
© 2007 Vita e Pensiero
Press Freedom is an index, defined by Freedom House as “the degree to which each country permits the free flow of information” on a scale of 1 to 100. Countries with a score between 1 and 30 are considered to have a “Free” media; 31 to 60, “Partly Free”; and 61 to 100, “Not Free”. Freedom House emphasizes that this survey does not measure press responsibility; rather, it measures the degree of freedom in the flow of information. Data are collected from overseas correspondents, staff travel, international visitors, the findings of human rights organizations, specialists in geographic and geopolitical areas, the reports of governments, and a variety of domestic and international news media. The final index measures three separate categories of influence on the media: national laws and administrative decisions; censorship and intimidation; and quotas, licensing biases, or government funding.
Back to the Summary
indice_figure.qxd
22/05/2007
8.20
Pagina
162
LIST OF FIGURES
Chapter 2 Figure 2.1: Corruption and new business creation, year 2004 Figure 2.2: Corruption and days required to start a new business, year 2003 Figure 2.3: Cost of capital and corruption, year 2004 Figure 2.4: Main obstacles to businesses: OECD and emerging economies, year 2004 Figure 2.5: Costs of crime, year 2004 Figure 2.6: Costs of terrorism and organized crime for firms, year 2004 Figure 2.7: Efficient regulation of competition and corruption, year 2004 Figure 2.8: Regulation of competition and firms’ competitiveness, year 2004 Figure 2.9: Competitiveness and corruption, year 2004 Figure 2.10: Sectors where bribe payments to public officials are more frequent, perceptions for 2002 Figure 2.11: Sectors where bribe payments to public officials are higher in amount, perceptions for 2002 Figure 2.12: Corruption and business environment, year 2003
21 22 25 27 28 29 30 31 32 34 35 39
© 2007 Vita e Pensiero
Chapter 3 Figure 3.1: Gross National Product per capita and domestic corruption, year 2003 Figure 3.2: Gross National Product per capita and domestic corruption, year 2003, advanced economies Figure 3.3: Gross National Product per capita and domestic corruption, year 2003, emerging economies Figure 3.4: Gross National Product per capita and domestic corruption, year 2003, developing economies Figure 3.5: Economic growth and domestic corruption, 1993-2002, 2003
41 42 43 43 45
indice_figure.qxd
22/05/2007
8.20
Pagina
163
LIST OF FIGURES
Figure 3.6: Economic growth and domestic corruption, 1993-2002, 2003, advanced economies Figure 3.7: Economic growth and domestic corruption, 1993-2002, 2003, emerging economies Figure 3.8: Economic growth and domestic corruption, 1993-2002, 2003, developing economies Figure 3.9: Cost of investment risk and corruption, 2002, 2003 Figure 3.10: Interest rate spreads and corruption, 2002-2003 Figure 3.11: Corruption and FDI, year 2002, advanced countries Figure 3.12: Corruption and FDI, year 2002, emerging economies Figure 3.13: Corruption and FDI, year 2002, developing countries Figure 3.14: Exported corruption, countries where corporations tend to bribe public officials, years 1999, 2002 Figure 3.15: Domestic corruption and exported corruption, year 1999 Figure 3.16: Domestic corruption and exported corruption, year 2002 Figure 3.17: Spending on education, year 2000 Figure 3.18: Corruption and population with a secondary school qualification, year 2003 Figure 3.19: Corruption and inflation, 2000-2004, 2004 Figure 3.20: Public revenues (in percent of GDP) and CPI Figure 3.21: Tax revenues, year 2000, and corruption, year 2002 Figure 3.22: Corruption, year 2002, and public spending on education, year 2000, advanced countries Figure 3.23: Corruption, year 2002, and public spending on education, year 2000, emerging economies Figure 3.24: Corruption, year 2002, and public spending on education, year 2000, developing countries Figure 3.25: Corruption, year 2002, and public investments, year 2000 Figure 3.26: Corruption and public sector size, year 2002, OECD countries Figure 3.27: Corruption and fiscal transparency, year 2004 Figure 3.28: Economic inequality and corruption, years 1984-2002 Figure 3.29: CPI in 1995 and 2004: a comparison
163
46 47 48 51 52 54 55 56 57 58 59 62 65 67 69
70 73 74 74 75 77 79 80 81
© 2007 Vita e Pensiero
Chapter 4 Figure 4.1: Regulatory quality and corruption Figure 4.2: Regulatory quality over time Figure 4.3: Quality and quantity of regulations, year 2002 Figure 4.4: Regulation and corruption Figure 4.5: Banking supervision and perceived corruption, year 2004 Figure 4.6: Transparency in banking supervision and conformity with Basel Core Principles, year 2004
85 86 87 88 90 91
indice_figure.qxd
22/05/2007
8.20
164
Pagina
164
LIST OF FIGURES
Figure 4.7: Corruption and quality of securities markets supervision, year 2004 Figure 4.8: Quality and transparency of supervision in securities markets, year 2004 Figure 4.9: Corruption and insurance markets supervision, year 2004 Figure 4.10: Quality and transparency of insurance markets supervision, year 2004 Figure 4.11: Transparency of monetary policy, year 2004 Figure 4.12: Corruption and accountability Figure 4.13: Accountability over time, 1996-2002 Figure 4.14: Political stability and corruption Figure 4.15: Political stability over time, 1996-2002 Figure 4.16: Corruption and the rule of law Figure 4.17: Rule of law over time, 1996-2002 Figure 4.18: Control of corruption and persistence over time, 1996-2002 Figure 4.19: Government effectiveness and domestic corruption Figure 4.20: Government effectiveness and persistence over time, 1996-2002 Figure 4.21: Cost of organized crime, year 2004 Figure 4.22: Corruption and democratic governance, 2003-2004
93 94 95 96 98 100 101 102 103 104 105 106 107 107 108 110
© 2007 Vita e Pensiero
Chapter 5 Figure 5.1: Corruption and human development Figure 5.2: Corruption and public spending on health, advanced economies Figure 5.3: Corruption and public spending on health, emerging economies Figure 5.4: Corruption and public spending on health, developing countries Figure 5.5: Women in parliament and corruption, year 2004 Figure 5.6: Corruption and gender empowerment, year 2004 Figure 5.7: Corruption and immigration, year 2001 Figure 5.8: Freedom of the media, year 2004 Figure 5.9: Corruption and number of copies of newspapers, year 2004 Figure 5.10: Equity of justice, year 2004 Figure 5.11: Personal security and private property, year 2004
Back to the Summary
113 114 115 115 117 119 122 125 126 127 128
bibliografia.qxd
22/05/2007
8.20
Pagina
165
REFERENCES
ABED, T. GEORGE and SANJEEV GUPTA (eds.) (2002), Governance, Corruption and Economic Performance, IMF, Washington DC. ADCOCK, ROBERT and DAVID COLLIER (2001), “Measurement Validity: A Shared Standard for Qualitative and Quantitative Research”, American Political Science Review, 95(3). ALESINA, ALBERTO and FRANCESCO GIAVAZZI (2006), The Future of Europe: Reform or Decline, The Mit Press. ARNONE, MARCO (2005), Corruzione e Authorities dei Mercati Finanziari, www.LaVoce.info, Dec. 12. ARNONE, MARCO, SALIM DARBAR and ALESSANDRO GAMBINI (2006), “Financial Sector Governance in Banking Supervision: Theory and Practices”, in D. Masciandaro and M. Quintyn (eds.) (2007). ARNONE, MARCO, SALIM DARBAR and ALESSANDRO GAMBINI (2007), “Banking Supervision: Qulity and Governance”, IMF Working Paper, N. 82/07, Washington DC.
© 2007 Vita e Pensiero
ARNONE, MARCO and ALESSANDRO GAMBINI (2006a), “Architecture of Financial Supervisory Authorities and the Basel Core Principles”, Institute for Economic Policy Working Paper, N. 48, Catholic University of Milan, March 2006. ARNONE, MARCO and ALESSANDRO GAMBINI (2006b), “Financial Supervisors Architecture and Banking Supervision”, in D. Masciandaro and M. Quintyn (eds.) (2007). ARNONE, MARCO and ELENI ILIOPULOS (2007), “Istituzioni Internazionali: Giustizia, Equità, Legalità”, in Carlo Casalone e Paolo Foglizzo (eds.) (2007), Volare alla giustizia senza schermi. Un percorso interdisciplinare sulla giustizia, preface by Carlo Maria Martini, Vita e Pensiero, Milano. ARNONE, MARCO and ELENI ILIOPULOS (2006), “Does Corruption Enhance Poverty, Inequality, and Social Exclusion in Latin America?”, presented at the
bibliografia.qxd
166
22/05/2007
8.20
Pagina
166
REFERENCES
IV Annual Meeting of the Euro-Latin American Network on Governance for Development (REDGOB), Inter-American Development Bank, Nuffield College and DFID, 7-8 December, Oxford, UK.
ARNONE, MARCO, BERNARD LAURENS and JEAN-FRANCOIS SEGALOTTO (2006), “The Measurement of Central Bank Autonomy: Survey of Models, Indicators, and Empirical Evidence”, IMF Working Paper, N. 227/06, Washington DC. ARNONE, MARCO, BERNARD LAURENS, JEAN-FRANCOIS SEGALOTTO and MARTIN SOMMER (2007), “Measures of Central Bank Autonomy: Lessons from Global Trends”, IMF Working Paper, N. 88/07, Washington DC. ARNONE, MARCO and GRAZIA MANNOZZI (2006), Corporate Crimes: Efficacia degli Strumenti di Contrasto Internazionali e di Diritto Interno, www.LaVoce.info, May 29. ARNONE, MARCO and PIER CARLO PADOAN (2007), “Anti-Money Laundering by International Institutions: A Preliminary Assessment”, presented at the Conference Corralling the Economy of Crime and Money Laundering: A Challenge for Banks and International Institutions into the 21st Century, organized by the European Center for the Study of Public Choice (ECSPC) and the Research Center for International Economics (CIDEI), Rome, University “La Sapienza”, Sept. 28-30, 2006. CIDEI Working Paper N. 74, February 2007. BARDHAN, PRANAB (1997), “Corruption and Development: A Reviev of Issues”, Journal of Economic Literature, Vol. 35, N. 3. BECCARIA, CESARE (1764), Of Crimes and Punishments, translated by Edward D. Ingraham. Second American edition. Philadelphia (No. 175, Chesnut St.): Published by Philip H. Nicklin: A. Walker, printer, 24, Arch St., 1819. http://www.constitution.org/cb/crim_pun.htm
© 2007 Vita e Pensiero
BECKER, GARY (1983), “A Theory of Competition among Pressure Groups for Political Influence”, Quarterly Journal of Economics, Vol. 98, p. 371-400. BECUCCI, STEFANO (2006), Criminalità Multietnica: I Mercati Illegali in Italia, Editori Laterza, Roma-Bari. BERNASCONI, PAOLO (ed.) (2000), Responding to Corruption, La Città del Sole, Napoli. BOSI, STEFANO, ELENI ILIOPULOS and FRANCESCO MAGRIS (2006), “Immigrants’ Skills and Selective Policies”, paper presented at the Second Economic Policy and Open Economy Macro Workshop, 19-20 May 2006, University A. Avogadro, Novara (Italy). Forthcoming in Rivista
bibliografia.qxd
22/05/2007
REFERENCES
8.20
Pagina
167
167
Internazionale di Scienze Sociali, 2007. http://www.unicatt.it/convegno/ open_economy/programme_2006.htm CAMERA DEI DEPUTATI, COMITATO DI STUDIO SULLA PREVENZIONE DELLA CORRUZIONE (1998), La Lotta alla Corruzione, Editori Laterza, Roma-Bari. CAMPIGLIO, LUIGI (2005), Prima le donne e i bambini – Chi rappresenta i minorenni?, Il Mulino, Bologna. COOTER, ROBERT and THOMAS ULEN (1997), Law and Economics, second edition, Addison-Wesley. DABLA-NORRIS, ERA and ELISABETH PAUL (2006), “What Transparency Can Do When Incentives Fail: An Analysis of Rent Capture”, IMF Working Paper, N. 06/146, Washington DC. DABLA-NORRIS, ERA and PAUL WADE (2002), “Production, Rent Seeking and Wealth Distribution”, in George T. Abed and Sanjeev Gupta (eds.) (2002). DELLA PORTA, DONATELLA (1992), Lo Scambio Occulto, Il Mulino, Bologna. DELLA PORTA, DONATELLA and ALBERTO VANNUCCI (1994), Corruzione Politica e Amministrazione Pubblica, Il Mulino, Bologna. EASTERLY, WILLIAM (2002), The Elusive Quest for Growth, The MIT Press, Cambridge Massachusetts. FACCIO, MARA (2006), “Politically connected firms”, American Economic Review, V, 96 (1) March 2006, pp. 367-386. FACCIO, MARA (2002), “Politically-connected firms: can they squeeze the state?”, Mimeo, University of Notre Dame, Mendoza College of Business, USA. FISMAN, RAYMOND (2001), “Estimating the Value of Political Connection”, American Economic Review, Vol. 91, p. 1095-1102.
© 2007 Vita e Pensiero
FORTI, GABRIO (2005), “Il ‘fiume inondatore’ della politica. Sull’indipendenza delle istituzioni”, La Rivista del Clero Italiano, LXXXVI, 3, p. 202-215. FORTI, GABRIO (ed.) (2003a), Il prezzo della tangente - La corruzione a dieci anni da “mani pulite”, Vita e Pensiero, Milano. FORTI, GABRIO (2003b), “La corruzione tra privati nell’orbita della disciplina della corruzione pubblica: un contributo alla tematizzazione”, Rivista Italiana di Diritto e Procedura Penale, XLVI, Fasc. 4. FORTI, GABRIO (2002), “Basic features of the legislation for combating
bibliografia.qxd
168
22/05/2007
8.20
Pagina
168
REFERENCES
corruption and bribery in Member States of the European Union, in B. Huber (ed.) (2002). FORTI, GABRIO and MARTA BERTOLINO (eds.), (2005), La Televisione del Crimine, Vita e Pensiero, Milano. Atti del Convegno “La Rappresentazione Televisiva del Crimine”, 15-16 maggio 2003, Università Cattolica del Sacro Cuore di Milano - Università degli Studi di Milano-Bicocca. FREEDOM HOUSE (2004), Annual Survey of Press Freedom, www.freedomhouse.org GLAESER, L. EDWARD and RAVEN SACHS (2004), “Corruption in America”, Harvard Institute of Economic Research Discussion Paper, N. 2043. GUPTA, SANJEEV, HAMID R. DAVOODI and ERWIN R. TJONGSON (2002), “Corruption and the Provision of Health Care and Education Services”, in George T. Abed and Sanjeev Gupta (eds.) (2002). GUPTA, SANJEEV, LUIZ DE MELLO and RAJU SHARAN (2002), “Corruption and Military Spending”, in George T. Abed and Sanjeev Gupta (eds.) (2002). HAMEED, FARHAN (2005), “Fiscal Transparency and Economic Outcomes”, IMF Working Paper, N. 05/225, Washington DC. HEINE, GÜNTER, BARBARA HUBER e THOMAS O. ROSE (eds.) (2003), Private Commercial Bribery, The World Business Organization edition iuscrim, Freiburg im Breisgau. HUANG, HAIZHOU and SHANG-JIN WEI, 2003, “Monetary Policy for Developing Countries: the Role of Corruption”, IMF Working Paper, N. 183/03, Washington DC. HUBER, BARBARA (ed.), (2002), Combating Corruption in the European Union, Series of Publications by the Academy of European Law in Trier, Vol. 31, Bundesanzeiger Verlagsges, Koeln.
© 2007 Vita e Pensiero
KATZ, AVERY WIENER (ed.) (1998), Fundations of the Economic Approach to Law, Oxford University Press. KAUFMANN, DANIEL (2004), “Corruption, Governance and Security: Challenges for the Rich Countries and the World”, in Global Competitiveness Report 2004/2005, The World Bank Institute, Washington DC, p. 83-102. KAUFMANN, DANIEL, AART KRAAY and MASSIMO MASTRUZZI (2005), Governance Matters IV: Governance Indicators for 1996-2004, The World Bank, Washington DC.
bibliografia.qxd
22/05/2007
8.20
Pagina
169
REFERENCES
169
KAUFMANN, DANIEL, AART KRAAY and MASSIMO MASTRUZZI (2004), Governance Matters III: Governance Indicators for 1996-2002, The World Bank, Washington DC. KNIGHT, MALCOLM, NORMAN LOAYZA and DELANO VILLANUEVA (1996), “The Peace Dividend: Military Spending Cuts and Economic Growth”, IMF Staff Papers, Vol. 43 (March), p. 1-37. INTERNATIONAL ASSOCIATION OF INSURANCE SUPERVISORS (IAIS), (2003), Insurance Core Principles and Methodology, revised by the Task Force on the Revisions of the Insurance Core Principles, Basel (CH). INTERNATIONAL ASSOCIATION OF INSURANCE SUPERVISORS (IAIS), (1999), Principles Applicable to the Supervision of International insurers and Insurance Groups and their Cross-Border Business Operations (Insurance Concordat), Basel (CH). INTERNATIONAL INSTITUTE FOR MANAGEMENT DEVELOPMENT - IMD (2004), World Competitiveness Yearbook, IMD World Competitiveness Center, Lousanne (CH). INTERNATIONAL MONETARY FUND (2001), Code of Good Practices in Fiscal Transparency, updated version, Washington DC. INTERNATIONAL MONETARY FUND (1999), Code of Good Practices on Transparency in Monetary and Financial Policies: Declaration of Principles, Washington DC. INTERNATIONAL MONETARY FUND (1998), Code of Good Practices in Fiscal Transparency, Washington DC. INTERNATIONAL MONETARY FUND, Online databases, www.imf.org INTERNATIONAL MONETARY FUND, Reports on the Observance of Standards and Codes, various areas and countries, Washington DC.
© 2007 Vita e Pensiero
INTERNATIONAL MONETARY FUND AND WORLD BANK, Financial Sectors Assessment Program, various years and countries, Washington DC. INTERNATIONAL ORGANIZATION OF SECURITIES COMMISSIONS (IOSCO), (2003), Objectives and Principles of Securities Regulation, Madrid. www.iosco.org LAFFONT, JEAN-JACQUES (2000), Incentives and political economy, Clarendon Lectures in Economics, Oxford University Press. LAFFONT, JEAN-JACQUES and JEAN TIROLE (1993), A Theory of Incentives in Procurement and Regulation, The Mit Press, Cambridge, Massachusetts.
bibliografia.qxd
170
22/05/2007
8.20
Pagina
170
REFERENCES
LAMBSDORFF, JOHANN GRAF and MICHAEL SCHINKE (2002), “NonBenevolent Central Banks”, Goettingen University, CeGe Discussion Paper, N. 16. LEITE, CARLOS and JENS WEIDMANN (2002), “Does Mother Nature Corrupt? Natural Resources, Corruption and Economic Growth”, in George T. Abed and Sanjeev Gupta (eds.) (2002). LIEDTKE, MICHAEL (2006), Venture Capitalists Betting on Immigrants, AP, 15 November. MARIANI, FABIO (2005), “Migration as an antidote to rent-seeking”, mimeo, UCL and European University Institute, Fiesole. MASCIANDARO, DONATO and MARC QUINTYN (eds.) (2007), Designing Institutions for Financial Stability: Independence, Accountability and Governance, Edward Elgar Publisher, London. MAURO, PAOLO (2002), “The Persistence of Corruption and Slow Economic Growth”, IMF Working Paper, N. 213/02, Washington DC. MAURO, PAOLO (1998), “Corruption and the Composition of Government Expenditure”, Journal of Public Economics,Vol. 69, p. 263-279. MAURO, PAOLO (1995), “Corruption and Growth”, Quarterly Journal of Economics, Vol. 110 (Aug.), p. 681-712. MORGAN, JOHN and FELIX J.J. VARDY (2006), Corruption, Competition, and Contracts: A Model of Vote Buying , IMF Working Paper, N. 11/06, Washington DC. MUNK, GERARDO L. (2003) “Measures of Democracy, Governance and Rule of law: An Overview of Cross-National Data Sets”, paper prepared for the World Bank workshop Understanding Growth and Freedom from the Bottom Up, Washington, DC, July 15-17, 2003.
© 2007 Vita e Pensiero
MUNK, GERARDO L. and JAY VERKUILEN (2002), “Conceptualizing and Measuring Democracy: Evaluating Alternative Indices”, Comparative Political Studies, vol. 35 (1), p. 5-34. MURPHY, M.KEVIN, ANDREI SCHLEIFER and ROBERT VISHNY (1991), “The Allocation of Talent: Implications for Growth”, Quarterly Journal of Economics, CVI, p. 503-530. PELLEGRINI, LORENZO and REYER GERLAGH (2004), “Corruption’s Effect on Growth and its Transmission Channels”, Kuklos, Vol. 57/3, p. 429-456. REUTER, PETER and EDWIN M. TRUMAN (2004), Chasing Dirty Money. The Fight against Money Laundering, Institute for International Economics, Washington DC.
bibliografia.qxd
22/05/2007
8.20
Pagina
171
REFERENCES
171
ROSE-ACKERMAN, SUSAN (1997), “The Political Economy of Corruption” in Kimberly Ann Elliot (ed.), Corruption and the Global Economy, p. 31-60, The Institute for International Economics, Washington DC. ROSOFF, STEVE (2005), “I Mass Media e il Crimine dei Colletti Bianchi”, in Forti, Gabrio and Marta Bertolino (eds.) (2005). SCHLEIFER, ANDREI and ROBERT VISHNY (1993), “Corruption”, Quarterly Journal of Economics, CIX, p. 599-617. SOLIVETTI, LUIGI MARIA (2004), Immigrazione, Integrazione e Crimine in Europa, Il Mulino, Bologna. TANZI, VITO (2006), “Corruption and Economic Activity”, Distinguished Lecture Series 26, The Egyptian Center for Economic Studies, Cairo, Dec. 2006. TANZI, VITO (2002), “Corruption Around the World: Causes, Consequences, Scope and Cures”, in George T. Abed and Sanjeev Gupta (eds.) (2002). TANZI, VITO (1994), “Corruption, Governmental Activities, and Markets”, IMF Working Paper, N. 99/94, Washington DC. TANZI, VITO and DAVOODI R. HAMID (2002a), “Corruption, Growth and Public Finances”, in George T. Abed and Sanjeev Gupta (eds.) (2002). TANZI, VITO and DAVOODI R. HAMID (2002b), “Corruption, Public Investment and Growth”, in George T. Abed and Sanjeev Gupta (eds.) (2002). THE ECONOMIST (2004), World in Figures, 2004 Edition. TRANSPARENCY INTERNATIONAL, Bribe Payers Index, various years, www.transparency.org
© 2007 Vita e Pensiero
TRANSPARENCY INTERNATIONAL, Corruption Perception Index, various years, www.transparency.org TRANSPARENCY INTERNATIONAL, Global Corruption Barometer, various years, www.transparency.org UNITED NATIONS ORGANIZATION (2004), Human Development Report, New York. VAN RIJCKEGHEM, CAROLINE and BEATRICE WEDER (2002), “Bureaucratic Corruption and the Rate of Temptation: Do Wages in the Civil Service Affect Corruption and by How Much?”, in George T. Abed and Sanjeev Gupta (eds.) (2002).
bibliografia.qxd
22/05/2007
8.20
Pagina
172
172
REFERENCES
WEI, SHAN JIN (1997), “Why is Corruption so Much More Taxing than Tax?”, NBER Working Paper, N. 2048. WORLD BANK, Governance and Anti-Corruption, www.worldbank.org/ wbi/governance
© 2007 Vita e Pensiero
WORLD BANK, Online databases, www.worldbank.org
Back to the Summary
© 2007 Vita e Pensiero - Largo Gemelli, 1 - 20123 Milan ISBN 978-88-343-1470-8
autori.qxd
22/05/2007
8.20
Pagina
173
AUTHORS
© 2007 Vita e Pensiero
Marco Arnone holds a Master of Science in Economics from the University of Warwick (UK) and a Ph.D. in Economics from the University of Pavia (Italy), and was visiting scholar at Stanford University (USA) in 1996, with an American Study and Student Exchange Committee scholarship, and 1999. He has worked as an economist in the Monetary and Financial Systems department and the African department at the International Monetary Fund, in countries such as Peru, Croatia, Sri Lanka, Lebanon, Kenya, Zambia, Angola, Mozambique, Lesotho. Dr. Arnone has tought at the Catholic University of Milan, the University of Milan, and the University of Eastern Piedmont. He has published nationally and internationally on issues ranging from the economics of corruption to development finance, banking and central banking issues. His recent books and articles (with co-authors) include: Primary Dealers in Government Securities (2005), Il Venture Capital per lo sviluppo (Vita e Pensiero, Milan 2006), Measures of Central Bank Autonomy: Empirical Evidence for OECD and Developing Countries, and Emerging Market Economies (2006), Central Bank Autonomy: Lessons from Global Trends (2007), Banking Supervision Quality and Governance (2007), External Debt Sustainability and Domestic Debt in Heavily Indebted Poor Countries (2007), Financial Supervisors Architecture and Banking Supervision (in Masciandaro and Quintyn, Designing Institutions for Financial Stability: Independence, Accountability and Governance, 2007). Eleni Iliopulos is currently enrolled in a joint Ph.D. programme in Economics at the University of Pavia (Italy) and Evry (France). She studied at the University of Trento and San Pablo CEU (Madrid) and was a research fellow at the American University (Washington DC). She is a Master of Science in Economics at the University of Warwick (UK), where she worked with Marcus Miller on topics related to international monetary economics.
autori.qxd
28/05/2007
11.53
Pagina
174
174
AUTHORS
Her recent publications include: La corruzione costa (with M. Arnone, Vita e Pensiero, Milan 2005), and “UK external imbalances and the sterling: are they on a sustainable path?” (with M. Miller, forthcoming on Open Economies Review).
© 2007 Vita e Pensiero
Vito Tanzi has been professor of Economics and Chairman of the Economics department at the American University in Washington, D.C. (1967-1974); Chief of the Tax Policy Division (1974-1981) and Director of the Fiscal Affairs Department (19812000) at the International Monetary Fund; Senior Associate at Carnegie Endowment for International Peace (2000-2001); Undersecretary in the Ministry of Economy and Finance of Italy (2001-2003). He is now a consultant to the InterAmerican Development Bank. Over the years he has advised the Organization of American States, the World Bank, the United Nations, the European Commission, the European Central Bank, the Stanford Research Institute and other institutions. His main areas of interest have been public finance, macroeconomics, and economic development. In 1990-1994 he was President of the International Institute of Public Finance. He has received honorary degrees from the University of Cordoba (Argentina); the University of Liege (Belgium); the University of Torino (Italy); the University of Bari (Italy); and the University of Lisbon (Portugal). He is the author of various books and hundreds of articles published in professional economic journals and in volumes. Gabrio Forti is a professor of Criminal Law and Criminology at the Catholic University of Milan. Editor of White Collar Crime: The Uncut Version by E.H. Sutherland (Milan 1987), he has published books on criminal negligence and corruption, as well as several essays on organized and economic crime, and is the author of a criminology textbook (L’immane concretezza, Milan 2000). He has recently lead a vast research on television and crime, editing the book which encompasses, together with the main research results, the proceedings of an international conference thereupon (La televisione del crimine, Vita e Pensiero, Milan 2005) and contributed to the International Handbook of White Collar Crime (eds. G. Geis and H. Pontell, Berlin-New York 2007). Back to the Summary