Click Here
JOURNAL OF GEOPHYSICAL RESEARCH, VOL. 112, G04S53, doi:10.1029/2006JG000352, 2007
for
Full Article
Temporal and spatial variations in maximum river discharge from a new Russian data set A. I. Shiklomanov,1 R. B. Lammers,1 M. A. Rawlins,1 L. C. Smith,2 and T. M. Pavelsky2 Received 25 October 2006; revised 2 March 2007; accepted 29 May 2007; published 1 December 2007.
[1] Floods cause more damage in Russia than any other natural disaster, and future
climate model projections suggest that the frequency and magnitude of extreme hydrological events will increase in Russia with climate change. Here we analyze daily discharge records from a new data set of 139 Russian gauges in the Eurasian Arctic drainage basin with watershed areas from 16.1 to 50,000 km2 for signs of change in maximum river discharge. Several hypotheses about changes in maximum daily discharge and their linking with trends in precipitation over the cold season were tested. For the magnitude of maximum daily discharge we found relatively equal numbers of significant positive and negative trends across the Russian Arctic drainage basin, which draws into question the hypothesis of an increasing risk of extreme floods. We observed a significant shift to earlier spring discharge, which is consistent with documented changes in snowmelt and freeze-thaw dates. Spatial analysis of changes in maximum discharge and cold season precipitation revealed consistency across most of the domain, the exception being the Lena basin. Trends in maximum discharge of the small- to medium-sized rivers were generally consistent with aggregated signals found for the downstream gauges of the six largest Russian rivers. Although we observe regional changes in maximum discharge across the Russian Arctic drainage basin, no evidence of widespread trends in extreme discharge can be assumed from our analysis. Citation: Shiklomanov, A. I., R. B. Lammers, M. A. Rawlins, L. C. Smith, and T. M. Pavelsky (2007), Temporal and spatial variations in maximum river discharge from a new Russian data set, J. Geophys. Res., 112, G04S53, doi:10.1029/2006JG000352.
1. Introduction [2] There is a growing body of evidence pointing to significant environmental change in the north polar region, and in particular across Russia [Arctic Climate Impact Assessment, 2005; Intergovernmental Panel on Climate Change, 2001]. These changes are important not only as potential signals of global climate change, but also through their feedbacks to the global climate and hydrological systems and to their impacts upon humans. Previous investigations of the discharge increase across northern Eurasia [Peterson et al., 2002; Yang et al., 2002; Berezovskaya et al., 2004] used aggregations for annual, seasonal or monthly discharge for the largest six Eurasian basins. Identifying the sources of the downstream discharge trends is challenging, as large basins integrate discharge-forming processes with large spatial variations across the watershed and process the discharge signal through the river system. Human influences also have an imprint on the hydrological cycle [Yang et al., 2002, 2004a, 2004b]. A better understanding of hydro-
logical changes associated with climate variability can be achieved by examining smaller river basins with minimal anthropogenic effects to the hydrological regime. To this end, we have assembled historical daily discharge data for small and medium size watersheds in the Russian Arctic to investigate the climate-discharge linkages. By evaluating watersheds distributed across a large territory, we obtain a more complete picture of continental-scale hydrological changes and the potential to resolve local climate change signals. Moreover, the documented changes in annual and seasonal river discharge cannot adequately characterize the complex regional and seasonal patterns in terrestrial runoff production Investigations of the physical processes underlying large-scale, decadal trends in monthly and annual discharge may be best accomplished using daily records. Using a new data set of daily discharge for mostly nonimpacted watersheds we analyze the temporal and spatial variability of maximum discharge characteristics across the Russian Arctic domain.
2. Purpose and Scope 1
Water Systems Analysis Group, Institute for the Study of Earth, Oceans and Spaces, University of New Hampshire, Durham, New Hampshire, USA. 2 Department of Geography, University of California, Los Angeles, California, USA. Copyright 2007 by the American Geophysical Union. 0148-0227/07/2006JG000352$09.00
[3] In this study we focus on analyzing long-term variability in daily discharge for small and medium size Russian rivers (<50,000 km2) with minimal human impact during the period of record. A closely related paper [Smith et al., 2007] examines minimum daily discharge from the same set of Russian gauges to infer long-term base flow changes.
G04S53
1 of 14
G04S53
SHIKLOMANOV ET AL.: VARIATIONS IN MAXIMUM DISCHARGE
Maximum river discharge is usually associated with floods which cause more damage in Russia than any other natural disaster. We recognize, however, that maximum water level which results in out-of-bank flow does not always conjoin with maximum discharge, owing to the backwater effects and ice damming in rivers. The direct damage of floods in Russia based on data from the Russian Emergency Ministry (http://www.mchs.gov.ru) exceeds $3.5 billion per year. Extensive floods in Russia over the last decade, especially the Siberian floods in 1998 and 2001, caused speculation that the frequency of catastrophic floods across Russia has noticeably increased. Taking into account a wide censorship of Russian mass media before the end of 1980s the speculation may be due, in part, to increasing media coverage of extreme flood events during last couple decades. Although the similar tendency was observed in countries with open mass media [Unger, 1999]. Most future climate change projections suggest that the flood risk will rise significantly in Northern Eurasia [Intergovernmental Panel on Climate Change, 2001; Milly et al., 2002]. Using daily discharge data for the 139 unregulated basins we test three hypotheses related to changes in the maximum daily discharge time series. 2.1. Time Shift [4] The Russian Arctic and especially Central Siberia have experienced an unprecedented increase in air temperature during recent decades [Arctic Climate Impact Assessment, 2005; Intergovernmental Panel on Climate Change, 2001; Hansen et al., 2006]. These changes in air temperature, along with changes in the timing of snowmelt, freeze/thaw [McDonald et al., 2004], and reduction of snow cover [Yang et al., 2003] could influence the date of maximum daily spring discharge. We hypothesize there was a shift to earlier peak spring discharge. 2.2. Cold Season Precipitation Change [5] The spring flood across the Russian Arctic drainage basin is primarily snowmelt dominated and there is evidence that cold period precipitation in this region has increased. Rawlins et al. [2006] found a significant correlation between annual precipitation and annual discharge aggregated across the six largest Eurasian basins over the 1936 – 1999 period. They also found an increase in the discharge/precipitation ratio across the basin while snowfall increases were noted across north-central Eurasia. Pavelsky and Smith [2006] also documented a substantial agreement between discharge and precipitation trends for 66 basins across Russian Arctic drainage. Although cold season precipitation has very large uncertainties associated with measurement techniques [Goodison et al., 1998], we hypothesize there was a consistent signal between changes in cold season precipitation and maximum daily spring discharge. 2.3. Increase in Heavy Rainfall [6] Several recent studies demonstrate significant changes in the river runoff regime across Northern Eurasia [Peterson et al., 2002; Yang et al., 2004a, 2004b; Berezovskaya et al., 2005; Lammers et al., 2001]. Changes in the temporal distribution of runoff through the year are not well documented, although increases in winter runoff across the
G04S53
Russian Arctic have been found [Lammers et al., 2001; Georgievsky et al., 2002; Shiklomanov et al., 2005]. Evidence of increasing extreme precipitation and thunderstorm activity across Northern Eurasia [Sun and Groisman, 2000; Groisman et al., 2005] has also been documented. High-rate rainfall usually has local or regional spatial scales and can affect the intensities of local floods during the warm season on small and medium size watersheds. We hypothesize maximum daily discharge generated by rainfall has increased across the Russian Arctic and that this process has contributed to increases in annual discharge to the Arctic Ocean. This paper tests these hypothesis by using the analysis of temporal and spatial variability applied to maximum daily discharge records from the newly compiled Russian daily river discharge data set.
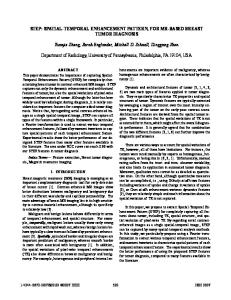
3. Discharge Data [7] The daily river discharge data were compiled for 139 gauges across the Russian Arctic drainage basin (Figure 1a). The yearly regional hydrological yearbooks from libraries of the State Hydrological Institute (SHI) and the Arctic and Antarctic Research Institute (AARI), both in Saint Petersburg, Russia, were the primary sources for the daily discharge records [State Hydrological Institute, 1980]. The compiled data were independently quality controlled using both analysis of deviations between neighboring daily values and visually by plotting daily hydrographs. In some cases, errors were found in the original discharge yearbooks. Daily water stage data were used to identify misprints in the discharge flux data. If the water stage fluctuations during the open water period did not reflect the changes in the doubtful discharge values then this value was either removed or changed on the basis of the stagedischarge relationship, where available. [8] Our goal was a spatially representative distribution of stations across the Russian Arctic representing a wide variety of climatic zones and land cover types. However, we were limited by the high population bias in areas of the European Russia and Southern Siberia [Lammers et al., 2001; Shiklomanov et al., 2002]. These two regions have both a denser monitoring network and a greater number of long-term discharge records. There were 49 watersheds in the data set with some level of permafrost, including 21 in the continuous permafrost zone [Smith et al., 2007; International Permafrost Association, 1998]. The stations have a wide range of drainage area from 16.1 km2 to 49,500 km2 and were evenly distributed above 100 km2 (Figure 1b). There were only two gauges with an a drainage area less than 100 km2. Sixteen of the 21 small watersheds (less than 1000 km2) were located in the European part of Russia and only 5 were located in Siberia. Most of the larger watersheds (23 of 25) with drainage area larger 20,000 km2 were in Siberia. This spatial inconsistency results from a lower number of long-term discharge observations on small rivers across northern Siberia.
4. Methodology 4.1. Data Collection [9] The selection of gauges for the Russian Arctic daily discharge data set was based on several criteria. A complete
2 of 14
G04S53
SHIKLOMANOV ET AL.: VARIATIONS IN MAXIMUM DISCHARGE
G04S53
Figure 1. (a) Location of stations in new daily discharge data set and outlines of six largest river basins in Russian Arctic. The size of circles represents the number of years of data. (b) Number of gauges by drainage basin area. (c) Number of gauges with different length of discharge records. annual cycle where both active and discontinued stations operating prior to 1988 were considered provided they covered an entire water year (defined as 1 October through 30 September). The total length of record was at least 40 years, and for northern Siberia this criteria was reduced to 35 years. Record accuracy in which there were unimpaired basin conditions affecting the monthly discharge implied there must be no overt adjustment of streamflow through diversions, no regulation by control structures, and no change in land use that could have significantly affected the monthly value of streamflow. Finally, a maximum drainage area of 50,000 km2 was used to limit the number of drainage basins spanning multiple hydro-climatic zones. [10] These criteria were consistent with those established for the WMO Reference Climatological Stations (RCS) network [World Meteorological Organization, 1993] and the Reference Hydrometric Basin Network (RHBN) for Canada [Pilon and Kuylenstierna, 2000]. [11] To identify the stations meeting these conditions a number of sources and tools were used. An updated version of R-ArcticNet V4.0 (http://www.r-arcticnet.sr.unh.edu/
v4.0/) [Lammers et al., 2001; Shiklomanov et al., 2002] containing monthly discharge data was used to define the period of observations, data gaps, and gauge locations. Visual analysis of the monthly hydrographs to reveal obvious unnatural disturbances in river discharge was applied. The regular annual estimates of water resources and water use in Russia prepared in SHI and Russian topographic maps with scales 1:500,000 were used to identify the presence of reservoirs or diversions in the river basins. For regions where there were many monitoring gauges, mostly in Europe and southern Siberia, we analyzed a UNH developed pan-Arctic digital river network along with several gridded data sets (e.g., elevation, vegetation, land use, soil, permafrost, climate) to identify the most appropriate and representative river basins. Owing to the paucity of long-term stations in northern Siberia, criteria for the length of record was relaxed to 35 years for some gauge records. A significant problem in compiling the new data set was the difficulty in accessing and collecting complete time series records from the original archives. This was due to an absence of published and accessible information for many
3 of 14
G04S53
SHIKLOMANOV ET AL.: VARIATIONS IN MAXIMUM DISCHARGE
regions during 1990s and, moreover, it was found that some gauges had periods when monthly records were reported (flagged as reduced accuracy data), whereas daily discharge values were absent. The majority of gauges (90%) had more than 30 years of daily data available and 54% had more than 50 years of record (Figure 1c). Gauges with less than 29 years of data were not used for further study. 4.2. Characteristics of Daily Maximum [12] Two characteristics, daily maximum discharge for each calendar month and maximum discharge of the spring flood were used to analyze trends in maximum daily discharge. Annual daily maximum discharge for 97 stations of the data set was observed exclusively during the spring months from April to June as it was primarily generated from snowmelt. However, there were 42 stations where maximum daily discharge occurred in both the spring and summer-fall (July – October) periods suggesting some of the peak discharge was a result of rainfall rather than snowmelt. To define consistent records of spring maximum discharge from snowmelt we analyzed the hydrograph and, if necessary, used additional daily air temperature and precipitation data [National Climatic Data Center, 2005a, 2005b] to distinguish between snowmelt and rainfall generated peaks. [13] All rivers except Norilka at Valek have clearly pronounced spring peaks in April June. The Norilka River is a naturally regulated basin due to several lakes with a significant proportion of summer discharge from snowmelt originating in the mountainous uplands. Its hydrograph has a very gradual increase from the end of May through the middle of July with a peak in July or August. There was no obvious maximum daily discharge peak during the spring period and, therefore, the annual maximum, falling in July and August, was used in our analysis. 4.3. Temporal Trend Analysis [14] We analyzed trends in the annual and monthly time series using both the commonly employed least squares linear regression and the more robust, nonparametric MannKendall test [Helsel and Hirsch, 1992; Lins and Slack, 1999] which is widely used in hydrological studies [e.g., Lammers et al., 2001; Smith, 2000; McClelland et al., 2006]. The trend analysis was applied to maximum discharge values and to the dates of spring discharge peak for four different periods: 1960 – 2001; 1950 – 2001; 1940 – 2001; and 1930 – 2001. To increase the number of gauges in each group, we allowed up to 9 missing years within any given period in each subset. The changes over each period were computed from the slope of linear regression taking into account the actual length of records. Changes over time were estimated relative to mean maximum daily discharge over the period. We use relative units, since discharge differs significantly from one gauge to another, and the absolute changes in discharge are difficult to compare. Daily runoff values, and especially their changes, often have very low magnitudes and are less demonstrative for intercomparison. 4.4. Spatial Trend Analysis [15] Mapping of changes in discharge characteristics and trend direction and significance was carried out to provide a qualitative analysis of the spatial variability of change
G04S53
across the Russian Arctic drainage basin. Changes in spring maximum daily discharge and station precipitation over the cold season were mapped to facilitate visual analysis of the consistency between the trends in these elements. The time series of mean magnitude and date of spring maximum discharge generated for the entire domain and for two sets of four regions; European Arctic, South of Central Siberia, Lena River Basin, and Far East for the magnitude of spring maximum discharge and European Arctic, West Siberia, Central Siberia, and East Siberia and Far East for the timing of spring maximum discharge. These spatial groupings were analyzed for changing trends using the same procedure as for individual discharge records. The averaging of normalized changes in magnitude and date of maximum discharge for all gauges falling into individual subregions were applied to generate the time series for the subregions and the entire Arctic drainage. [16] We also analyzed mean changes aggregated from all small watersheds lying in each of the six largest Eurasian basins (Kolyma at Severokolymsk, Lena at Kusur, Yenisey at Igarka, Ob at Salekhard, Pechora at Ust’ Tsilma, and Severnaya Dvina at Ust’ Pinega) and the long-term variations for these unique downstream gauges to understand how changes in the small natural watersheds may or may not have contributed to changes in the larger drainage basins, and to evaluate the possible contribution of changes in spring peak discharge to the documented increase of annual discharge to the Arctic Ocean from the 6 large Eurasian river basins [Peterson et al., 2002].
5. Results [17] Of the 139 stations in the daily discharge data set, not all met our requirements for data completeness. After filtering the data for gaps and length of records, subsets of n = 104, 89, 60, and 32 stations remained for our analysis over the periods 1960 – 2001, 1950 – 2001, 1940– 2001 and 1930– 2001, respectively. The same subsets of gauges were used for analysis of changes in maximum monthly discharge (MMD) for the warm period from May to October. There were several stations with discharge close to or equal to zero from November through April and a smaller subset of n = 93, 79, 55 and 30 stations were used to analyze the changes in MMD during these months. 5.1. Spring Maximum Discharge [18] Relative changes in spring maximum discharge for different periods are shown in Figure 2 (left). There are approximately the same numbers of gauges with both positive and negative changes for all time periods. The number of gauges with significant positive and negative trends are similar for 1960 – 2001 and 1930 –2001 and there are slightly more gauges with significant negative trends for 1950– 2001 and 1940 – 2001. Overall, we find no widespread significant changes in trends of spring maximum discharge across the Russian Arctic drainage basin (Figure 2 and Table 1). [19] Aggregated changes in spring maximum discharge were analyzed for four regions: Far East, Lena river basin, South of Central Siberia and European Arctic drainage basin where spatial coherence was observed over the given periods (Figure 3 and Table 1). Significant decreases in
4 of 14
SHIKLOMANOV ET AL.: VARIATIONS IN MAXIMUM DISCHARGE
G04S53
G04S53
Figure 2. (left) Relative changes in spring daily maximum discharge (%) and (right) changes in dates of maximum discharge (days) from linear regressions for different temporal periods. Changes are ranked from most negative to most positive. Black bars represent significant trends (p < 0.05). Significance of trends based on Mann-Kendall tests are shown. spring maximum discharge are noted across the South of Central Siberia covering southern parts of the Yenisey and Ob basins. Out of 28 analyzed times series in the region, 8 showed significant negative trend over 1950 – 2001 and none were positive. Mean regional spring maximum dis-
charge show a consistent significant negative trend over all given periods (Table 1). These trends in discharge are in agreement with the changes in precipitation over the cold period, although significant precipitation trends were observed only during 1930–2001 and 1940–2001 (Figure 3
Table 1. Relative Changes in Magnitudes of Spring Maximum Daily Discharge and Precipitation Over Cold Season Spatially Aggregated for Four Regions and Entire Russian Arctic Drainage Basina 1960 – 2001 Region 1. European Arctic 2. South of central Siberia 3. Lena river basin 4. Far East Arctic drainage
Precipitation 1 5 4 22 3
1950 – 2001
Discharge 1 24 21 9 1
Precipitation
1940 – 2001
Discharge
0
5 7 6 16 4
26 17 23 3
a
Precipitation 0
1930 – 2001
Discharge 5
10 2 6 3
18 20 21 4
Precipitation 1 12 5 30 1
Discharge 14 24 15 27 4
Boldface denotes the significant trends from Mann-Kendall test with 95% significance level, (p < 0.05) and italics denote the significant trends with 90% significance level (p < 0.10).
5 of 14
G04S53
SHIKLOMANOV ET AL.: VARIATIONS IN MAXIMUM DISCHARGE
Figure 3. (left) Relative changes in spring daily maximum discharge (%) and (right) changes in precipitation over cold period (November to April, in millimeters). Grey circles and squares represent positive trends, white represent negative trends, and green marks gauges with no change (less than ±5%). Crosses highlight stations with significant trends (p < 0.05). Ovals encircle regions where analysis of aggregated changes has been made. Colors of ovals reflect positive (grey) or negative (white) changes over the given periods. The names of regions discussed in the text are given in Table 1 with numbers shown in top left plot. 6 of 14
G04S53
G04S53
SHIKLOMANOV ET AL.: VARIATIONS IN MAXIMUM DISCHARGE
and Table 1). There were no significant (p < 0.05) trends in maximum daily spring discharge across other regions (Table 1). The cold-season precipitation in the Far East region has significant decreasing trends over the 1930 – 2001, 1950 –2001 and 1960 – 2001 periods. These coincide with tendencies of changes in spring peak discharge across the region although only one significant trend with 90% significance level (p < 0.1) was found over 1930 – 2001 (Table 1). The Lena River basin showed significant increases in maximum discharge over 1940 – 2001 (p < 0.05) and over 1930– 2001, 1960 –2001 (p < 0.1). There was no uniformity between changes in precipitation over the cold period and maximum discharge in this region and opposite directions of change (insignificant for cold season precipitation) were noticed over 1950– 2001 and 1960 – 2001. This discrepancy leads us to suspect that other factors are responsible for discharge changes across the Lena basin. The more intense spring snowmelt associated with spring air temperature rise and increase of winter base flow could cause the increase in maximum spring discharge in this river basin [McDonald et al., 2004; Kilmyaninov, 2000; Smith et al., 2007]. There were no trends revealed in aggregated spring maximum discharge for the entire Russian Arctic drainage basin (Table 1). [20] There is a distinct shift to earlier dates of spring maximum discharge across Russian Arctic drainage basin (Figure 2, right, and Table 2). The number of gauges with significant timing changes toward the earlier dates (negative trend) is much greater than those with trends toward later peak discharge (positive trend) for all time periods. Many gauges with negative changes have significant trends, while significant positive trends are infrequent or nonexistent. The dates of spring maximum discharge yielded more homogeneous results across the Russian Arctic than their magnitudes (Figure 4). The significant trends to earlier dates were found in time series aggregated for the entire Russian Arctic drainage basin (Table 2). The average change to earlier maximum discharge appearance were 5 days for 1960 – 2001, 4.7 days for 1950 – 2001, 3.2 days for 1940 –2001 and 4.6 days for 1930 – 2001. There are only two stations with significant trends to earlier snowmelt over 1930 – 2001 period (Figure 3, right) although the lowest trend in aggregated time series is noticed over 1940 – 2001. Thus the most significant shift to earlier spring maximum was observed over the last 40-year period, which is consistent with IPCC estimates [Intergovernmental Panel on Climate Change, 2001]. Significant trends to earlier spring discharge peak were very consistent over all given periods across the eastern part of Russian Arctic drainage basin including Central and Eastern Siberia and Far East (Table 2 and Figure 4). There were no significant changes in the aggregated time series of spring maximum discharge timing for Western Siberia covering most of the Ob river basin (Table 2). In the European part of the basin, significant trends are observed only over 1930 –2001 and 1940– 2001 and less obvious changes for the shorter time period are found. 5.2. Maximum Monthly Discharge (MMD) [21] The analysis of trends in daily maximum discharge for each calendar month is made to evaluate possible changes in the magnitude of summer-fall floods and to identify trends in winter discharge which could have been
G04S53
caused by (1) snowmelt during the transition periods or (2) an increase in baseflow. We understand that for most rivers the difference between maximum and minimum discharge in winter months is small, and our analysis should be consistent with results given for minimal discharge by Smith et al. [2007]. Trends in maximum discharge for each calendar month over the four time periods are given in Table 3. Analysis of MMD for spring months showed more positive significant trends in April and May and approximately the same number of significant negative and positive trends in June (Table 1). In general, the magnitude of MMD during these months did not significantly change and this agrees with the earlier analysis of spring maximum daily discharge. Some increase in maximum discharge found in April (Table 3) mostly took place on Siberian rivers with a stable winter regime without snowmelt associated discharge fluctuations in April. We suspect an increase in winter base flow is the likely cause. Our analysis finds no significant changes in maximum discharge during the summer months, when intensive rainfall and thunderstorm activity are greatest (Table 3). There are a few number of gauges with significant trends in MMD from July to September with slight prevalence of positive trends over 1950– 2001 and 1960– 2001 and negative ones over 1930 – 2001 and 1940– 2001. [22] The most noticeable changes were observed from the late fall (November) to early spring (March). This period is characterized by stable freeze-over on most rivers across the Russian Arctic drainage basin. Discharge fluctuations are typically minimal, and the hydrograph usually demonstrates a smooth recession from the end of November through March. Thus, for most gauges, the MMD varies little from minimum discharge for these months [Smith et al., 2007]. However, some river basins in European Russia and southern Siberia experienced short-term increases in discharge, especially during November and December, due to warm air masses causing associated snowmelt events [Alexandrov et al., 2003]. Positive changes were found in 80– 90% of the stations across the Russian Arctic during the winter months and 30– 50% of them were significant. The changes in MMD from December through March were very consistent over all time periods and were increasing from December through March (Table 3). Some tendency to increases in MMD during the last 50 years was observed in Spring (April – May) and Fall (September –October); however, it was less pronounced than changes over the winter period (Table 3). 5.3. Maximum Discharge of Large River Basins [23] We analyzed variations of maximum discharge for the six largest Russian rivers flowing to the Arctic Ocean in order to understand how they agree with the report changes in annual discharge for these basins [Peterson et al., 2002]. We also investigated the consistencies between changes in spring peak discharge for large downstream gauges and for relatively small watersheds located within these larger river basins. Four of the six large river basins have reservoirs with the potential to decrease maximum discharge. Only the Yenisei at Igarka showed a significant trend (p < 0.05) in maximum daily discharge over 1960 – 2001. It should be noted that Yenisei is the most regulated river of these six basins, with the major reservoirs being filled during the
7 of 14
SHIKLOMANOV ET AL.: VARIATIONS IN MAXIMUM DISCHARGE
G04S53
G04S53
Table 2. Characteristics of Changes in Date of Spring Maximum Daily Discharge Spatially Aggregated for Four Regions and Entire Russian Arctic Drainage Basina 1960 – 2001
1950 – 2001
Region
p-val
Change Days
p-val
1. European Arctic 2. West Siberia 3. Central Siberia 4. East Siberia and Far East Arctic Drainage
0.22 0.87 0.009 0.05 0.01
5.2 0.2 7.1 4.4 5.0
0.53 0.67 0.001 0.01 0.008
Change Days 2.5 1.1 7.2 5.7 4.7
1940 – 2001
1930 – 2001
p-val
Change Days
p-val
0.03 0.88 0.30 0.05 0.1
7.8 0.3 2.0 4.0 3.2
0.05 0.42 0.02 0.09 0.02
Change Days 7.5 2.3 6.1 4.2 4.6
a Boldface demonstrates the significant trends from Mann-Kendall test with 95% significance level (p < 0.05), and p-val denotes p-value from linear least squares regression.
1960s [Yang et al., 2004a]. It is interesting that aggregated maximum discharge from small natural rivers located in the basin had a significant opposite trend over the period. Thus the deep decline in the 1960s and 1970s responsible for the significant increase of maximum daily discharge on the
Yenisei at Igarka was mostly associated with reservoir filling (Figure 5). Changes in other downstream gauges are less or not significant. The Ob’, Lena, and Pechora rivers showed unmatched changes in spring peak with those aggregated from small natural watersheds located within
Figure 4. Changes in date of spring daily maximum discharge appearance (days) for four different periods. White and grey circles represent shift to earlier and later dates, respectively. Black triangles show gauges with no change (less than ±1 day). Crosses highlight stations with significant trends (p < 0.05). Ovals encircle regions where analysis of aggregated changes has been made. Colors of ovals reflect the positive (grey) or negative (white) changes over given periods. The names of regions discussed in the text are given in Table 2 with numbers shown in the top left plot. 8 of 14
SHIKLOMANOV ET AL.: VARIATIONS IN MAXIMUM DISCHARGE
G04S53
G04S53
Table 3. Number of Stations With Positive and Negative Changes in Maximum Daily Discharge for Each Month Over Different Periods and Number of Stations With Significant Trends From Mann-Kendall Testa Number of Gauges 1960 – 2001 (>30 years) Month January February March April May June July August September October November December
1950 – 2001 (>40 years)
1940 – 2001 (>50 years)
1930 – 2001 (>60 years)
Trend
Total
Significant
Total
Significant
Total
Significant
Total
Significant
Increasing Decreasing Increasing Decreasing Increasing Decreasing Increasing Decreasing Increasing Decreasing Increasing Decreasing Increasing Decreasing Increasing Decreasing Increasing Decreasing Increasing Decreasing Increasing Decreasing Increasing Decreasing
75 18 80 13 77 16 61 34 54 50 34 70 55 49 62 42 54 50 68 36 58 37 65 28
22 3 24 2 26 1 7 3 7 2 1 3 3 1 3 1 5 2 5 2 10 2 19 0
66 13 69 10 69 10 53 28 52 35 27 60 51 36 49 38 37 50 52 35 47 34 62 17
19 1 24 2 30 1 7 3 7 9 5 3 2 0 2 0 5 2 5 0 12 1 16 1
46 9 46 9 49 6 23 32 42 18 20 40 29 31 31 29 22 38 36 24 36 19 44 11
15 3 17 3 17 2 2 4 7 6 2 2 1 3 2 1 4 4 4 3 3 3 7 4
25 5 23 7 26 4 10 20 21 11 10 22 11 21 15 17 8 24 20 12 17 13 21 9
11 2 15 2 13 2 1 2 5 4 2 1 0 4 1 3 0 3 2 2 3 4 7 3
a Here p < 0.05. Boldface highlights months and periods when significant trend (increasing or decreasing) represented more than 70% of the stations and total number of stations with significant trends exceeded 4.
these larger river basins (Figure 5). The maximum daily discharge for the Kolyma and Severnaya Dvina rivers from downstream gauges and small natural watersheds show the same directional tendencies. We see significant negative trends (p < 0.1) over 1950 2001 from aggregated maximum discharge for Kolyma and positive trends (p < 0.1) from aggregated and downstream discharge for Severnaya Dvina over 1940 – 2001 and 1960 – 2001 respectively (Figure 5 and Table 4). [24] All large rivers except the Pechora demonstrated a tendency to earlier maximum discharge over 1950 – 2001 and 1960 – 2001 which agrees with changes found for small and medium size watersheds aggregated over each basin (Figure 6 and Table 5). However, the significant trend toward the earlier snowmelt was found only for Kolyma at Srednekolymsk over 1950 – 2000. [25] The significant trends were observed in time series aggregated from gauges on small and medium size rivers for Yenisey (1950– 2001 and 1960 – 2001), Lena (1950 – 2001) and Kolyma river basins (1950 – 2001). Consequently the most pronounced trend to earlier maximum spring discharge takes place in watersheds located east of Ob river basin (Table 5).
6. Discussion [26] An important result of this study is that owing to the enormous hydroclimatic complexity of the Russian Arctic Ocean drainage system we do not see a single governing trend in maximum daily discharge over the entire domain. Regional patterns, however, have emerged. Our hypothesis regarding an increased flood risk due to high discharge
magnitude events was not confirmed. We make no assessment about the increasing risk of floods originating from backwater conditions, such as ice jams and wind tides that have been documented for Russia [Buzin, 2004]. The most consistent changes were noted for spring maximum discharge decreases across the southern extents of Central Siberia (Figure 3) and increases in the Lena river basin over the all studied time periods. [27] Significant negative trends in dates of spring peak discharge were found across the entire domain, confirming our hypothesis of a shift to earlier spring floods. These changes are typical for the entire Russian Arctic drainage basin excluding only the western part of the Ob basin where there was a tendency to later spring maximum discharge (Figure 4). The decline in the ratio between the number of significant negative and positive trends with an increasing length period was found (Figure 2, right). Considering that the linear trend model is very sensitive to boundary values, we note that significant warming at high latitudes of the Northern Hemisphere during the 1930s and 1940s diminishes the long-term warming trend of the last 5 decades [Intergovernmental Panel on Climate Change, 2001; Arctic Climate Impact Assessment, 2005]. [28] The changes in spring maximum discharge are mostly consistent with changes in precipitation over the cold period, except for the Lena basin, where the increasing signal of spring peak discharge disagrees with the observed cold season precipitation change. This suggests a strong influence from factors affecting spring discharge generation. For example, an increase in spring air temperature could contribute to faster snowmelt, and a higher peak discharge. An increase in cold season baseflow and more water
9 of 14
G04S53
SHIKLOMANOV ET AL.: VARIATIONS IN MAXIMUM DISCHARGE
G04S53
Figure 5. Long-term variation in annual daily maximum discharge magnitude for downstream gauges of the six largest Russian Arctic rivers (solid thick line), linear trend (dashed line), and 5-year moving average (dotted line). saturated in the soil before the fall freeze-over may also be contributing to increased maximum discharge in the spring. It is interesting to note that hydrological conditions of spring flood formation in this region have been closely investigated after the ice-dammed floods at the end of 1990s and in 2001. Rapid increases in air temperature during spring, especially across the southern and central parts of the Lena basin, along with higher water stage and discharge
during the cold period, were documented as one of major hydroclimatic factors conducive to large ice jam formations [Kilmyaninov, 2000, 2001; Rozhdestvensky et al., 2003]. Therefore the documented changes in air temperature and baseflow may be contributing to the spring peak discharge in this basin. [29] Testing the hypothesis that reported increases in extreme precipitation events across Russia [Sun and
10 of 14
G04S53
SHIKLOMANOV ET AL.: VARIATIONS IN MAXIMUM DISCHARGE
G04S53
Table 4. Changes in Spring Daily Maximum Discharge for Six Large Russian River Basins Estimated From Downstream Gauge Data (Downstream Gauge) and From Aggregation of Data From Small Natural Watersheds Located Within Large River Basins (Small Subbasins)a 1960 – 2001 River and Station Severnaya Dvina at Ust’ Pinega Pechora at Ust’ Tsilma Ob’ at Salekhard Yenisei at Igarka Lena at Kusur Kolyma at Srednekolymsk
1950 – 2001
1940 – 2001
Downstream Gauge Small Subbasins Downstream Gauge Small Subbasins Downstream Gauge Small Subbasins 21 5.2 1.4 24 3.1 3.3
19 1.0 9.0 20 22 15
5.9 7.7 5.3 1.7 3.3 14
23 3.5 3.4 26 17 32
7.0 8.9 1.5 2.8 2.6 13
22 7.7 17 13 20 13
a Boldface denotes the significant trends from Mann-Kendall test with 95% significance level (p < 0.05), and italics denote the significant trends with 90% significance level (p < 0.10).
Groisman, 2000; Groisman et al., 2005] could contribute to higher extreme discharge risk, we found no significant changes in magnitude of the summer-fall floods. The conclusion of heavy precipitation rise in these publications was mostly made by taking into account the increasing frequency of intensive rains rather than their magnitude. However, for maximum monthly discharge (MDD), the magnitude of extreme rains is more important. Some increases in MDD for April, May and a decrease for June were also noted. This can be explained by a shift to earlier peak discharge (from earlier snowmelt) found from the spring maximum discharge analysis. The most consistent increases in MDD were found for the cold period from November to March. This can be partly related to increased snowmelt events associated with rising regional air temperature during transition periods. However, the most significant changes in MDD were observed in months with very stable negative air temperature across the Russian Arctic drainage basin (January – March), when the snowmelt events are much less frequent than in November –December. Thus these changes were a result of increases in winter baseflow rather than winter snowmelt. This conclusion is consistent with other estimates of long-term variation in winter discharge across Russia [Lammers et al., 2001; Georgievsky et al., 2002; Smith et al., 2007]. Another possible explanation for such a comprehensive change in the winter regime is that the magnitude of discharge during the cold period is much smaller than open water discharge, and any small changes, which are negligible in terms of the contribution to annual discharge, are much more noticeable and significant during this period. It should be also noted that the accuracy of daily discharge during the winter is much lower and that errors in daily discharge estimates can reach up to 30% [Shiklomanov et al., 2006]. Stations with significant positive changes in winter were very evenly distributed across the Russian Arctic drainage basin and watersheds with possible winter snowmelt events, located in European part and south Siberia, have even less noticeable changes than those located in the permafrost zone with stable snow cover. Additional discussion of winter discharge changes are given by Smith et al. [2007]. [30] There was little consistency between changes in the magnitude of spring maximum daily discharge for the downstream gauges of the six largest Russian rivers (Figure 1a) and the small to medium sized rivers located within these large river basins (Figure 5 and Table 4). There are several possible causes of such inconsistency. Four of the six
downstream gauges are influenced to some degree by reservoir regulation which can obscure the natural variability of maximum discharge. The distribution of the small watersheds across large river basins is uneven, with more gauges being located in higher populated upstream and middle stream portions of the big basins such as Ob’, Yenisei and Lena where the greatest inconsistencies were found (Figure 1a). These areas are usually far from downstream gauges and their effects on the formation of maximum discharge at these gauges are likely negligible. The spatial asymmetry of the small basins within the larger river systems occurs during individual periods in all large river basins (Figure 3, left). [31] The absence of significant increasing trends in daily maximum discharge from the six large Russian river basins (Figure 5) indicates there is no contribution of spring discharge to the documented increase in annual discharge from these river basins as given by Peterson et al. [2002]. However, to fully rule out spring discharge as a contributory factor in the Eurasian trend a more comprehensive analysis of spring flood volume is needed rather than that of peak discharge as discussed in this paper. [32] There is more consistency, especially over 1950– 2001 and 1960 – 2001, between changes in the date of maximum discharge for the downstream gauges and those found by aggregation of multiple smaller basins. These changes agree with consistent increases in air temperature observed over the Russian Arctic [Hansen et al., 2006; Arctic Climate Impact Assessment, 2005; Intergovernmental Panel on Climate Change, 2001] and we assume this rise in spring air temperature plays the major role in shifting daily maximum discharge to earlier dates in the year.
7. Conclusions [33] Most climate model simulations suggest an intensification of the hydrological cycle under climatic warming, with the Russian Arctic expected to experience an increase in extreme hydrological events [Intergovernmental Panel on Climate Change, 2001; Arctic Climate Impact Assessment, 2005]. Recently documented increases in heavy rains across Russia [Sun and Groisman, 2000; Groisman et al., 2005] support this acceleration of the arctic hydrological cycle. This paper presents the first analysis of a new daily discharge data set for Russian Arctic which was compiled to address aspects of climate change and discharge variability. This new data set is integrated into the R-ArcticNet
11 of 14
G04S53
SHIKLOMANOV ET AL.: VARIATIONS IN MAXIMUM DISCHARGE
G04S53
Figure 6. Long-term variation in dates of annual daily maximum discharge for downstream gauges of the six largest Russian Arctic rivers (solid thick line), linear trend (dashed line), and 5-year moving average (dotted line). V.4.0 archive (http://www.r-arcticnet.sr.unh.edu/v4.0/). While many drainage basins in our study showed significant changes in maximum discharge, we found no strong spatial pattern to these changes over the larger domain and we conclude that extreme hydrological events associated with snowmelt or rainfall have not become more common over recent decades. This conclusion agrees with results for large regions of the globe [Lins and Slack, 1999; Kundzewicz et
al., 2005]. A shift toward earlier timing of the maximum spring flood, however, was found over nearly the entire domain. The shift is most pronounced over the 1960 – 2001 period and averages 5 days. No trends in flooding attributable to rainfall were found. A significant increase in daily maximum discharge during the winter months is consistent with previous studies of cold season runoff characteristics. There were no significant trends in the magnitude or timing
12 of 14
G04S53
SHIKLOMANOV ET AL.: VARIATIONS IN MAXIMUM DISCHARGE
G04S53
Table 5. Changes in Date of Spring Daily Maximum Discharge for Six Large Russian River Basins Estimated From Downstream Gauge Data (Downstream Gauge) and From Aggregation of Data From Small Natural Watersheds Located Within Large River Basins (Small Subbasins)a 1960 – 2001 River and Station Severnaya Dvina at Ust’ Pinega Pechora at Ust’ Tsilma Ob’ at Salekhard Yenisei at Igarka Lena at Kusur Kolyma at Srednekolymsk
1950 – 2001
1940 – 2001
Downstream Gauge Small Subbasins Downstream Gauge Small Subbasins Downstream Gauge Small Subbasins 6.0 11 8.3 3.5 3.2 6.3
3.5 7.7 2.9 5.9 3.6 3.6
4.1 6.1 0.9 1.5 2.6 13
3.2 0.5 3.1 8.1 4.6 4.9
5.4 4.9 1.5 3.6 2.7 8.5
6.8 1.6 0.6 1.5 1.9 3.2
a
Boldface shows the significant trends from Mann-Kendall test with 95% significance level (p < 0.05).
of maximum daily discharge for the six large Russian rivers flowing to the Arctic Ocean. However, we found significant trends toward earlier spring discharge peak in the time series from small natural river basins aggregated over the Yenisei, Lena and Kolyma rivers. Therefore the Eastern part of the Russian Arctic drainage, with a more continental climate, demonstrates greater changes in timing of spring snowmelt which is consistent with reported air temperature changes [Hansen et al., 2006; Arctic Climate Impact Assessment, 2005]. [34] The absence of changes in spring maximum discharge for the six Eurasian basins and significant increases in winter discharge across the Russian Arctic suggest that most of the increase in annual discharge from the Russian Arctic is the result of rising base flow during the fall and winter seasons. However, analysis of the extremes does not allow us to state this conclusion with confidence as a quantitative analysis of the long-term variation of intraannual discharge volumes would be required. [35] The Russian Arctic discharge records used in this study are valuable to our understanding of the natural processes influencing changes in annual discharge to the Arctic Ocean documented by Peterson et al. [2002]. The daily discharge data can be used for various detailed studies of changes in discharge hydrographs caused by climate variations. This powerful new long-term daily river discharge data set is useful for researchers interested in quantifying the changes in spring flood volume, base flow, frequency and duration of rainfall floods, and the shape of hydrograph recession curve to provide insight into the intraannual and interannual discharge variability over a very large region of the Russian Arctic. [36] Acknowledgments. We thank Michael Sharomov and Oleg Golovanov for their help in compiling a new daily discharge data set as well as other collaborators from the State Hydrological Institute, St. Petersburg, Russia, who were involved in data digitizing. Funding for this research was provided by the NSF Arctic System Science Program (ARCSS) Freshwater Initiative (ARC-023091, ARC-0230243) and NASA NNG04GM19G.
References Alexandrov, E. I., N. N. Bryazgin, and A. A. Dementyev (2003), Tendencies in changes of surface air temperature and precipitation in Northern polar regions over the second half of XX century, in Problems of Arctic and Antarctic, pp. 31 – 40, Gidrometeoizdat, St. Petersburg, Russia. Arctic Climate Impact Assessment (2005), Arctic Climate Impact Assessment – Scientific Report, 1042 pp., Cambridge Univ. Press, New York. Berezovskaya, S., D. Yang, and D. L. Kane (2004), Compatibility analysis of precipitation and runoff trends over the large Siberian watersheds, Geophys. Res. Lett., 31, L21502, doi:10.1029/2004GL021277.
Berezovskaya, S., D. Yang, and D. L. Kane (2005), Long-term annual water balance analysis of the Lena River, Global Planet. Change, 48, 84 – 95. Buzin, B. A. (2004), Ice Jams and Ice Jam Floods on Rivers, 204 pp., Sankt Petersburg, Gidrometeoizdat, St. Petersburg, Russia. Georgievsky, V. Y., I. A. Shiklomanov, and A. L. Shalygin (2002), Longterm variations in the runoff over the Russian territory, Rep. State Hydrol. Inst., 85 pp., State Hydrol. Inst., St. Petersburg, Russia. Goodison, B., P. Louie, and D. Yang (1998), WMO solid precipitation measurement intercomparison, Final Rep. WMO/TD-No. 872, 88 pp., World Meteorol. Org., Geneva. Groisman, P. Y., R. W. Knight, D. R. Easterling, T. R. Karl, G. C. Hegerl, and V. N. Razuvaev (2005), Trends in intense precipitation in the climate record, J. Clim., 18, 1343 – 1367. Hansen, J. M., R. Sato, K. Ruedy, K. Lo, D. W. Lea, and M. MedinaElizade (2006), Global temperature change, Proc. Natl. Acad. Sci. U. S. A., 103, 14,288 – 14,293, doi:10.1073/pnas.0606291103. Helsel, D. R., and R. M. Hirsch (1992), Statistical Methods in Water Resources, Stud. Environ. Sci. 49, 522 pp., Elsevier, New York. Intergovernmental Panel on Climate Change (2001), Climate Change 2001: The Scientific Basis: Contribution of Working Group I to the Third Assessment Report of the Intergovernmental Panel on Climate Change, edited by J. T. Houghton et al., 881 pp., Cambridge Univ. Press, New York. International Permafrost Association (1998), Data and Information Working Group: Circumpolar Active-Layer Permafrost System (CAPS), Version 1.0 [CD-ROM], Natl. Snow and Ice Data Cent., Boulder, Colo. Kilmyaninov, V. V. (2000), Conditions for flood formations under ice jams on the middle stream of Lena River in 1998 and 1999, Meteorol. Hydrol., 10, 93 – 98. Kilmyaninov, V. V. (2001), Catastrophic flood on Lena at Lensk in 2001, Meteorol. Hydrol., 12, 79 – 83. Kundzewicz, Z. W., D. Graczyk, T. Maurer, I. Pinskwar, M. Radziejewski, C. Svensson, and M. Szwed (2005), Trend detection in river flow series: 1. Annual maximum flow, Hydrol. Sci. J., 50(5), 797 – 810. Lammers, R. B., A. I. Shiklomanov, C. J. Vo¨ro¨smarty, B. M. Fekete, and B. J. Peterson (2001), Assessment of contemporary Arctic river runoff based on observational discharge records, J. Geophys. Res., 106(D4), 3321 – 3334. Lins, H. F., and J. R. Slack (1999), Streamflow trends in the United States, Geophys. Res. Lett., 26, 227 – 230. McClelland, J. W., R. M. Holmes, B. J. Peterson, and M. Stieglitz (2004), Increasing river discharge in the Eurasian Arctic: Consideration of dams, permafrost thaw, and fires as potential agents of change, J. Geophys. Res., 109, D18102, doi:10.1029/2004JD004583. McClelland, J. W., S. J. Dery, B. J. Peterson, R. M. Holmes, and E. F. Wood (2006), A pan-Arctic evaluation of changes in river discharge during the latter half of the 20th century, Geophys. Res. Lett., 33, L06715, doi:10.1029/2006GL025753. McDonald, K. C., J. S. Kimball, E. Njoku, R. Zimmermann, and M. Zhao (2004), Variability in springtime thaw in the terrestrial high latitudes: Monitoring a major control on the biospheric assimilation of atmospheric CO2 with space-borne microwave remote sensing, Earth Interact., 8(20), 1 – 23. Milly, P. C. D., R. T. Wetherald, K. A. Dunne, and T. L. Delworth (2002), Increasing risk of great floods in a changing climate, Nature, 415, 514 – 517, doi:10.1038/415514a. National Climatic Data Center (2005a), Daily and sub-daily precipitation for the Former USSR, Tech. Rep. 9813, Natl. Clim. Data Cent., Asheville, N. C. (Available at http://www.ncdc.noaa.gov/oa/documentlibrary/surfacedoc.html#9813). National Climatic Data Center (2005b), Data Documentation for Data Set 9290c, Global Synoptic Climatology Network, C. Former USSR, Version 1.0, 12 pp., Natl. Clim. Data Cent., Asheville, N. C.
13 of 14
G04S53
SHIKLOMANOV ET AL.: VARIATIONS IN MAXIMUM DISCHARGE
Pavelsky, T. M., and L. C. Smith (2006), Intercomparison of four global precipitation data sets and their correlation with increased river discharge to the Arctic Ocean, J. Geophys. Res., 111, D21112, doi:10.1029/ 2006JD007230. Peterson, B. J., R. M. Holmes, J. W. McClelland, C. J. Vo¨ro¨smarty, R. B. Lammers, I. A. Shiklomanov, A. I. Shiklomanov, and S. Rahmstorf (2002), Increasing river discharge to the Arctic Ocean, Science, 298, 2171 – 2173. Pilon, P. J., and J. K. Kuylenstierna (2000), Pristine river basins and relevant hydrological indices: Essential ingredients for climate-change studies, World Meteorol. Org. Bull., 49(3), 248 – 255. Rawlins, M. A., C. J. Willmott, A. Shiklomanov, E. Linder, S. Frolking, and R. B. Lammers (2006), Evaluation of trends in derived snowfall and rainfall across Eurasia and linkages with discharge to the Arctic Ocean, Geophys. Res. Lett., 33, L07403, doi:10.1029/2005GL025231. Rozhdestvensky, A. V., V. A. Buzin, and V. A. Lobanov (2003), Investigation of formation conditions and computations of maximal water stages on the Lena River at Lensk, Meteorol. Hydrol., 2, 68 – 76. Shiklomanov, A. I., R. B. Lammers, and C. J. Vo¨ro¨smarty (2002), Widespread decline in hydrological monitoring threatens pan-Arctic research, Eos Trans. AGU, 83, 16 – 17. Shiklomanov, A. I., I. A. Shiklomanov, and N. I. Savelieva (2005), Freshwater discharge, in Arctic Climate Impact Assessment, Arctic Climate Impact Assessment Group, pp. 223 – 229, Cambridge Univ. Press, New York. Shiklomanov, A. I., T. I. Yakovleva, R. B. Lammers, I. P. Karasev, C. J. Vo¨ro¨smarty, and E. Linder (2006), Cold region river discharge uncertainty – Estimates from large Russian rivers, J. Hydrol., 326, 231 – 256. Smith, L. C. (2000), Trends in Russian Arctic river-ice formation and breakup, 1917 – 1994, Phys. Geogr., 20(1), 46 – 56. Smith, L. C., T. M. Pavelsky, G. M. MacDonald, A. I. Shiklomanov, and R. B. Lammers (2007), Rising minimum daily flows in northern Eurasian
G04S53
rivers suggest a growing influence of groundwater in the high-latitude water cycle, J. Geophys. Res., doi:10.1029/2006JG000327, in press. State Hydrological Institute (1980), Hydrological Year Book, vol.16, Resources of Surface Water, Gidrometeoizdat, Leningrad, Russia. Sun, B., and P. Y. Groisman (2000), Cloudiness variations over the former Soviet Union, Int. J. Climatol., 20, 1097 – 1111. Unger, S. (1999), Is strange weather in the air? A study of US national network news coverage of extreme weather events, Clim. Change, 41, 133 – 150. World Meteorological Organization (1993), Report of the experts meeting on reference climatological stations (RCS) and national climate data catalogues (NCC), WCDMP-No. 23, WMO -TD No. 535, World Meteorol Org., Geneva. Yang, D., D. L. Kane, L. D. Hinzman, X. Zhang, T. Zhang, and H. Ye (2002), Siberian Lena River hydrologic regime and recent change, J. Geophys. Res., 107(D23), 4694, doi:10.1029/2002JD002542. Yang, D., D. Robinson, Y. Zhao, T. Estilow, and B. Ye (2003), Streamflow response to seasonal snow cover extent changes in large Siberian watersheds, J. Geophys. Res., 108(D18), 4578, doi:10.1029/2002JD003149. Yang, D., B. Ye, and D. L. Kane (2004a), Streamflow changes over Siberian Yenisei River Basin, J. Hydrol., 296, 59 – 80. Yang, D. Q., B. Ye, and A. I. Shiklomanov (2004b), Discharge characteristics and changes over the Ob’ River watershed in Siberia, J. Hydrometeorol., 5, 595 – 610. R. B. Lammers, M. A. Rawlins, and A. I. Shiklomanov, Water Systems Analysis Group, Institute for the Study of Earth, Oceans and Spaces, University of New Hampshire, Durham, NH 03824, USA. (sasha@eos. sr.unh.edu) T. M. Pavelsky and L. C. Smith, Department of Geography, Box 951524, University of California, Los Angeles, CA 900915-1524, USA.
14 of 14