This document is made available electronically by the Minnesota Legislative Reference Library as part of an ongoing digital archiving project. http://www.leg.state.mn.us/lrl/lrl.asp
Tax Incentives and Venture Capital Financing Introduction This report was prepared by House Research staff at the request of the chair of the Committee on Taxes to provide the committee members with background information as they evaluate whether to provide incentives (either tax incentives or direct spending incentives financed with cutbacks in other tax incentives) for venture capital investments in Minnesota businesses. It summarizes the arguments for venture capital incentives, describes incentives provided in Wisconsin, and then provides three types of information: A compilation of data on the amount of venture capital financing in Minnesota from 1995 to 2009, and comparison of Minnesota with Wisconsin, the region, and the rest of the nation. This data is taken from what appears to be the only comprehensive, publicly available, nationwide source of information on venture capital finances by state, The MoneyTreeTM Report prepared by PricewaterhouseCoopers and the National Venture Capital Association. A discussion of the investment incentives provided in Wisconsin, based on the Wisconsin and Minnesota experience as reflected in the MoneyTreeTM Report data. A discussion of the advantages and disadvantages of using tax incentives versus a direct spending approach (e.g., matching grants instead of tax credits) to encourage one narrow form of venture capital investment in Minnesota, angel investment. Questions about this report may be addressed to any of the following House Research staff: Nina Manzi, 651-296-5204 or
[email protected] Joel Michael, 651-296-5057 or
[email protected] Anita Neumann, 651-296-5056 or
[email protected] Crystal Lewis, a Research Assistant in House Research, provided research support for this report.
The Case for Venture Capital (VC) Tax Incentives The case for enacting Minnesota tax incentives for venture capital investments, such as the angel investment credit for seed or early stage investments or a CAPCO credit for later stage venture capital investment, appears to be based primarily on two premises: Minnesota does poorly in attracting venture capital or has inadequate venture capital; proponents of Minnesota venture capital incentives often assert that venture capitalists on the coasts are reluctant to invest in “flyover land” and that Minnesota investors are too risk averse to make sufficient venture capital investments.
Presentation to the House Committee on Taxes House Research Department
February 9, 2010 Page 2
States with angel investment credits, CAPCO credits, or other venture capital tax incentives generally are more successful in creating a business environment that provides adequate amounts of venture capital than states (like Minnesota) that do not have tax incentives.
Comparison with Wisconsin’s Policies Much of the discussion of proposals for Minnesota venture capital incentives has focused on the relative availability of venture capital in Minnesota compared with Wisconsin. The two neighboring states have very similar profiles – e.g., both states have comparable mixed and diverse economies with important agricultural and industrial sectors, somewhat similar demographics, large state universities with national reputations for their research in science and technology, and so forth. The two states differ, however, in the tax incentives that they provide for venture capital. Wisconsin uses its tax code heavily to encourage venture capital investment – both on the “front end” through tax credits that apply when venture capital investments are made and on the “back end” through a capital gain exclusion that reduces tax on gain realized on successful investments. Minnesota does neither.1 The news media have reported on Minnesota businesses relocating to Wisconsin to obtain access to venture capital that is available because of the Wisconsin tax incentives, particularly those for “angel” investment. The following is a brief description of the Wisconsin tax incentives: CAPCO credit. In 1998, Wisconsin enacted a $50 million CAPCO2 credit, following a number of other states in providing this type of tax incentive for later stage venture capital investments. CAPCO credits have a goal of increasing the pool of private venture capital by providing tax credits to insurance companies to invest in qualifying businesses.3 Although legislators, the governor, and the governor’s 21st Century Tax Commission have proposed Minnesota CAPCO credits, none of them has been enacted into law. The Wisconsin credit is reportedly up for renewal in the 2010 Wisconsin legislative session. Angel investment credit. In 2003, Wisconsin enacted an angel investment credit to encourage early stage venture capital investments in Wisconsin businesses (effective July 1, 2004). Since its enactment, the Wisconsin legislature has expanded the angel 1
Minnesota experimented with two credits in the middle 1980s, an equity investment credit and a technology transfer credit. These credits were enacted in 1983 and repealed by the legislature in 1987. See footnote 33 for citations to the laws. 2
CAPCO refers to Certified Capital Company and is generally associated with state tax credit programs that use tax credits against the state insurance premiums tax to provide a pool of venture capital. A number of states, beside Wisconsin, have enacted these credits. A description of the structure of these style programs can be found in the Missouri State Auditor’s performance audit of the Missouri program. Missouri State Auditor, Report No. 200456 (July 2, 2004), available here: http://www.auditor.mo.gov/press/2004-56.pdf. 3
For a more complete description of the concept and the Wisconsin law, see the description on the Wisconsin Bar Association site here: http://www.wisbar.org/am/template.cfm?section=wisconsin_lawyer&template=/cm/contentdisplay.cfm&contentid= 33959.
Presentation to the House Committee on Taxes House Research Department
February 9, 2010 Page 3
investment credit several times, including in its 2009 legislative session. The law authorizes a maximum of $47.5 million in these credits.4 Angel and seed capital investment credits have repeatedly been proposed in Minnesota, including as part of the governor’s budgets in 2007 and 2009, but have never been enacted. Early stage seed investment credit. The 2003 Wisconsin legislation also authorized a 25 percent tax credit for investments in funds that invest in early stage businesses (certified as meeting the same criteria as the businesses qualifying under the angel investment credit).5 This credit was originally authorized at an aggregate maximum amount of $35 million, but this limit was later lifted.6 Capital gains exclusion. Wisconsin has allowed a 60-percent capital gains exclusion for most long-term gains since the early 1980s.7 By contrast, in 1987 Minnesota repealed its capital gains exclusion in conforming to the federal changes that were enacted in Tax Reform Act of 1986. Since that change, Minnesota has taxed capital gains as ordinary income, that is, the same as wages, interest, dividends, or other investment or business income. In 2009, the Wisconsin Legislature reduced the generosity of the Wisconsin capital gains exclusion, cutting it from a 60-percent to a 30-percent exclusion. This change was effective for tax year 2009.8 To help evaluate Minnesota’s venture capital situation and whether Wisconsin’s aggressive set of tax incentives has created an advantage for it as compared with Minnesota, the committee chair requested House Research to gather information on the amount of venture capital financing in the two states. Unfortunately, there isn’t an available government data set that collects information on the amount of venture capital financing by state (or separately at all). A private industry source, The MoneyTreeTM Report (“MTR”) prepared by PricewaterhouseCoopers and the National Venture Capital Association, appears to be the only source of national data on venture capital financing that is readily available to the public. As a result, we used this source to compile information on venture capital financing in Minnesota, Wisconsin, and the MTR North Central region (which in addition to Minnesota and Wisconsin includes Iowa, Nebraska, North Dakota, and South Dakota). For some caveats about the data see the discussion in Appendix B. The MTR data goes back to 1995 and is reported on a quarterly basis. We compiled the data by year, rather than quarter. The MTR data is broken down by stage of development and by industry sector. We used the stage of development breakdowns, since the angel investment credit and the early stage seed investment credit are both directed at businesses in early stages of development (typically before the businesses’ products are selling commercially). The CAPCO 4
Wis. Stat. § 71.07 (5d)(c) (2009). The original law authorized $30 million in credits. 2003 Wis. Act 255 § 5.
5
Wis. Stat. § 71.07 (5b).
6
2003 Wis. Act 255 § 4, codified as Wis. Stat. § 71.07(5b) (c) ($35 million limit); 2007 Wis. Act 20 § 1977 (raising $35 million limit to $52.5 million); 2009 Wis. Act 2 § 101 (repealing the dollar limit). 7
This exclusion applies to most long-term capital gains, not just those from venture capital investments.
8
See Wisconsin Dept. of Revenue release on this at http://www.dor.state.wi.us/taxpro/news/090713.html.
Presentation to the House Committee on Taxes House Research Department
February 9, 2010 Page 4
credit, by contrast, is widely thought to be used mainly for businesses in later stages of development. (Proponents of the credits argue that they are complementary for this reason.) We did not include industry sector data, since there would be many years in which there were few or no financings for some sectors. MTR breaks down its data on venture capital financing into four stages, which it defines as follows (copied from the MTR website): Seed/Start-Up Stage The initial stage. The company has a concept or product under development, but is probably not fully operational. Usually in existence less than 18 months. Early Stage The company has a product or service in testing or pilot production. In some cases, the product may be commercially available. May or may not be generating revenues. Usually in business less than three years. Expansion Stage Product or service is in production and commercially available. The company demonstrates significant revenue growth, but may or may not be showing a profit. Usually in business more than three years. Later Stage Product or service is widely available. Company is generating on-going revenue; probably positive cash flow. More likely to be, but not necessarily profitable. May include spin-offs of operating divisions of existing private companies and established private companies.9
Angel investors would typically invest in the “Seed/Start-Up Stage” or the “Early Stage,” while a CAPCO investor would more likely invest in the “Later Stage” or in some instances in the “Expansion Stage.”
Comparison of VC Financing in Minnesota, Wisconsin, and the Region Table 1 shows the per capita amount of venture capital financings for each year from 1995 through 2009 for each stage of development for Minnesota, Wisconsin, and MTR’s North Central Region. For all years and all stages, Minnesota’s per capita amounts exceed those of Wisconsin and the region, in most instances by substantial amounts. For example, in 2009 Minnesota received $10.92 of early stage investment per capita, compared with $2.34 per capita in Wisconsin and $4.39 throughout the North Central region (including Minnesota and Wisconsin). These amounts are not adjusted for inflation, since they are intended to show the relative annual rankings of the two states and the region. If these data are used to compare trends over time, they will tend to overvalue the amounts from later years, while reducing the relative values for the data for earlier years.
9
Quoted from: https://www.pwcmoneytree.com/MTPublic/ns/nav.jsp?page=definitions.
Presentation to the House Committee on Taxes House Research Department
February 9, 2010 Page 5
Table 1
Dollar amount of Per Capita Venture Capita Investment By Stage Minnesota, Wisconsin, and the MTR North Central Region* Year
Startup/Seed Stage MN WI Region
MN
Early Stage WI Region
Expansion Stage MN WI Region
MN
Later Stage WI Region
1995
$5.52
$0.10
$1.68
$9.33
$0.20
$3.22
$19.95
$0.31
$7.16
$2.02
$1.12
$0.97
1996
2.64
0.20
0.85
6.80
2.32
3.16
18.04
2.04
7.71
8.54
0.29
2.63
1997
6.99
0.40
2.21
11.82
5.00
5.17
29.72
5.17
11.92
6.03
2.50
2.62
1998
5.57
0.28
2.40
21.03
2.11
7.47
42.21
7.05
15.49
6.14
0.19
1.90
1999
13.83
0.67
4.37
26.38
2.17
10.22
79.55
11.90
30.31
8.71
1.71
3.18
2000
6.17
1.61
2.38
42.59
7.92
17.41
108.22
20.33
47.69
41.50
-
12.48
2001
2.17
0.04
0.67
17.25
6.68
8.84
52.59
9.15
23.54
16.49
-
5.07
2002
0.36
0.03
0.12
15.96
2.83
7.08
36.23
1.87
12.33
26.69
4.19
9.50
2003
0.04
0.16
0.06
11.94
1.55
4.79
25.46
0.11
8.32
8.63
5.03
16.35
2004
2.53
-
0.77
3.37
3.69
2.08
42.91
0.61
12.50
45.10
5.86
14.19
2005
0.77
0.01
0.24
10.37
0.40
3.30
10.16
3.44
5.33
37.43
8.06
14.19
2006
1.35
0.58
0.61
5.61
5.35
3.63
34.32
1.90
11.48
22.14
4.82
8.38
2007
7.89
0.11
2.81
16.57
2.23
6.04
21.84
6.79
8.93
47.14
5.31
16.16
2008
6.91
1.85
3.69
9.59
6.69
5.41
8.21
1.49
4.98
67.38
1.35
21.06
2009
4.96
-
1.52
10.92
2.34
4.39
15.92
0.74
5.67
20.31
0.84
10.84
*Region is Iowa, Minnesota, Nebraska, North Dakota, South Dakota, and Wisconsin (MTR definition). Source: PricewaterhouseCoopers and National Venture Capital Association, MoneyTreeTM Report, available at: https://www.pwcmoneytree.com/MTPublic/ns/nav.jsp?page=search Per capita amounts calculated using annual population estimates of the United States Bureau of the Census.
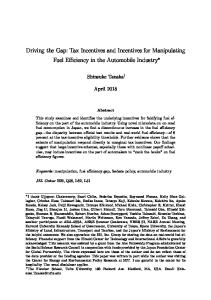
Figure 1 graphs the annual per capita amount of venture capita financing in Minnesota, Wisconsin, and the MTR North Central region. These amounts are all stated in 2009 dollars, to control for the effects of inflation. As can be seen, Minnesota is consistently, and in most years substantially, above Wisconsin and the regional amounts.
Presentation to the House Committee on Taxes House Research Department
February 9, 2010 Page 6
Figure 1
Total Venture Capital Financings Per Capita, 1995-2009 $300
Minnesota Wisconsin Region
$250 $200
$150 $100 $50 $0 1995
2000
2005
2009
Source: MoneyTreeTM Report, PricewaterhouseCoopers and National Venture Capital Association.
Comparison with National Levels Minnesota’s experience, however, looks less favorable when compared with national data. Figure 2 shows Minnesota per capita venture capital financing as a percentage of the national per capita amount over the 15-year period. If Minnesota’s per capita financing equaled the national per capita amount, the bars would reach to the 100% line, represented by the solid horizontal line drawn through the bars. Years in which the bars exceed 100% are years where Minnesota per capita financing exceeded the national per capita amount. As can be seen, this occurred in only five of the 15 years and in many of those years by relatively small amounts. Years in which the bars are lower than the 100% line are years where Minnesota’s per capita financing was less than the national per capita amount. For the period, the national per capita amounts exceeded Minnesota’s by about 27 percent.
Presentation to the House Committee on Taxes House Research Department
February 9, 2010 Page 7
Figure 2
Per Capita MN Venture Capital Financing As a Percent of US Amounts, 1995 - 2009 140.0% 120.0% 100.0% 80.0% 60.0%
40.0% 20.0% 0.0% 1995
2000
2005
2009
Source: MoneyTreeTM Report, PricewaterhouseCoopers and National Venture Capital Association.
It is, however, widely recognized that the “coasts” (especially California and Massachusetts) dominate venture capital financing.10 Silicon Valley in California with its wide array of technology companies and pattern of frequent startups is regarded as the hotbed for venture capital financings in America. Similarly, Boston (including its suburbs ringed by Route 128) also has a reputation as an area where venture capital financing is widely available. Thus, it might be useful to compare Minnesota to national amounts that exclude data for California and Massachusetts. Figure 3 shows the Minnesota per capita venture capital amount as percentage of the national per capita amount, but excluding the California and Massachusetts data. In all but one year and, then, only by a very small amount, Minnesota’s per capita venture capital financing amounts exceeded the amounts for the nation, excluding California and Massachusetts. This suggests that Minnesota does quite well in venture capital financing, unless you compare the state to California and Massachusetts. (For the 15-year period, Minnesota’s per capita amount was 47 percent higher than the national amount, excluding California and Massachusetts.) By California’s and Massachusetts’ standards, of course, Minnesota does poorly. But few, if any, states can match those two states in available venture capital.
10
Ron Wirtz, “Fairy Tales and Venture Capital,” fedgazette (July 2001) (“Nonetheless, it remains that the majority of acorns [venture capital investments] fall disproportionately on a few coastal regions. Silicon Valley and northern California grab almost a third of all venture capital investments in the United States.”), available at: http://www.minneapolisfed.org/publications_papers/pub_display.cfm?id=2128 (last accessed 1/21/2010).
Presentation to the House Committee on Taxes House Research Department
February 9, 2010 Page 8
Figure 3
Per Capita MN Venture Capital Financing as a Percent of The US Amounts, Ex California and Massachusetts, 1995 - 2009 300.0% 250.0% 200.0% 150.0% 100.0% 50.0% 0.0% 1995
2000
2005
2009
Source: MoneyTreeTM Report, PricewaterhouseCoopers and National Venture Capital Association.
Minnesota also does relatively well, if the benchmark is its ranking relative to other states. Table 2 displays the national rankings of Minnesota and Wisconsin for the period the MTR data is available (1995 – 2009), based on the number of reported deals, amount of investment, and per capita investment. The rankings for the number of deals and the amount of investment probably are not very relevant, since they don’t control for the relative sizes of states. (New York is treated equally with North Dakota, despite the obvious differences in populations and the sizes of their economies.) Thus, the focus should be on the per capita amounts. For the entire period Minnesota’s average ranking was 10, while Wisconsin’s was 32. Wisconsin’s ranking was fairly consistent across the period.11 Minnesota’s, by contrast, dipped in the 1999 – 2001 period when venture capital boomed nationally.
11
As an aside, one can observe no apparent effect of Wisconsin’s enactment of tax incentives (in 1997 and 2003) appearing in this crude measure of success in the putative interstate competition to attract venture capital. Of course, this says nothing about what would have happened if Wisconsin had not enacted its incentives, and the actions of other states are obviously relevant as well.
Presentation to the House Committee on Taxes House Research Department
February 9, 2010 Page 9
Table 2
Minnesota’s and Wisconsin’s Venture Capital Financing National Rank 1995 - 2009 Year
Number of Deals
Minnesota Amount of Investment
Per capita Investment
Number of Deals 30
Wisconsin Amount of Per capita Investment Investment 32 39
1995
8
11
4
1996
15
14
9
27
30
35
1997
7
14
7
23
24
26
1998
11
14
9
27
30
34
1999
16
16
13
25
28
35
2000
16
16
17
28
31
35
2001
15
16
16
24
29
32
2002
15
13
9
28
28
32
2003
14
15
13
29
28
34
2004
13
10
8
27
26
30
2005
15
13
12
25
28
28
2006
16
15
12
22
24
27
2007
16
14
7
25
27
27
2008
15
9
6
27
26
36
2009
15
11
7
29
27
35
Average
14
13
10
26
28
32
Source: Calculated using PricewaterhouseCoopers and National Venture Capital Association, MoneyTreeTM Report, available at: https://www.pwcmoneytree.com/MTPublic/ns/nav.jsp?page=search and annual population estimates of the United States Bureau of the Census.
The Impact of the Wisconsin Credits Angel investment and early stage seed investment credits. Looking at the pattern of venture capital financing in the Wisconsin MTR data and comparing it with the Minnesota data, it is difficult to see much effect for Wisconsin’s enactment of its angel and early stage seed investment credits. The five-year period (2005 – 2009) after the credits became effective (July 1, 2004) shows a modest decrease (13.0%) in these financings, relative to the five-year period before (1999 – 2003), when the amounts are stated in constant dollars.12 By contrast, early stage financing in Wisconsin saw a larger drop (30.0%). The numbers are shown in Table 3. 12
2004 was excluded from both periods, since the angel credit became effective midyear and it is unclear whether to allocate its incentive to any of the financing. The MTR data for 2004 showed no startup/seed stage financing at all and $20.3 million in early stage financings in Wisconsin. The latter were about evenly divided between two financings of $11.3 million in the first quarter and one financing of $8.5 million in the fourth quarter.
Presentation to the House Committee on Taxes House Research Department
February 9, 2010 Page 10
Table 3
Wisconsin and Minnesota Startup/Seed and Early Stage Financing Five-year Periods Before and After Enactment of Wisconsin Angel Credit Amounts in 2009 $ Period 1999– 2003 2005 – 2009* % change % change, excluding 2000*
Startup/Seed Early Wisconsin $16,702,000 $139,750,000 14,532,000 97,766,055 -13.0% -30.0% 96.4%
-9.8%
Minnesota 138,517,000 694,393,000 116,140,117 285,551,336 -16.2% -58.9%
1999– 2003 2005 – 2009 % change % change, 73.8% excluding 1999* *compared to average annual amount
-57.1%
Total $156,452,000 112,298,421 -28.2% -3.0%
832,910,000 401,691,453 -51.8% -45.1%
The 1999 to 2003 period may be distorted by its inclusion of 1999 and/or 2000. (1999 was a very high year for venture capital financing of all types at the height of the bubble in technology stocks in Minnesota but not in Wisconsin. By contrast, 2000 was a very high year in Wisconsin, but not in Minnesota.) If 2000 is excluded, the amount of seed and early stage financing is appreciably higher in the period after enactment of the two Wisconsin credits. The rates of change are shown in Table 3. Comparing the entire pre- and post-credit periods, Wisconsin experienced about a 23 percent increase in the gross annual amount of startup/seed financings (not shown in Table 3). During this same period Minnesota experienced a modestly larger decline (16.2 percent) in startup/seed stage venture capital financing and in early stage financing (58.9 percent). The deviations in the trends of financing for the two states (smaller relative declines for Wisconsin) may lend some support to the notion that the angel credit had a positive effect on the level of these financings in Wisconsin. The Wisconsin credits, however, come at a cost. (Wisconsin taxpayers are essentially paying for a portion of venture capital financing in the state, while Minnesota taxpayers are not bearing a similar cost.) If one deducts the value of the two credits claimed from the net amount of Wisconsin financings, the gap between Minnesota’s and
The angel credit became effective July 1, 2004, and, thus, positively affected at most only one of these financings. It is interesting that the two financings in the first quarter of 2004 were not delayed to take advantage of the credit that was enacted in 2003 and would become effective in the summer. Other unknown factors may have disqualified these deals from qualifying for the credit, of course.
Presentation to the House Committee on Taxes House Research Department
February 9, 2010 Page 11
Wisconsin’s rate of change narrows. Wisconsin’s decline in both categories drops from a -28.2 percent to a -43.1 percent decline (compared to Minnesota’s -51.8 percent). Does this experience support enacting Minnesota angel credit incentives? It’s not clear whether Wisconsin’s experience justifies experimenting with Minnesota angel investment incentives. In particular, several factors are worth considering: The amount of data is very limited. This is a very short period of time and the experience is based on only a handful of financings in Wisconsin – 11 in the startup/seed category, if that is the relevant category or 39, if the relevant categories are a combination of startup/seed and early stage financings. It may be risky to extrapolate from such limited experience and from such small differences. The amount of data is insufficient to empirically test the extent to which the credits have changed investor behavior, their fundamental purpose.13 The Minnesota’s much larger venture capital market suggests a larger credit authorization or expenditure will be needed. Minnesota’s venture capita financing market is much larger than Wisconsin’s. This suggests that a much larger credit authorization would be necessary to have a similar (proportional) effect, if the Wisconsin credit is responsible for its better relative performance. Depending upon the relevant category or time period, Minnesota’s market is three to eight times larger than Wisconsin’s. This may suggest that an allocation of credits several times larger than Wisconsin’s could be required to have an equivalent effect in Minnesota. Inevitably, these tax credits have a displacement effect. In addition to providing an incentive for new activity (i.e., activity that wouldn’t have occurred without the credit), the credits also provide benefits to investors who would have invested without the incentive.14 Some investors will allow the credit to substitute for some of their own money; that is, they’ll put up the same amount of money they otherwise would have and pocket the resulting tax savings. If a small allocation of the credits is provided, it is possible that much (or perhaps all) of the credits will be used by these investors, thwarting the intended incentive effects.
13
We are aware of no empirical studies that have done this for angel investment credits in other states for that matter. An Issue Brief by the National Governors Association states, “[T]he economic benefits of the investment credit to states are unknown because of the lack of data and the difficulty of measuring economic impacts.” NGA Center for Best Practices Issue Brief, State Strategies to Promote Angel Investment for Economic Growth, p. 9 (February 14, 2008), available at: http://www.nga.org/Files/pdf/0802ANGELINVESTMENT.PDF. 14
There is no practical way to design an incentive (whether a credit or grant) to avoid this effect. To provide an incentive to investors who would not have otherwise have invested, incentives will also be given to those who would have invested without the incentive. This is so, because it is impossible to objectively (even on a case-bycase basis, much less in a set of statutory criteria) determine what an investor would do absent the incentive. Moreover, it probably would violate many people’s sense of fairness to do this, even if it were possible: why should one investor get a publicly funded benefit, when another investor who makes exactly the same investment does not? This state of affairs raises the costs (or reduces the benefits) of any investment incentive whose principal purpose is to change behavior.
Presentation to the House Committee on Taxes House Research Department
February 9, 2010 Page 12
In essence, the dollar caps could prevent the credit from being a marginal incentive for more investment, if already committed investors use up the entitlements. Table 4 shows Wisconsin’s tax expenditures for its credits and the size of its venture capital market. As can be seen, the Wisconsin credits make up a large share of the Wisconsin venture capital market.
Table 4
Annual Average Venture Capital Financing in Wisconsin, 1995 - 2009 Amounts in millions of 2009 dollars Annual Average Startup/Seed stage Early stage Total both stages Wisconsin $2.5 $21.4 $24.0 Wisconsin Angel and Early Stage Seed Credits* Angel Early Stage Seed Both credits Average cap amount 4.1 4.6 8.7 Average amount 2.7 2.0 4.7 used Average combined credits used as a % of average annual financing by stage: 1995 – 2004 (pre2005 – 2009 credit) (post-credit) Startup/Seed 198% 160% Early 20% 20% Both stages 18% 18% Source on cap and usage of Wisconsin credits is from Wisconsin Dept. of Revenue; other data is from MTR. The amount of Wisconsin’s credits used relative to the financings loom large, if one compares them simply to the startup/seed stage investment. Over the period the credits were in effect, they were more than one and a half times (160 percent) the amount of reported startup/seed early stage financing during the period. Since the credit rate is 25 percent, these estimates imply that all of these startup/seed investments qualified for the credit (since $8.5 million of credits requires about $34 million of financing, given the 25 percent credit rate). At least two explanations can be suggested for this. First, as discussed in Appendix B, the MTR data likely does not fully reflect all angel investment. Second, the credit parameters do not restrict or target the credit to MTR’s definition of startup/seed financings, but also allow use for some early stage companies.15 As a result, 15
MTR definitions (cited above) define startup/seed and early stage companies based whether the product is being sold commercially. The Wisconsin angel and early stage seed investment tax credits require that qualifying companies be “undertaking pre-commercialization activity.” Wis. Stat. § 560.205(1)(f)2. Companies in any of the MTR phases could meet this, if they are undertaking this for some products, even if they’re commercially selling other products. Thus, it is difficult to know if the Wisconsin credits are being used for some later stage financings, by MTR’s criteria. The proposed Minnesota credits, by contrast, uniformly do not include a “pre-
Presentation to the House Committee on Taxes House Research Department
February 9, 2010 Page 13
some of early, expansion or even later stage financing likely qualified for the credit. The data do suggest that a substantial portion of the first two stages of financings qualified for the two credits. Table 5 provides similar data for Minnesota. In contrast to Wisconsin, the bottom rows of Table 5 show that the Minnesota incentive proposals would provide a much smaller aggregate incentive relative to the size of the Minnesota venture capital market (ranging from 38 percent to 4 percent). This raises a serious risk that angel investor incentives in Minnesota would reward mainly (possibly, exclusively) investors who would have invested anyway. Since Wisconsin’s credits are much more generous relative to the size of its venture capital market, the risk that Wisconsin credits will reward mainly or only investments that would have occurred absent the credits is lower.
Table 5
Annual Average Venture Capital Financing in Minnesota 1995 - 2009 Amounts in millions of 2009 dollars Annual Average Startup/Seed stage Early stage Total both stages Minnesota $26.2 $84.8 $111.0 Minnesota Angel Incentive Proposals – Annual Caps Annual Credit % of annual avg % of annual avg Bill Cap startup/seed stage early stage H.F. 799, 1136, 3 11% 4% 1194 H.F. 2323 (4th 10 38% 12% engross); 2480 Source on cap and usage of Wisconsin credits is from Wisconsin Dept. of Revenue; other data is from MTR.
CAPCO credit. The period after enactment of the CAPCO credit shows a significant (over 54 percent) increase in expansion and later stage venture capital financing16 in Wisconsin (again stated in constant dollars), compared with the period before the CAPCO credit was available. However, the “after” period includes the 2000 surge in venture capital financings. If 2000 is dropped, the increase in post-CAPCO credit financings drops to 28 percent. Consistent with the notion that CAPCO mainly affects later stage financing, nearly all of this difference appears in those financings with the average amount of expansion stage financings actually dropping in the after-CAPCO period. But discounting the potential that the CAPCO credit was responsible for commercialization” requirement, unlike the Wisconsin credits. Rather, they simply tie the availability of the credit to the size of the business, its line of business, and its age. 16
It is generally thought that the CAPCO mainly affects expansion and later stage venture capital financings, since CAPCO investors generally hope the companies establish themselves within three or so years. This is dictated by the CAPCO credit structure, which requires some of the investments to be “recycled” within a five- to sevenyear time frame to qualify for the full benefits of the credit.
Presentation to the House Committee on Taxes House Research Department
February 9, 2010 Page 14
this increase is the fact that Minnesota (which had no credit) saw similar, but even more extreme, trends over the same time period with increases over 87 percent (59 percent excluding the outlier 2000 data). This may suggest that the Wisconsin CAPCO credit had little or no effect, likely displacing venture capital financing that would have otherwise occurred. Again, other explanations based on local factors are possible. Conclusion. The Wisconsin experience with its venture capital credits is ambiguous. In the case of the angel and early stage seed investment credit, the amount of startup/seed and early stage venture capital financings declined in the period after the credits were put into place. However, these declines were proportionately smaller than similar declines experienced by Minnesota in the same time period. It is possible that Wisconsin’s superior relative performance was attributable, in part, to its credits. However, it is also possible (if the focus is primarily on the startup/seed stage) that the difference in the trend between the two states was simply the amount of money that Wisconsin allocated to subsidize these financings and little stimulus of additional private financing occurred. Moreover, as noted in the first section, Minnesota consistently has larger per capita (and absolute) levels of startup/seed and early stage venture capital financings than Wisconsin, despite Wisconsin’s subsidizing of these types of financings through the credits. By contrast, later stage venture capital financings in Wisconsin grew significantly in the period after the CAPCO credit was put into effect. However, similar financings in Minnesota – which has no credit – grew even faster than Wisconsin’s over this period. Perhaps the best one can say is that based on the MTR data, the results of Wisconsin’s investment in tax subsidies in venture capital are inconclusive. Finally, Minnesota’s high level of venture capital compared with Wisconsin’s is a paradox of sorts. Why does Minnesota do so much better, despite Wisconsin’s aggressive use of tax incentives, both on the front end (its credits) and the back end (its capital gain exclusion)? It is impossible to answer this with any certainty, but several factors may be relevant. The obvious answer is that the tax incentives simply are not effective enough to overcome other advantages that Minnesota possesses over Wisconsin. Two possibilities for these natural advantages could be: For a state to have high levels of venture capital financing it needs both (1) startup businesses with goods ideas and business plans to finance and (2) capital either from inside or outside the state. Minnesota's higher level of financing may be explained by having more viable ventures to fund. Alternatively, Minnesota may have more local capital than Wisconsin that is willing to finance its ventures and this advantage may more than overcomes Wisconsin's tax incentives, which have largely been limited so far to instate capital. Capital is very mobile and easily flows across borders and between types of investments. As rates of return change, some investors will change their asset allocations, shifting from one type of investment to another. These two factors make it hard for a state to successfully increase the amount of capital in the state in one narrow category of investment. Increasing the rate of return on in-state investments through incentives
Presentation to the House Committee on Taxes House Research Department
February 9, 2010 Page 15
(especially if the incentives are more attractive to in-state investors) could cause local capital to substitute for out-of-state capital. In general, the high mobility of capital (as compared to human capital – i.e., resident business people – which tends to be “stickier”) allows market forces to thwart the desired effects of tax or other capital incentives offered by the government.
Advantages and Disadvantages of Using Tax Credits v. Grants to Provide Angel Investor Incentives Most states with angel investment incentives and nearly all of the proposals in Minnesota have used tax credits as the preferred form of incentive. However, financially equivalent incentives can be provided as grants.17 The policy goal of the tax credits is to increase the amount of early-stage equity investments in emerging in-state companies. By providing investors with tax credits equal to a percentage of their investments, the credits reduce the effective cost of their investments. The expectation is that qualifying investments will increase. Essentially, the credit creates a “sale” on shares of the qualifying companies, allowing an investor to buy a share of the corporation at a discount. Incentives can also be delivered – either to investors or to the companies they invest in – directly through a matching grant program. Obviously, the state would like to provide angel investment incentives in the least costly and most effective way; that is, it wants to get the most “bang for its buck.” This section of the report describes in general terms the tax credit proposals and the one grant proposal and discusses the relative advantages and disadvantages of the two different approaches. Multiple legislative proposals have been made for angel investment credits in Minnesota in the last few legislative sessions. During the 2009 – 2010 session, several bills were introduced proposing credits. See H.F. 799 (Davnie); H.F. 1194 (Downey)/H.F. 2695 (Lenczewski) (governor’s proposal); H.F. 2323 (Lenczewski) (the 4th engrossment) (vetoed); and H.F. 2750 (Davnie). One bill, H.F. 2580 (Lenczewski), provides an angel investor matching grant.
Description of tax credit approach The Minnesota angel investment tax credit proposals differ in some details (which businesses qualify, whether investments can be made through funds, and so forth), but all follow a very similar pattern. Under these proposals, angel investors seeking to invest in emerging companies would apply to the Minnesota Department of Employment and Economic Development (DEED) 17
The National Governors’ Association lists 18 states with angel investment credits. NGA Center for Best Practices Issue Brief, State Strategies to Promote Angel Investment for Economic Growth, p. 9 (February 14, 2008), available at: http://www.nga.org/Files/pdf/0802ANGELINVESTMENT.PDF. The report mentions the possibilities of direct spending incentives and reports that Kentucky is directly making investments, but does not discuss any state that is providing matching grants.
Presentation to the House Committee on Taxes House Research Department
February 9, 2010 Page 16
to be certified as qualifying for provisional tax credits.18 To limit the state cost of the credit to the fixed dollar amount per year specified in the bills, this certification entitles a certified investor to a set dollar amount of credit and the sum of the certifications cannot exceed the annual limit. Under all of the credit proposals, these certifications are awarded on a first-comefirst-served basis to qualified applicants. When the dollar amount for a fiscal year is reached, no more certifications would be issued; disappointed applicants would need to apply again the next year. The certified investor would, then, invest in businesses that meet qualification criteria set out in the tax credit bills19. When investors make qualifying angel investments, their credit certificates would entitle them to Minnesota state tax credits. They would use this to reduce their Minnesota individual income tax liability. The proposals typically include maximum credit limits of $50,000 to $125,000 per investor. The credits are not refundable, so they cannot exceed the investor’s tax liability. Description of the matching grant approach Under the grant proposal in H.F. 2580, businesses seeking angel investors would apply to DEED for certification (in contrast to investors applying under the tax credit bills20). H.F. 2580 directs DEED to certify all qualifying businesses and to provide them with provisional certificates for a dollar amount of grants. This will, then, enable these businesses to seek angel investors to qualify for the grants. Because the amount of provisional certifications that DEED can grant is not limited, this will allow any business that meets the qualifying criteria and seeks angel investments to become certified to seek investors in the private market. When a business finds qualified angel investors, it will receive a grant from DEED upon verifying this to DEED. If available funding for the fiscal year has been used up, the business will receive priority for funding in the next fiscal year based on when DEED verified they received their angel investment. DEED would be required to post information on its website on the available funding and amounts of provisional certifications, so both potential investors and the certified businesses will have information as to the availability of funding. DEED will not pick who gets grants; in effect, private investors will do this by agreeing to invest in the companies.
18
Unlike most of the Minnesota tax credit proposals, under the Wisconsin tax credit, the Department of Commerce certifies qualifying businesses (not investors). Wis. Stat. § 560.205. Investors, then, can receive the credit when they make angel investments in these certified businesses. H.F. 2580’s grant proposal more closely mirrors the Wisconsin mechanism, than do the Minnesota tax credit bills. H.F. 2750 requires certification of investors, investment funds, and qualified businesses. H.F. 1194 (Downey/Governor)/H.F. 2695 (Lenczewski) also provide for separate certification of pooled investment funds, with separate aggregate credit maximums provided for investments made by individuals and by pooled funds. This doesn’t change the basic mechanics, but creates two separate pools with slightly different rules operating. This is somewhat analogous to the Wisconsin early stage seed investment credit that provides an incentive for investing in funds. 19
H.F. 2750 (Davnie) requires investors to make investments in qualifying businesses within 60 days of receiving certification from DEED. 20
Unlike the other tax credit bills, H.F. 2750 requires both qualifying businesses and investors to receive certification before credits are awarded.
Presentation to the House Committee on Taxes House Research Department
February 9, 2010 Page 17
Discussion of advantages and disadvantages of credits versus grants The remainder of this report contrasts the relative advantages and disadvantages of the tax credit versus the matching grant approach on the following dimensions, focusing on the parameters of the specific proposals that have been introduced in the 2009 – 2010 legislative session. In doing so, it discusses the following issues: Federal tax treatment of credits versus grants Attracting out-of-state investors Ease of marketing to investors Selecting recipients of incentives (“picking winners and losers”) Public data availability on investors and businesses Permanence of the incentives Treatment as “spending” for state financial reporting purposes
Federal Tax Treatment: Tax credits are subject to an implicit federal tax, while matching grants, properly structured, can delay or avoid much of the adverse effects of federal taxation. Tax credit. Because a tax credit delivers its incentive directly to high-income investors21 as state tax reductions, in most cases an implicit federal income tax applies. This results because the federal tax allows an itemized deduction for state income taxes and nearly all high-income investors will be itemizers.22 Reducing state income tax, as the credits do, also reduces the itemized deduction, increases federal taxable income, and increases federal tax. For a taxpayer in the top federal income tax bracket of 35 percent,23 a $50,000 state income tax credit increases federal tax by $17,500 ($50,000 * 0.35 = $17,500). The net incentive provided to the investor is not $50,000, but $32,500. This structure, thus, results in a substantial dilution of the value of the state incentive provided to the investor. Although state revenues drop by $50,000, the investor realizes only a benefit of $32,500 after both state and federal taxes are taken into account. The remaining $17,500 is “exported” to the federal government in increased federal income tax liability. Matching grant. By contrast, paying the grant to the start-up business avoids the implicit federal tax, but provides an equivalent benefit to the investor. The grant would be revenue and 21
Under the proposals and as practical matter, these investors must be accredited investors under SEC regulation D, which essentially means that they are high-income or high-net-worth investors. 22
Taxpayers who are subject to the federal alternative minimum tax (AMT) will be unaffected by this. However, in some cases, claiming the angel investment credit could cause some taxpayers to shift off the AMT, since claiming a high itemized deduction for state and local taxes is a prime reason many taxpayers are subject to the AMT. 23
It’s probably safe to assume that many, if not most, angel investors will be in the top federal bracket. For example, to qualify under Regulation D, a married couple must have either annual income of $300,000 or more or net financial assets of $1,000,000.
Presentation to the House Committee on Taxes House Research Department
February 9, 2010 Page 18
income to the business and, thus, could be subject to federal tax. But these emerging companies are almost always in their “nonrevenue phase” – that is, they’re not yet selling their products and making profits. As a result, the income from the grant will be offset by losses (salaries paid to employees, rent, supply costs, and so forth). Thus, no federal tax would be paid. But if the money is given to the business, how does the investor benefit? Angel investors buy stock (or other equity investments) that provide them a percentage ownership interest in the startup business. Since the matching grant increases the value of the business, their stock or other equity ownership interest, which is simply a fractional ownership interest in the business, becomes more valuable. In soliciting angel investors, qualifying business can make this effect clear: When we attract total angel investment of $100,000, the state will give us $33,333, which will make your investment (a percentage of the business) more valuable. Because the implicit tax on the state tax credit is avoided, the real economic benefit to the business and to the angel investors will be larger than a tax credit that costs the state the same amount. (Or the state could use a grant to provide the same value incentive as a tax credit, but at lower cost.) If the company is ultimately successful, the investors will pay tax on the grant, but it will be much later and at favorable capital gains rates when they sell their stock.24 These concepts are illustrated in more detail through an example in Appendix A on page 25. Out-of-state Investors: Matching grants are more efficient in attracting out-of-state investors. Tax credits. Tax credits do not provide an incentive to most out-of-state investors.25 Since nonresidents usually don’t pay Minnesota tax, they’re indifferent to the offer of a Minnesota tax credit. The Wisconsin angel investor tax credit was recently modified to address this limitation: investors in qualifying Wisconsin companies now can sell or transfer their credits to others who can use them.26 (H.F. 2750 allows some limited authority to transfer the credit as well, but the scope of this transfer authority is somewhat unclear.) Thus, an out-of-state investor can transfer the credit to a Wisconsin taxpayer, who does not want to make an angel investment but who pays enough Wisconsin tax to use the credit. But it is likely that this ability to sell or transfer the credit will come at a price – that is, brokers will charge fees to find Wisconsin taxpayers who are willing to buy the credits and buyers also will not pay 100 cents on the dollar for tax credits. It is unclear how large this fee and discount will be, but a reasonable guess is that it could be 10 percent or more of the credit.27 These costs reduce how much of the state’s money actually gets used to encourage investment. 24
Under the federal income tax, long term capital gains are typically taxed at a 15 percent maximum rate when realized, while ordinary income is taxed at a maximum rate of 35 percent. 25
The same is true of tax exempt investors, such as pension funds and foundations. However, these types of investors rarely make angel investments, according to industry sources. 26
Wis. Stat. § 71.07(5d)(c)3m (allowing partners and LLCs to allocate the credit “as specially allocated in their organizational documents”). 27
Experience with the sale of other types of tax credits in other states often results in larger discounts. These sales have typically involved housing and historic preservation credits that apply over multiple years. Thus, part of the discount is likely attributable to time value of money effects and to uncertainty as to the purchaser’s future state
Presentation to the House Committee on Taxes House Research Department
February 9, 2010 Page 19
Matching grant. Since angel investments by nonresidents with no Minnesota liability would qualify an eligible business for a matching grant, the matching grant approach should provide equal incentives to nonresidents and residents, enlarging the pool of potential investors. Compared with making the tax credit transferable, this eliminates the need to pay brokers and lawyers to find in-state buyers for the credits and to set up a legal structure that allocates the credits to them. Ease of Marketing to Potential Investors: Tax credits likely are easier to market to potential investors. Tax credits. Given the ubiquitousness of tax credits, including angel investment credits, and the popular understanding of how tax credits work, it may be easier to describe and sell investments to angel investors based on the availability of a tax credit than a grant. In addition, some proponents of the tax credit have contended that tax advisors also function as investment advisors and naturally gravitate toward investments that yield immediate tax benefits, such as the credit. If this hypothesis is valid, it could favor the tax credit approach.28 Matching grants. Although the matching grant approach is more tax advantageous, it requires telling a longer, more complicated, and less familiar story than “you’ll get a state tax credit of $X, if you make this investment.” Selecting Recipients (“Picking Winners”): Both approaches use roughly equivalent rules. Opponents of the matching grant approach often criticize grants as requiring the state to “pick winners,” which in their view state employees are not skilled at doing (probably a correct observation). However, grants can be structured – as H.F. 2580 is – to use selection criteria that function identically to the financing mechanism in tax credit proposals. Since both the tax credit bills and the matching grant bill contain annual fiscal limits, some mechanism needs to be provided to allocate these limits. All of the bills use a first-come-first-served approach. Thus, it seems fair to say that neither approach attempts to “pick winners and losers.” However, the tax credit bills allocate the credit entitlements to the angel investors who apply first. H.F. 2580 (the matching grant bill), by contrast, allocates the grants to businesses that successfully close on
tax status. The Wisconsin model allowing transfer of its angel investment credit appears to impose some legal costs too, since the LLC or partnership documents must specially allocate the credits to their outside purchasers/investors. In effect, they must become members of the LLC or limited partners to “buy” the credits. Lawyers will need to be paid to review and write or rewrite these documents. This is not as simple as buying publicly traded stocks or bonds. 28
Several of the tax credit proposals impose three-year holding periods before allowing the credit to be claimed. See, e.g., H.F. 799 and 1136. This will dilute the value of the credit to an investor for two reasons. First, the time value of money - i.e., the three-year delay before realizing the benefits - will require the investor to discount the nominal amount of the credit based on his or her assumed rate of return. Second, the delay increases the dual risk that either the taxpayer will be unable to use the credit (because of a change in state tax status) or because the state changes the terms of or repeals the credit. If payment of the grant were similarly deferred, the same discount factors and risks would apply, so this is a feature of the terms of the credit and not an inherent disadvantage of the credit mechanism.
Presentation to the House Committee on Taxes House Research Department
February 9, 2010 Page 20
their angel investment financing first. Thus, the grant bill is a race to find and close on the financing, while the credit approach is a race to apply to DEED. Public data availability: The grant approach makes the identity of the companies seeking and receiving grants public, while most of the credit bills make the identity of investors receiving the credit and the credit amounts nonpublic. Under Minnesota’s government data practices act (GDPA), information collected by state government is presumptively available to the public. However, most tax information on individual taxpayers is not available to the public. As a result, unless the bills provide otherwise one would expect that most information related to tax credits would not be open to public inspection, while information on matching grants would be. Specific provisions of H.F. 2580, however, change these results somewhat. Tax credits. Under the tax credit bills, potential angel investors (either individuals or funds in the case of H.F. 1194) apply to DEED for certification. H.F. 2750 also requires businesses seeking investments to be certified as meeting the criteria for qualifying businesses. The information supplied to DEED would be public information.29 The bills grant DEED discretion in determining what information to require, but at a minimum the identity of the certified investors and investment funds, and in the case of H.F. 2750, the identity of the qualifying business, would be known.30 However, all other data (e.g., the company invested in, the amount of the investment, and so forth) would likely be tax return data that is not available to the public.31 Alone among the tax credit bills, H.F. 2750 will make both the identity of investors and the companies public information, as well as some additional information provided through annual reporting required of investors, funds, and businesses. Matching grants. Under the matching grant bill (H.F. 2580), a qualifying business applies for certification and, then, provides verification to DEED that it received a qualifying angel investment to receive its grant. Under normal GDPA rules, all of this information would be open to public inspection. However, H.F. 2580 explicitly provides that GDPA rules do not apply and that DEED is to treat information collected in administering the grant program in the same manner as tax return information. H.F. 2580 § 1, subd. 7. The following information would be available to the public: “information related to provisional certification of a qualified business venture, including the name, address, and amount of the provisional grant certification.” Information on the actual grant amounts awarded to each business would also be available so the public, provisionally certified businesses, and angel investors can monitor the availability of funding for additional grants. 29
Minn. Stat. § 13.03 is the relevant provision of the GDPA.
30
Under H.F. 1194’s provisions, for example, it’s unclear whether DEED would require funds to list their individual investors or how much other information about investors would be required under either H.F. 1194 or H.F. 799. One would assume that DEED, at minimum, would require funds to reveal the identity of their individual investors to make sure that the bill’s requirement that they all be Regulation D investors and that investors were not using the fund structure to avoid the bill’s prohibition on company insiders qualifying for the angel credit are satisfied. But the bill does not require this. 31
Minn. Stat. § 270B.02.
Presentation to the House Committee on Taxes House Research Department
February 9, 2010 Page 21
Permanence of the incentives: Tax credits without sunsets are likely to be more permanent than grants that require legislative re-appropriation each biennium. Proponents of programs often prefer tax expenditures, as compared with funding through direct appropriations, because tax expenditures are perceived to be permanent features of the tax code that endure and often receive little ongoing budget scrutiny from the legislature. For example, the legislature rarely reviews or considers whether to modify the deduction for mortgage interest, the credit for long term care insurance, the exemption for municipal bond interest, and so forth. Proponents of new tax expenditures hope their proposed credits, deductions, and exclusions will be treated similarly. By contrast, typical direct spending programs are subject to biennial appropriations and must compete with other priorities during the usual budgeting process. Typical tax expenditures have inertia on their side (legislative inaction allows them to continue), as compared with direct spending programs, which typically require positive legislative action for them to continue. Whether the respective characteristics of a permanent tax expenditure versus a spending program subject to biennial appropriations is an advantage or disadvantage will depend on the perspective of the observer. One who favors more accountability through regular budget scrutiny will perceive a direct spending program as more advantageous, while one who considers reliable and permanent funding for angel investment incentives to be more important (and who may not want to run the gauntlet of budget review) may view the greater permanence of tax expenditures as advantageous. The 2009 – 2010 tax credit proposals and the direct grant proposal vary somewhat in specifying their funding limits and whether these authorizations or limits are permanent. All of the proposals put annual dollar limits on the amount of credit certificates that may be issued during the current and next bienniums. The grant proposal would clearly require reauthorization (in the 2013 legislative session). Two tax credit bills are explicitly permanent, while the other two are silent on the dollar amount of authority that may be issued beyond fiscal year 2013. It may be that they are intended to allow an unlimited amount of authorizations or that the legislature would reauthorize specific dollar amounts. The provisions are summarized in Table 6.
Bill H.F. 799
Table 6 Dollar Authorizations of Angel Incentive Certificates FY 2010 FY 2011 FY 2012 FY 2013 $6 million
$6 million
$3 million
Ongoing $6 million per biennium Not specified
$10 million
Not specified
$15 million $12 million
No authority $12 million/year
$6 million
H.F. 1194 $3 million $3 million $3 million H.F. 2323 $10 million $10 million $10 million (4th engross) H.F. 2580 0 $11 million $14 million H.F. 2750* $10 million $10 million $12 million *These amounts are for tax years, not fiscal years.
Presentation to the House Committee on Taxes House Research Department
February 9, 2010 Page 22
If the legislature wishes to make a grant program permanent, it could be funded with an ongoing, standing appropriation. These types of appropriations are rare, but do exist. For example, a standing annual appropriation of $750,000 for the Target Center was in place from 1994 through 2008.32 Moreover, there is no guarantee that tax expenditures are more permanent than direct spending.33 As a final note on permanence, the two approaches would be treated differently under the unallotment law. The unallotment law directs the Commissioner of Management and Budget to reduce allotments of appropriations to eliminate deficits that result from revenues being lower than anticipated.34 This authority does not extend to tax expenditures. Thus, a grant program appropriation could be unallotted to make up for shortfalls, while a tax credit could not.35 Treatment as “spending” for financial reporting purposes: Tax credits do not count as state “spending” for financial reporting purposes, while grants do. Tax expenditures, because they reduce revenues collected by the state, do not appear on state financial reports as “spending.” By contrast, grants will be reported and counted as spending. This affects reporting of the total dollar amount of state and local spending in Minnesota, tax rankings based on those numbers, and so forth. Most public finance economists would contend that both provisions have equivalent effects in distorting private market decisions – that is, they both reduce the price of angel investments and raise the tax rates that other taxpayers must pay to finance the same level of other government services. The numbers involved are so small that the effects of one provision are likely inconsequential. However, the cumulative effects of many tax expenditures create distortions that are not measured by the typical tax rankings based on U.S. Census Bureau tax collection data. Table 7 summarizes the treatment of angel investment incentives under the tax credit versus grant proposals.
32
Minn. Stat. § 240A.08 (2006), enacted by 1994 Minn. Laws ch. 648, art. 1 § 17, repealed by 2009 Minn. Laws ch. 101, art. 2 § 110. 33
Minnesota’s one experience with a tax credit for venture capital investments in the 1980s resulted in early repeal of the credit. In 1983, the legislature enacted an equity investment credit under the corporate franchise and individual income tax. 1983 Minn. Laws 2298 – 2302, ch. 342, art. 8 § 13. The 1983 legislation provided the credit expired effective for tax year 1986. The 1985 legislature extended the credit through tax year 1988. 1985 Minn. Laws 2331, 1st spec. sess. ch. 14, art. 1 § 6. However, the 1987 legislature repealed the credit, effective for tax year 1986, or one year earlier than its scheduled expiration. 1987 Minn. Laws 1156-57, ch. 268, art. 1 §§ 127 and 129. 34 35
Minn. Stat. § 16A.152, subd. 4.
If the credit were a refundable credit, the portion of the credit that represents refunds above tax liability may be subject to unallotment.
Presentation to the House Committee on Taxes House Research Department
February 9, 2010 Page 23
Table 7 Comparison of Angel Investment Credits and Matching Investment Grants Feature State Tax Credit Matching Investment Grant H.F. 799, H.F. 1194/H.F. 2695, H.F. 2580 H.F. 2323, H.F. 2750 Small Minnesota businesses in Same Definition of qualifying designated sectors businesses Individuals qualifying under SEC Same Definition of qualifying Regulation D investors Qualifying investors apply to Qualifying businesses apply to Application process DEED for certification for DEED for provisional grant provisional tax credit certificates. certificates. Credits are allocated to applicant Allocated on a first-come-firstMethod of allocating investors on a first-come-firstserved basis. All applicant money to individual served basis until available businesses can get provisional grant investors money for the fiscal year is certificates. Award of grants is exhausted. dependent upon the business attracting angel investors to make $100,000 investments, which will entitle them to a grant equal to 30% of the angel investment. No provision; investors must Business maintains its position in Treatment of applicants reapply for certification in the line for funding available in the next when funding limits for next year. fiscal year. fiscal year are reached Business does not receive the Business directly receives the grant Effect on qualifying credit, but its availability is when it attracts the required angel business assumed to enable the business to investments. The grant is assumed attract a larger amount of angel (as is the case with the credit) to investments, because the tax allow the business to attract more credits lowers the investors’ net angel investments, because an cost of their investment – i.e., investor’s money will buy a more they can buy the same share of valuable company because its assets the business at a lower cost include the state grant. because the credit reduces their Minnesota tax. None Grant is taxable income to business, Federal tax effect on but this does not create immediate business tax liability to the corporation because the business is in its loss phase. Carryover losses are reduced, potentially generating tax liability in a future tax year. Reduces cost of investment by Increases the value of the shares Effect on angel investor allowing a state tax credit equal to purchased by the value of the state who is a Minnesota a percentage of the investment. matching grant. taxpayer
Presentation to the House Committee on Taxes House Research Department
February 9, 2010 Page 24
Table 7 Comparison of Angel Investment Credits and Matching Investment Grants Feature State Tax Credit Matching Investment Grant H.F. 799, H.F. 1194/H.F. 2695, H.F. 2580 H.F. 2323, H.F. 2750 No effect until stock is sold and, Federal income tax effect If investor is an itemizer, the credit will reduce the itemized then, only to the extent that the on angel investor who is deduction for state income taxes, matching grant increased the Minnesota taxpayer raising federal tax by the federal ultimate value of the corporate stock. marginal tax rate multiplied by Long term capital gains tax rates are the state credit. For a top bracket lower than those on ordinary income taxpayer, this reduces the value of (15% top rate versus 35% under the state credit by 35%. current law). The time value of money further reduces the real cost For nonitemizers and for of this tax liability. taxpayers subject to the federal AMT (after taking the state tax credit into account), there is no effect. None; tax credit provides no Increase the value of the shares Effect on angel investor incentive to make investments in purchased by the value of the state who is not a Minnesota Minnesota companies. H.F. 2750 matching grant – same effect as for taxpayer (e.g., a allows transfer of the credit, but an investor who is subject to nonresident individual) it’s unclear if this would apply to Minnesota tax. nonresidents. Identity of investors available to Identity of businesses receiving Public data availability public. H.F. 2750 also makes grants and grant amounts available to identity of business and some public additional information public. H.F. 799 provides permanent Additional legislative appropriations Ongoing funding biennial funding of $6 million; would be required after FY 2013 to H.F. 1194 and 2323 do not provide ongoing legislative funding. specify dollar limits beyond FY 2013. H.F. 2750 provides $12 million per year in ongoing funding. Since the grant is funded with a Effect of an unallotment None; as a tax expenditure, the tax credit dollar authorization direct appropriation, it would be would not be subject to subject to unallotment to offset unallotment to offset an revenue reductions that unbalance unanticipated reduction in state the state budget. The authorizing revenues. legislation could exempt the appropriation from unallotment.
Presentation to the House Committee on Taxes House Research Department
February 9, 2010 Page 25
Appendix A An Example Comparing the Federal Tax Effects of a Tax Credit and Grant Assume Emerging Biotech Business (EBB) seeks to raise $2 million in angel investments from investors who are each willing to invest $100,000 in those types of companies. Assume that EBB’s angel investors qualify for a 25% Minnesota angel investment credit. EBB can approach potential investors and represent to them that if they make a $119,400 investment, their after-tax cost of the investment will only be $100,000.36 This will allow EBB to raise its $2,000,000 by attracting only 17 investors ($119,400 * 16.75 = $2,000,000 in angel investments), rather than the 20 that would be required without the credit. 37 The reduction in state tax revenues that result from the credit is $500,000 (i.e., $29,850 * 16.75 = $500,000). By contrast, assume EBB instead qualifies for a 33.3% matching angel investment grant (e.g., similar to that under H.F. 2580). When EBB approaches investors it tells them that their investment will increase its assets/revenues because the state will provide a 33.3% grant (similar to charities that entice contributors by representing that their contributions will generate matching grants). By appropriately setting the equity shares of the company, the angel investors can directly benefit from the matching grant by owning a more valuable share of EBB, even though the grant goes to EBB. In this case, EBB needs to attract only 15 investors who are willing to invest $100,000 each (as compared with 17 under the tax credit). This raises $1.5 million. The 33% matching grant generates $500,000 ($1,500,000 * 0.333 = $500,000), yielding the $2,000,000. The state cost of $500,000 is the same under the grant and the tax credit, but the company needs to attract two fewer investors to make its target of $2,000,000. Summary of Example Comparing Tax Credit and Grant Approaches No incentive Investment raised from investors Grant amount Total angel investment raised Gross investment per investors Net investment (after savings from tax credit) Number of investors required State cost/revenue reduction Contribution from investors Increased federal tax revenues
$2,000,000 0 2,000,000 100,000 100,000 20 0 2,000,000 0
Tax credit $2,000,000 0 2,000,000 119,400 100,000 16.75 500,00 1,675,000 -175,000
Matching grant $1,500,000 500,000 2,000,000 100,000 100,000 15 500,000 1,500,000 0
36
The $119,400 investment yields a gross state tax credit of $29,850. However, because this will reduce the investor’s itemized deduction for state income taxes, their federal tax will rise by $10,448 (assuming the investor is in the top federal tax bracket of 35 percent). Thus, the combined federal and state tax benefit from the credit is $19,400. One must assume that investors evaluate the potential return on their investments on an after-tax basis. After all, that is what the tax credit approach is premised on. Thus, they will not be willing to ignore the federal tax effects on the rate of return on their investments. 37
To make the numbers balance and yield identical investments to EBB of $2,000,000, the example assumes that the 17th investor under the credit scenario makes a net investment of $75,000, rather than $100,000. This is the 0.75 part of an investor in the second from the far right column, making the total number of investors 16.75.
Presentation to the House Committee on Taxes House Research Department
February 9, 2010 Page 26
The next-to-last line of the table shows that the tax credit requires raising $175,000 more from investors to hit the target amount of $2,000,000. This is so because the federal government is, in effect, taxing the credit (through lower itemized deductions being claimed by the investors) and collecting more revenue as a result. In the example, this forces the company to attract 1-¾ investors more investors to make up the difference. Under the credit approach, the state could instead decide to reduce the amount of matching grants it provides, requiring EBB to raise the same $1.675 million from investors as under the credit approach, thus yielding state budget savings of $175,000 while having the same incentive effect as the credit.
Presentation to the House Committee on Taxes House Research Department
February 9, 2010 Page 27
Appendix B Notes on Data Two caveats should be noted relative to the data used in the report. First, the MoneyTreeTM Report is not the only national source of data on venture capital. Dow Jones/VentureSource also collects and publishes data on venture capital financings. This data is available only to paid subscribers and, as a result, House Research did not have access to it. However, a recent Brookings Institution Study published 2004 through 2009 data for the Great Lakes states, including both Minnesota and Wisconsin, using Dow Jones/VentureSource data. The reported amounts deviate somewhat from the MTR data, although the relative relationship between Minnesota and Wisconsin is fairly consistent across the two data sets. The table below compares the data from the two sources for the five years. Second, it is unclear to what extent the MTR data fully captures angel investment. Angel investors, by their nature, may be isolated individuals making investments in companies of friends, family, associates, and so forth that may not be reported. By some accounts, angel investors tend to be secretive. (This is in contrast with later stages venture capital, which more typically larger or institutional investors make.) Thus, the data likely underreport the amount of angel or startup/seed type investments. However, there is no reason to believe that this underreporting systematically varies by state. In any case, the MTR data was the best data available to us.
Comparison of MoneyTreeTM Report and Dow Jones/VentureSource Data for Minnesota and Wisconsin (amounts in millions) State 2004 2005 2006 Minnesota $478.41 $301.07 $327.69 MTR 391.32 221.39 551.53 Dow Jones Wisconsin 55.87 65.81 70.30 MTR 56.70 54.94 74.53 Dow Jones Wisconsin as a % of Minnesota 11.7% 21.9% 21.5% MTR 14.5% 24.8% 13.5% Dow Jones
2007
2008
2009
$484.26 469.42
$480.76 277.70
$183.66 127.48
80.89 79.00
64.02 55.30
13.87 3.50
16.7% 16.8%
13.3% 19.9%
7.6% 2.7%
Sources: Dow Jones/VentureSource data is from Table 1 of Frank E. Samuels Jr., Turning Up the Heat: How Venture Capital Can Help Fuel the Economic Transformation of the Great Lakes Region, prepared for the Brookings Institution (January 2010), p. 13, available at: http://www.brookings.edu/~/media/Files/rc/reports/2010/0129_venture_capital_samuel/0129_v enture_capital_report.pdf. MoneyTreeTM Report from the PricewaterhouseCoopers National Venture Capital Association website available at: https://www.pwcmoneytree.com/MTPublic/ns/index.jsp.