PHYSICAL REVIEW B 81, 184206 共2010兲
Surface order in cold liquids: X-ray reflectivity studies of dielectric liquids and comparison to liquid metals Sudeshna Chattopadhyay,1 Ahmet Uysal,1 Benjamin Stripe,1 Steven Ehrlich,2 Evguenia A. Karapetrova,3 and Pulak Dutta1 1
Department of Physics & Astronomy, Northwestern University, Evanston, Illinois 60208, USA National Synchrotron Light Source, Brookhaven National Laboratory, Upton, New York 11973, USA 3Advanced Photon Source, Argonne National Laboratory, Argonne, Illinois 60439, USA 共Received 10 March 2010; published 17 May 2010兲
2
Oscillatory surface-density profiles 共layers兲 have previously been reported in several metallic liquids, one dielectric liquid, and in computer simulations of dielectric liquids. We have now seen surface layers in two other dielectric liquids, pentaphenyl trimethyl trisiloxane, and pentavinyl pentamethyl cyclopentasiloxane. These layers appear below T ⬃ 285 K and T ⬃ 130 K, respectively; both thresholds correspond to T / Tc ⬃ 0.2 where Tc is the liquid-gas critical temperature. All metallic and dielectric liquid surfaces previously studied are also consistent with the existence of this T / Tc threshold, first indicated by the simulations of Chacón et al. 关Phys. Rev. Lett. 87, 166101 共2001兲兴. The layer width parameters, determined using a distortedcrystal fitting model, follow common trends as functions of Tc for both metallic and dielectric liquids. DOI: 10.1103/PhysRevB.81.184206
PACS number共s兲: 64.70.kj, 68.03.Hj
I. INTRODUCTION
Liquid-vapor interfaces are ubiquitous in everyday life, and basic features such as surface tension and capillary waves are familiar to most undergraduates. The familiar picture of the free surface, in which the density varies monotonically from that of the liquid to that of the gas, was proposed in 1831 by Poisson1 as an improvement over an unphysical step-function profile. However, predictions of oscillatory 共layered兲 interfacial density profiles have repeatedly appeared in the literature.2 The problem is that these predictions were not experimentally confirmed in most liquids. X-ray reflectivity studies, of, e.g., liquid helium,3 alkanes,4 ethanol,5 polymers and polymer solutions,6,7 water,8,9 etc., saw only monotonic surface profiles. 共All except liquid helium were studied at or near room temperature.兲 On the other hand, Rice and co-workers10,11 proposed that liquid-metal surfaces would be layered because of the role of the electron gas in creating an abrupt transition between the conducting liquid and nonconducting vapor, resulting in an effective “hard wall.” This prediction was also not immediately confirmed, but starting some years later, a series of x-ray experiments12–16 have clearly shown that many liquid metal–vapor interfaces are layered at or above room temperature. The conclusion implied by the experimental correlation, and supported by the theoretical prediction, is that conduction electrons cause surface layering. However, computer simulations of point particle liquids with no electron gas, by Chacon et al.17,18 and by Li and Rice,19 also showed surface layers at sufficiently low temperatures. When cooled, Lennard-Jones liquids freeze before developing surface layers, but if the interparticle potential is made wide and shallow, this lowers the triple point and/or raises the liquid-gas critical temperature 共Tc兲. Onset of layering in the simulations17 occurred at ⬃0.2Tc. Shallow and longer-range interatomic potentials are appropriate for liquid metals because of screening by conduction electrons. Indeed, liquid metals tend to have very high 1098-0121/2010/81共18兲/184206共8兲
Tc. Liquid-metal experiments showing layers were conducted at or above room temperature but invariably well below 0.2Tc. It is generally impractical to do experiments above 0.2Tc in these materials because Tc is so high. The molecular liquid studies that showed no layers were also conducted near room temperature, but this is above 0.2Tc 共in fact, generally above 0.45Tc兲 for these materials. Cooling, would not have helped: most dielectric liquids freeze before 0.2Tc can be reached. Thus all existing observations are technically consistent with the 0.2Tc threshold. The prospect of a common picture of layering in all liquids is attractive, although the computer simulations provide no explanation, only empirical evidence. Moreover, the threshold prediction cannot be fully verified in most metallic or dielectric liquids since these can be studied either above or below the purported threshold but not both. The single exception prior to the present work is tetrakis共2ethylhexoxy兲silane 共TEHOS兲, which remains liquid in the bulk at the threshold temperature and clearly shows surface layers developing when cooled to ⬃0.23Tc.20,21 In this paper, we use “cold liquid” to mean any liquid that is at or below ⬃0.2Tc but is still a bulk fluid and not a solid or glass. We will describe in detail our studies of the surface profiles of two other cold liquids, pentaphenyl trimethyl trisiloxane 共PPTMTS兲,22 and pentavinyl pentamethyl cyclopentasiloxane 共PVPMCPS兲. The critical temperature for TEHOS is 950 K; that for PPTMTS is significantly higher 共⬃1210 K兲 and that for PVPMCPS is significantly lower 共⬃750 K兲. Nonetheless, these materials have very similar surface-layering behavior. Moreover, the layers in these three dielectric liquids and in several liquid metals show common trends as functions of Tc. II. EXPERIMENTAL DETAILS AND DATA FITTING
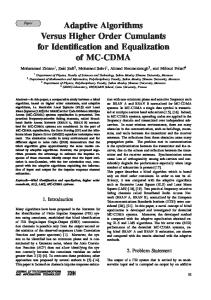
Liquid PPTMTS and PVCMPS were purchased from GELEST, Inc., with a purity of ⬎95% and used as supplied. Molecules of the two liquids are shown in Fig. 1. Figure 1共a兲
184206-1
©2010 The American Physical Society
PHYSICAL REVIEW B 81, 184206 共2010兲
CHATTOPADHYAY et al. 70
(b)
40 30 PVCMCPS
20
soft-
shows the PPTMTS molecule, consisting of three Si atoms connected to each other through two oxygen atoms, and each Si is also attached to benzene rings and methyl groups so as to form a roughly spheroidal shape 共dimensions ⬃10.5 Å max to ⬃7.5 Å min兲. The PVPMCPS molecule is shown in Fig. 1共b兲. It has a cyclic structure consisting of five Si atoms connected to each other through five oxygen atoms, and each Si is attached to vinyl and methyl groups, again forming a roughly spheroidal shape 共dimensions ⬃9 Å max to ⬃7.5 Å min兲. The dielectric liquid PPTMTS is commercially available as a diffusion-pump oil 共Dow Corning 705兲. Obviously it has a low vapor pressure, which implies a high boiling point and high critical temperature. Further, it means that liquid-films wetting solid substrates can be studied without special precautions to retard evaporation. Its boiling point is ⬃523 K at 100 Pa;23 using the Clausius-Clapeyron equation to estimate the normal boiling point, and then using the normal boiling point to estimate the critical temperature,24 we find that Tc is ⬃1210 K 共this estimation process has an uncertainty of roughly ⫾5%兲. The normal boiling point of PVPMCPS is ⬃535 K 共from Gelest catalog兲 and the estimated critical temperature is ⬃750 K. We have measured the surface tension 共␥兲 as a function of temperature 共T兲 using a Wilhelmy-plate method in the range 265–298 K, extrapolated the data,25 and used this to calculate the interface width due to capillary waves, cw.5,26,27 In Fig. 2, upper panel, measured values of surface tension 共open circles兲 are plotted vs T, and the T dependence fitted using the theoretical expression:25 ln共␥兲 = A + n ln共Tc-T兲, where Tc is 1210 K for PPTMTS and 750 K for PVPMCPS. A and n are constants determined from best fitting. The surface tension is then extrapolated to lower temperatures, where it cannot be directly measured. The lower panel of Fig. 2 shows 2 cw derived from the extrapolated surface tension. In order to easily cool the liquids in a standard closedcycle refrigerator and orient their surfaces in a standard diffractometer, PPTMTS and PVCMCPS were studied in the form of thin-films wetting solid substrates.20 Uniform liquid films of PPTMTS of thickness ⬃15 000 Å were obtained by spreading the liquid on silicon substrates by spin coating. The viscosity of PVCMCPS is low, and therefore uniform liquid films of thickness ⬃5000 Å were prepared simply by putting a few drops of liquid on the substrate, allowing the liquid to spread, and then draining the excess.20,21 For one film of PPTMTS, we used the same sample preparation method as PVPMCPS, and we saw no differences in x-ray
PPTMTS
24 PVCMCPS
18 2
CHEM3D
50
12
2
FIG. 1. 共Color online兲 Molecular structure using ware: 共a兲 PPTMTS; 共b兲 PVPMCPS.
�cw (Å )
(a)
� (dynes/cm)
60
PPTMTS
6 0 100
150
200
250
300
Temperature (K) FIG. 2. 共Color online兲 The upper panel shows the temperature dependence of the surface tension 共␥兲 for PPTMTS and PVPMCPS: circles indicate data obtained using a Wilhelmy-plate method in the range 265–298 K, and solid lines show the fitted and then extrapolated ␥ using ln共␥兲 = A + n ln共Tc-T兲, where A and n are constants, and Tc is the critical temperature of the liquid. The lower panel 2 shows the calculated cw vs T for PPTMTS and PVPMCPS.
results due to sample preparation. The thickness is much larger than relevant length scales 共surface roughness, molecular dimensions, etc.兲. The substrates used were etched using hydrofluoric acid such that the rms surface roughness is ⬎20 Å. This ensures that scattering from the internal interface, which is not of interest here, contributes only a very diffuse signal and is easily removed through the conventional process of subtracting the off-specular background.20,28 Before deposition of PPTMTS films, the cleaned Si wafers were etched once again with 2% HF to make the substrates hydrophobic, which allowed us to get uniform wetting. This step was not required for PVCMCPS. We detected no measurable changes in film thickness and its wetting properties 共or uniformity兲 over at least 3 days for PPTMTS and at least 1 day for PVCMCPS, which confirms that the evaporation rate is very low and film is stable. Specular x-ray reflectivity studies were performed using a conventional four-circle diffractometer. The beam size was ⬃0.5 mm vertically and ⬃1 mm horizontally, and the momentum resolution was ⬃0.004 Å−1. The samples were mounted on the cold head of a closed-cycle refrigerator and covered with a beryllium radiation shield, which helps to keep the sample temperature uniform. The cold head and the sample were then sealed under vacuum with a beryllium can. The whole system was pumped with a molecular turbo pump to maintain a vacuum. Before collecting data, the sample was kept at the desired temperature for at least 30 min for the system to reach equilibrium. In addition to specular scans,
184206-2
PHYSICAL REVIEW B 81, 184206 共2010兲
SURFACE ORDER IN COLD LIQUIDS: X-RAY… 0.002
0
10
PPTMTS
PPTMTS
-1
10
-2
10
R/RF
R/RF
0.001
40K 200K
-3
10
220K 227K
-4
1x10
235K
0.000
243K -5
0.2
0.4
0.6
1x10
0.8
250K 285K
-1
qz (A )
-6
FIG. 3. 共Color online兲 Specular reflectivity data 共circles兲 before background subtraction, divided by the Fresnel reflectivity RF, for PPTMTS at 235 K. RF is the theoretical reflectivity from an ideal surface. The two solid lines show slightly off-specular data 共sample misaligned by ⫾0.1°兲.
slightly off-specular “background” scans were performed and subtracted from the specular data, thus removing the scattering from all diffuse sources including that from the rough liquid-solid interface. Figure 3 shows the specular reflectivity R divided by the Fresnel reflectivity RF 共before background subtraction兲 along with two corresponding offspecular scans at 235 K for PPTMTS. The specular scan 共open circle兲 shows a clear “hump” centered around 0.5 Å−1, which is completely absent in off-specular scans 共solid lines兲. This indicates that the structure in the specular reflectivity is significant and not part of the off-specular background. The background-subtracted reflectivity data were fitted using the distorted crystal model, frequently used to fit reflectivity data from liquid-metal surfaces.12,26 It consists of a semi-infinite series of Gaussians with increasing widths. As with the liquid metals Bi and Sn, we found that there is a density enhancement at the surface that requires us to modify the model to include two regions with different average densities. Thus we assume that there is a density of the form n=1
2 共z兲 d0 2 = r兺 e−共z − nd0兲 /2n bulk n=0 冑2n
⬁
+兺
n=2
d1
冑2n
e−关z − 共n − 2兲d1 − 2d0兴
298K
2/22 n
,
2 where 2n = 20 + n¯2 = 2i + cw + n¯2. In other words the width of the first layer is 0, and subsequent layer widths increase at a rate that depends on the magnitude of ¯. The first layer width 0 is further decomposed into an intrinsic term i due to all noncapillary factors and a term cw due to thermal capillary waves. The first two layers have a different density
10
0.2
0.4
258K 275K
0.6
-1
0.8
qz (Å ) FIG. 4. 共Color online兲 Specular reflectivity data 共divided by RF兲 for PPTMTS films on rough silicon substrates, at different temperatures. Lines are the best fits from which the electron-density profiles are determined.
共multiplicative factor r兲 and a different spacing 共d0兲 compared to subsequent layers 共spacing d1兲: note that this form for the density has no specific physical justification; it is used because it is easier to integrate, because the trends in the parameters are informative 共see below兲, and because its consistent use allows the behavior of different liquids to be compared 共we will compare some of these at the end of this paper兲. Note also that cw is not a variable fitting parameter; it is calculated from extrapolated surface tension data, as mentioned earlier in the context of Fig. 2. III. RESULTS: PPTMTS
We recently reported22 that liquid PPTMTS shows a sharp increase in the persistence of the surface layers into the bulk materials at its glass transition temperature 共Tg ⬃ 224 K兲. Here we show additional details regarding the temperaturedependent trends. Figure 4 shows the specular reflectivity R divided by the Fresnel reflectivity RF at selected temperatures. At 298 K, the scans are featureless. At lower temperatures, distinct reflectivity oscillations are seen, indicating that there is some structure in the density profile, in particular the hump centered around 0.5 Å−1 mentioned above. This increase in intensity allows data to be collected to higher qz at temperatures below 298 K. These changes imply changes in the surface electron density 共z兲 averaged over the plane. The change in the reflectivity data appears at the same temperature whether we are going up or down and does not have any detectable dependence on age or temperature history of the sample, x-ray exposure, etc. The temperature threshold is
184206-3
PHYSICAL REVIEW B 81, 184206 共2010兲
CHATTOPADHYAY et al.
6
220K
PPTMTS ~6 Å
220K
P
5
235K
4 ���bulk
~12 Å
0.0 0
275K
3
10
20
2.0
220K ~12 Å
1.0 ���bulk
���bulk 298K
1
~6 Å
1.5
285K
2
30
S (Å)
0.5
1.02 1.00 20
30
40 Depth, z (Å)
20
30
40
0.0 -10
0 0
20
Depth, z (Å)
40
FIG. 5. 共Color online兲 Electron-density profiles of PPTMTS films on rough silicon substrates, at selected typical temperatures. Solid lines 共red兲 show best fit normalized electron densities 关共z兲 / bulk兴. The dashed lines 共blue兲 show the density profiles with capillary broadening removed 共i.e., plotted with cw = 0兲. The profiles have been shifted vertically for clarity.
⬃285 K, which is only slightly below room temperature and much higher than the threshold for TEHOS 共⬃230 K兲. However, in terms of Tc, it corresponds to T / Tc ⬇ 0.23, the same as for TEHOS and close to that seen in recent simulations.17 Figure 5 shows typical fitted electron densities 共z兲 in five temperature regions. The solid lines are the actual best-fit electron-density profiles; the dashed lines are the same density functions, except with cw = 0. In other words, the dashed lines show what the surface profiles would look like if they had not been broadened by thermal capillary waves. The temperature-dependent density profiles show the emergence of surface density oscillations with decreasing temperature, with a threshold at 285 K, i.e., ⬃0.23Tc. 共This was clear even in the raw reflectivity data, discussed in context of Fig. 4兲. Figure 6 shows the Patterson function of the R共q兲 / RF共q兲 data at temperature 220 K, which is compared with the extracted electron-density profile using the distorted crystal model. The Patterson function is model-independent: a maximum or minimum in the Patterson function at a given s indicates that there are two interfaces a distance s apart; if the density is changing in the same direction at both interfaces, there will be a maximum, while if one is increasing and the other is decreasing, there will be a minimum. Figure
0
10
Depth, z (Å)
FIG. 6. 共Color online兲 Top: Patterson function and bottom: electron-density profile obtained using the distorted crystal model at 220 K for PPTMTS. A section of the profile is also shown enlarged. The vertical dashed lines in the bottom panel indicate the internal interfaces in the liquid, the distances between which correspond to minima and maxima in the Patterson function.
6 shows the Patterson function and extracted electron-density profile nicely correspond to each other, which indicates that the basic conclusions regarding the electron-density profile are independent of the model used. Figure 7 shows the trends in some fitting parameters for PPTMTS. The surface-density enhancement factor r 共Fig. 7, top left兲 shows only a weak and featureless temperature dependence. The layer spacings d0 and d1 are shown in the bottom-left panel of Fig. 7, and these are essentially temperature-independent. The average values of d0 and d1 are 7.8 Å and 7.5 Å, respectively. The top surface roughness, 0 共Fig. 7, top right兲 decreases with decreasing temperature in the layered liquid phase, as expected because the roughness is due in part to thermal capillary waves. Near and below Tg there is some variability but the roughness does not increase very sharply at the transition. It should be noted here that i, the intrinsic top surface roughness after subtracting the roughness due to capillary waves, remains constant 共⬃2.2 Å兲 in the layered PPTMTS liquid above Tg.22 The parameter ¯ is shown in bottom-right panel of Fig. 7. The horizontal lines are guides to the eye. There is an abrupt change in ¯ by a factor of 2 at the glass transition, indicating that the layers penetrate further into the bulk when T ⬍ Tg. This trend was already observed qualitatively in Fig. 4, where reflectivity data show a sudden shape change 共or it becomes much sharper兲 below Tg. See Ref. 22 for further discussion of this effect, which constitutes the first observation of a structural change at a liquid-glass transition.
184206-4
4.0
1.2
r
1.4
�0 (Å)
4.4
r
1.6
3.6
1.4
5.4
1.2
4.8
1.0
4.2
0.8
3.6
�0 (Å)
PHYSICAL REVIEW B 81, 184206 共2010兲
SURFACE ORDER IN COLD LIQUIDS: X-RAY…
16
1.5
8
1.0
6
40 60
200
240
280
40 60
Temperature (K)
200
240
Figure 8共a兲 shows the specular reflectivity 共R / RF兲 for PVPMCPS at various temperatures. At 150 K, the scans are featureless. At lower temperatures, distinct reflectivity oscillations are seen, indicating that there is some structure in the reflectivity. The temperature threshold is at ⬃128 K, much 6 PVCMCPS 105K
122K
125K -3
10
150K
1
-5
-6
128K
2
150K
1x10
10
125K
3
128K
-4
1x10
122K
4
10
���bulk
R/RF
-2
105K
5
-1
(a)
0.2
(b)
0 0.4
0.6 -1
qz (Å )
0
20
Depth, z (Å)
110
2.4 120
Temperature (K)
Temperature (K)
10
8
100
IV. RESULTS: PVPMCPS
0
2.8
4
280
FIG. 7. 共Color online兲 Temperature dependence of the fitting parameters for PPTMTS. Symbols indicate the temperature history of the sample 共䊊: temperature was lowered to the value shown; 夡: temperature was increased to the value shown兲. Top left: surfacedensity enhancement parameter r. Bottom left: d0 共open symbols兲 and d1 共filled symbols兲, the spacings between the first three layers and between subsequent layers, respectively. Top-right: 0, the top surface roughness, bottom-right: ¯, which measures how rapidly the layers broaden as one goes into the bulk. The dotted vertical lines show Tg as measured in Ref. 29. The horizontal dashed lines are guides to the eye.
10
12
open: d0 filled: d1
0.5
4
3.2
�� (Å)
2.0
d0 and d1 (Å)
open: d0 filled: d1
10
�� (Å)
d0 and d1 (Å)
12
40
FIG. 8. 共Color online兲 共a兲 Specular reflectivity data 共divided by RF兲 of PVPMCPS films on rough silicon substrates. Lines are best fits. 共b兲 The corresponding electron-density profiles. Solid lines 共red兲 show best fit normalized electron densities 关共z兲 / bulk兴. The dashed lines 共blue兲 show the density profiles with capillary broadening removed 共i.e., plotted with cw = 0兲. The profiles have been shifted vertically for clarity.
130
100
110
120
130
Temperature (K)
FIG. 9. 共Color online兲 Temperature dependence of the fitting parameters for PVPMCPS. Symbols indicate the temperature history of the sample 共䊊: temperature was lowered to the value shown; 夡: temperature was increased to the value shown兲. Top left: surface-density enhancement parameter r. Bottom left: d0 共open symbols兲 and d1 共filled symbols兲, the spacing between the first three layers and between subsequent layers, respectively. Top right: 0, the top surface roughness. Bottom right: ¯, which measures how rapidly the layers broaden as one goes into the bulk.
lower than the threshold for PPTMTS 共⬃285 K兲, and TEHOS 共⬃230 K兲.20 In terms of Tc, it corresponds to T / Tc ⬇ 0.17, not the same value as for PPTMTS and TEHOS,20 but still in the neighborhood of 0.20. At the onset of surface layering, the surface tension of these three dielectric liquids PVPMCPS, PPTMTS, and TEHOS are ⬃42 dyn/ cm, ⬃40 dyn/ cm, and ⬃37 dyn/ cm, respectively 共see Fig. 2 and Ref. 21兲. Figure 8共b兲 shows the fitted electron densities at the same five selected temperatures as in Fig. 8共a兲. The solid lines are the actual best-fit electron density profiles; the dashed lines are the same density functions, except with cw = 0. Three major features should be noted in Fig. 8共b兲. First, it is clear that surface oscillations appear at 128 K and below. Second, there is a density hump at the surface when the oscillations appear. A similar effect is seen in PPTMTS, TEHOS,20 Sn,9 and Bi.30 However, it is not seen in simulations17 and is not predicted theoretically.10 This surface-density enhancement is discussed further in Ref. 30. Third, at and below 122 K, the layer spacing 共d0 and d1兲 increases compared to the values at higher temperatures. There is also a qualitative difference at and below 122 K: the oscillations are larger and persist further into the bulk material. Figure 9 shows the trends in some fitted parameters. The surface-density enhancement r shows no specific trend with temperature 共Fig. 9, top left兲. As mentioned in earlier section, the layer spacings 共d0 and d1, Fig. 9, bottom left兲 increase with decreasing temperature. Above 122 K, the average values of d0 and d1 were ⬃8 Å and ⬃7.5 Å, respectively, but at and below 122 K d0 and d1 increase to ⬃15 and ⬃12 Å. These molecules are quite flexible and the changes can reasonably be attributed to changes in molecular conformation near the interface. 0 and ¯ are shown in Fig. 9, top-right
184206-5
PHYSICAL REVIEW B 81, 184206 共2010兲
CHATTOPADHYAY et al.
and bottom-right panels, respectively. The trend in 0 is similar to, and probably attributable to, the trend in the layer spacings. However, ¯ appears to change sharply at 122 K although the data above 122 K are limited. 共The range of temperatures between 122 K and the layering onset temperature of 130 K is quite small.兲 We speculate that the temperature 122 K is the glass transition temperature for PVPMCPS. The direct measurement of mechanical properties at this low temperature is difficult and has not yet been performed for this material. Note that no solidlike diffraction peaks have been observed for PVPMCPS or PPTMTS at any temperature. Below 105 K, for PVPMCPS, we observe only featureless reflectivity profiles, probably due to increased surface roughness 共0兲 at lower temperatures 共see the trend in Fig. 9, top right兲.
PVPMCPS
0.30
�� /d0
0.24
TEHOS
0.18
PPTMTS Ga
Hg
0.12 Bi
PVPMCPS
0.5
� i / d0
0.4
TEHOS
0.3 PPTMTS
0.2 Hg
0.1
V. DISCUSSION
The fact that the layering threshold 共in simulations and molecular liquids兲 is consistently around 0.2Tc is an empirical result, but the use of scaled temperatures 共T / Tc兲 is reasonable on general grounds. Early predictions of layered surface structures2,31 suggested that the surface profile would be monotonic only at Tc and oscillatory elsewhere. Subsequently, Evans et al.32 pointed out that the density profile at an interface would mimic the long-range decay of the twopoint correlation function g共r兲: when this is oscillatory, there will be surface layers, and when it is monotonic, the surface density will be also. The relationship between g共r兲 and the density as a function of distance from the interface follows from mean-field 共density-functional兲 considerations. The Fisher-Widom line33 共in, e.g., the p-T plane兲 separates states with oscillatory vs decaying asymptotic g共r兲. Unfortunately the asymptotic behavior of g共r兲 is not accessible to experiments on atomic/molecular liquids. Evans et al. calculated that the Fisher-Widom line crosses the liquid-vapor coexistence curve at 0.9Tc, which means that most liquid surfaces will be layered in room-temperature experiments. As we know, this is not so. Subsequently, Tarazona et al.34 calculated that the Fisher-Widom line can be at much lower temperatures 共as low at 0.32Tc兲 depending on the pair potential. Thus while the Fisher-Widom line may define a rigorous upper limit to where layers might be observed, it does not necessarily tell us where the layers actually are observed in practice. Moreover, there might not be a sudden transition at the Fisher-Widom line, since oscillations in g共r兲 should develop slowly as T is lowered, and if so the same slow development should be seen in surface-density oscillations. Even if it is postulated that layers become visible at temperatures much lower than the Fisher-Widom line because of the obscuring effect of surface fluctuations, the surface tension changes slowly with temperature. Therefore the sudden onset of layers at ⬃0.2Tc, although a reproducible physical phenomenon in multiple systems, remains unexplained. Are surface ordering in liquid metals and surface ordering in dielectric liquids the same phenomenon, or two entirely different physical effects that coincidentally have similar experimental manifestations? Certainly any explanation for di-
0.0000
Ga
0.0004
0.0008
0.0012
0.0016
1/TC (1/K) FIG. 10. 共Color online兲 Tc dependence of some surface-layering parameters for different isotropic liquids. The width parameters have been divided by the layer spacing in the same material to obtain scale-independent parameters so that atomic and molecular liquids can be compared. The lines are guides to the eye.
electric liquids should also apply to liquid metals 共although not vice versa兲. Parsimony 共Occam’s razor兲 argues for a single explanation but this does not constitute proof. There is no liquid identical to 共say兲 mercury except for being nonmetallic, or identical to 共say兲 PPTMTS except with conduction electrons. Even if it were possible to safely heat mercury to 0.23Tc 共⬃400 K兲 and do x-ray reflectivity there, thermal fluctuations 共capillary waves兲 are likely to prevent the phenomenon from being observed there.35 Other liquid metals have even higher predicted thresholds. However, there are some clues that there may be a common mechanism. One argument that could be made in favor of different origins for metallic vs nonmetallic layering is that the layering “peak” in our TEHOS data is significantly weaker than in Hg or Ga. 共Of course, many liquid metals14,30 have peaks weaker than Hg or Ga.兲 Both liquid-metal and dielectric liquid-layering data have been analyzed with the distorted-crystal model. Since the length scale 共e.g., the layer spacing or the atomic/molecular size兲 varies significantly between molecular vs elemental materials, ¯ and i have been divided by d0, the layer spacing, to create the scaleindependent variables plotted in Fig. 10. Since ¯ does not appear to have a significant temperature dependence in any given material in the layered liquid phase,12,15,20–22,30 available values have been used irrespective of the temperature at which they were measured. Figure 10, top panel shows the plot of ¯ / d0 for different dielectric and metallic liquids, showing surface layering,12,15,21,30 with their defined or estimated24,36,37 critical temperature 共Tc兲. In and Sn, which also have surface layers, are not shown because their Tc is not known. Note that for Bi we have used the ¯ / d0 data from
184206-6
PHYSICAL REVIEW B 81, 184206 共2010兲
SURFACE ORDER IN COLD LIQUIDS: X-RAY…
Ref. 30. They have shown series of ¯ values depending on the other fitting parameters. We have chosen the best fit value of ¯ / d0 共where A, the width of the top adlayer, is ⬃0.5 Å兲. The plot shows a roughly linear relationship of ¯ / d0 with 1 / Tc. Similarly i / d0 shows a roughly linear dependence on 1 / Tc 共Fig. 10, bottom panel兲. Bi is not shown in this plot because the value of i is not given in Ref. 30. For some of these liquids i / d0 is observed to vary slightly with the experimental temperature: for these liquids the vertical line indicates the range. Remarkably, the materials with higher ¯ and i values have smaller Tc so that both metal and dielectric data fall on the same curves 共Fig. 10兲. In terms of 1 / Tc, there is a roughly linear trend. We speculate that longer-range interatomic/intermolecular interactions could be responsible for higher Tc and also for stronger layering. These graphs suggest that layering was seen first in liquid metals not only because they are “cold” even at room temperature, but because their longer-range interactions give rise to stronger layer ordering at their free surfaces 共thus making the effect
1 “Nouvelle
théorie de l’action capillaire,” S. D. Poisson, Bachelier, Paris 共1831兲. 2 For example, Clive A. Croxton, Liquid State Physics: A Statistical Mechanical Introduction 共Cambridge University Press, Cambridge, 1974兲. 3 L. B. Lurio, T. A. Rabedeau, P. S. Pershan, F. Isaac, Silvera, M. Deutsch, S. D. Kosowsky, and B. M. Ocko, Phys. Rev. Lett. 68, 2628 共1992兲. 4 B. M. Ocko, X. Z. Wu, E. B. Sirota, S. K. Sinha, and M. Deutsch, Phys. Rev. Lett. 72, 242 共1994兲. 5 M. K. Sanyal, S. K. Sinha, K. G. Huang, and B. M. Ocko, Phys. Rev. Lett. 66, 628 共1991兲. 6 W. Zhao, X. Zhao, J. Sokolov, M. H. Rafailovich, M. K. Sanyal, S. K. Sinha, B. H. Cao, M. H. Kim, and B. B. Sauer, J. Chem. Phys. 97, 8536 共1992兲. 7 W. Zhao, M. H. Rafailovich, J. Sokolov, L. J. Fetters, R. Plano, M. K. Sanyal, S. K. Sinha, and B. B. Sauer, Phys. Rev. Lett. 70, 1453 共1993兲. 8 A. Braslau, M. Deutsch, P. S. Pershan, A. H. Weiss, J. AlsNielsen, and J. Bohr, Phys. Rev. Lett. 54, 114 共1985兲. 9 O. Shpyrko, M. Fukuto, P. S. Pershan, B. M. Ocko, I. Kuzmenko, T. Gog, and M. Deutsch, Phys. Rev. B 69, 245423 共2004兲. 10 M. P. D’Evelyn and S. A. Rice, Phys. Rev. Lett. 47, 1844 共1981兲. 11 M. P. D’Evelyn and S. A. Rice, J. Chem. Phys. 78, 5081 共1983兲. 12 O. M. Magnussen, B. M. Ocko, M. J. Regan, K. Penanen, P. S. Pershan, and M. Deutsch, Phys. Rev. Lett. 74, 4444 共1995兲; M. J. Regan, E. H. Kawamoto, S. Lee, P. S. Pershan, N. Maskil, M. Deutsch, O. M. Magnussen, B. M. Ocko, and L. E. Berman, ibid. 75, 2498 共1995兲; H. Tostmann, E. DiMasi, P. S. Pershan, B. M. Ocko, O. G. Shpyrko, and M. Deutsch, Phys. Rev. B 59, 783 共1999兲. 13 E. DiMasi, H. Tostmann, O. G. Shpyrko, M. Deutsch, P. S. Per-
easy to observe兲. This has led to the possibly unjustified impression that liquid metals are unique. In the 1970s and early 1980s, there was a large amount of theoretical and simulation activity in the area of liquid surface structure, but the corresponding level of experimental capabilities did not exist. The situation is largely reversed today. The availability of synchrotron radiation has dramatically improved our ability to “see” the liquid surface. We hope that the phenomena reported here will soon be explained theoretically and that this will lead to a better understanding of the liquid state. ACKNOWLEDGMENTS
This work was supported by the U.S. National Science Foundation under Grant No. DMR-0705137. We used the facilities of the Center for Functional Nanomaterials 共CFN兲, Beam Line X-18A at the National Synchrotron Light Source 共NSLS兲 and Sector 33-BM-C at the Advanced Photon Source 共APS兲, all of which are supported by the U.S. Department of Energy.
shan, and B. M. Ocko, J. Phys. Condens. Matter 12, A209 共2000兲. 14 O. G. Shpyrko, P. Huber, A. Grigoriev, P. Pershan, B. Ocko, H. Tostmann, and M. Deutsch, Phys. Rev. B 67, 115405 共2003兲. 15 O. G. Shpyrko, A. Y. Grigoriev, C. Steimer, P. S. Pershan, B. Lin, M. Meron, T. Graber, J. Gerbhardt, B. Ocko, and M. Deutsch, Phys. Rev. B 70, 224206 共2004兲. 16 B. Yang, D. Gidalevitz, D. Li, Z. Huang, and S. A. Rice, Proc. Natl. Acad. Sci. U.S.A. 96, 13009 共1999兲; B. Yang, D. Li, Z. Huang, and S. A. Rice, Phys. Rev. B 62, 13111 共2000兲; B. Yang, D. Li, and S. A. Rice, ibid. 67, 212103 共2003兲. 17 E. Chacón, M. Reinaldo-Falagán, E. Velasco, and P. Tarazona, Phys. Rev. Lett. 87, 166101 共2001兲. 18 E. Velasco, P. Tarazona, M. Reinaldo-Falagán, and E. Chacón, J. Chem. Phys. 117, 10777 共2002兲. 19 D. Li and S. A. Rice, J. Phys. Chem. 108, 19640 共2004兲. 20 H. Mo, G. Evmenenko, S. Kewalramani, K. Kim, S. N. Ehrlich, and P. Dutta, Phys. Rev. Lett. 96, 096107 共2006兲. 21 H. Mo, S. Kewalramani, G. Evmenenko, K. Kim, S. N. Ehrlich, and P. Dutta, Phys. Rev. B 76, 024206 共2007兲. 22 S. Chattopadhyay, A. Uysal, B. Stripe, G. Evmenenko, S. Ehrlich, E. A. Karapetrova, and P. Dutta, Phys. Rev. Lett. 103, 175701 共2009兲. 23 A User’s Guide to Vacuum Technology, 2nd ed., edited by J. F. O’Hanlon 共Wiley, New York, 1989兲, p. 242. 24 K. M. Klincewicz and R. C. Reid, AIChE J. 30, 137 共1984兲. 25 For example, J. Maroto, F. J. de las Nieves, and M. QuesadaPerez, Eur. J. Phys. 25, 297 共2004兲. 26 E. DiMasi, H. Tostmann, B. M. Ocko, P. S. Pershan, and M. Deutsch, Phys. Rev. B 58, R13419 共1998兲. 27 F. P. Buff, R. A. Lovett, and F. H. Stillinger, Phys. Rev. Lett. 15, 621 共1965兲 28 C. J. Yu, A. G. Richter, J. Kmetko, S. W. Dugan, A. Datta, and P. Dutta, Phys. Rev. E 63, 021205 共2001兲.
184206-7
PHYSICAL REVIEW B 81, 184206 共2010兲
CHATTOPADHYAY et al. 29
C. Maggi, B. Jacobsen, T. Christensen, N. B. Olsen, and J. C. Dyre, J. Phys. Chem. B 112, 16320 共2008兲. 30 P. S. Pershan, S. E. Stoltz, G. O. Shpyrko, M. Deutsch, V. S. K. Balagurusamy, M. Meron, B. Lin, and R. Streitel, Phys. Rev. B 79, 115417 共2009兲. 31 G. M. Nazarian, J. Chem. Phys. 56, 1408 共1972兲. 32 R. Evans, J. R. Henderson, D. C. Hoyle, A. O. Parry, and Z. A. Sabeur, Mol. Phys. 80, 755 共1993兲. 33 M. E. Fisher and B. Widom, J. Chem. Phys. 50, 3756 共1969兲.
34
P. Tarazona, E. Chacon, and E. Velasco, Mol. Phys. 101, 1595 共2003兲. 35 M. J. Regan, P. S. Pershan, O. M. Magnussen, B. M. Ocko, M. Deutsch, and L. E. Berman, Phys. Rev. B 54, 9730 共1996兲. 36 CRC Handbook of Chemistry and Physics, 90th ed. 共CRC Press, Philadelphia, PA 2009兲; A. A. Likalter, J. Phys.: Condens. Matter 3, 2795 共1991兲. 37 D. K. Belashchenko and O. I. Ostrovskii, Russ. J. Phys. Chem. 80, 509 共2006兲.
184206-8