Supporting Synchronous Sensemaking in GeoCollaboration Anna Wu, Xiaolong Zhang, John M. Carroll College of Information Sciences and Technology, the Pennsylvania State University University Park, PA 16802 {auw133, lzhang, jcarroll}@ist.psu.edu ABSTRACT
domain biases. A message that seems trivial to one expert may be critical to another. It is important to ensure the values of information be well understood by all individuals.
Synchronous collaborative sensemaking faces challenges because of the barriers among individuals’ knowledge domains, the diversity of information distributed among individuals, and the disjunctions of information artifacts and user actions. In this paper, we discuss the needs of synchronous collaborative sensemaking and our design to support such needs with visualization.
Media diversity. Collected information may be in multiformats, such as video, pictures, or simple textual documents, and stored in different locations. It is needed to construct meta-data based on the relevancy to team goals. Temporal disjunctions. Sensemaking is usually an ongoing and iterative process, in which temporal context and development could be critical. Individuals who fail to see the whole process may have difficulty in understanding what is going on. Even though there are documentations and records for reference, because these representations are often made under different mental models and in different situations, it is still a challenge to make sense of all these representations. Take the emergency example again. When an expert is added into the group discussion later and sees a great numbers of representations collected, she may not understand the origins, purposes, and possible structures of these representations, which usually make sense to others.
Author Keywords
Collaborative sensemaking, visualization ACM Classification Keywords
H5.m. Information interfaces and presentation (e.g., HCI): Miscellaneous. INTRODUCTION
Sensemaking usually happens when we encounter large amount of information or unfamiliar situations, where we need to make sense of ‘what is going on’. Sensemaking can be an individual activity or a collaborative activity in larger social contexts, such as groups or organizations. In collaborative sensemaking, information artifacts are often first collected, assessed, and filtered by individuals, and then those artifacts that are relevant and important to the group are integrated and discussed by the whole group.
Recent research on collaborative sensemaking has largely focused on sharing and reusing representation schema. While this type of asynchronous collaborative sensmaking is important, we also need to examine synchronous collaborative sensemaking, which is more complicated due to the involvement of multiple sensemakers with knowledge biases, and continuous information exchanges.
Several challenges arise when we move from individual sensemaking to collaborative sensemaking: Domain barriers. In collaboration, individuals collect and process information artifacts before sharing. Information collectors and processors may have different perspectives on the same event. For example, in emergency situations where multiple domain experts are involved in information assessment and decision-making, these domain experts may interpret the same information differently because of their
In this paper, we discuss our design to support collaborative sensemaking in an emergency management situation, which involves synchronous collaboration among domain experts. Our design focuses on supporting information exploration and assessment of individual sensemakers and information aggregation and representations at group level. RELATED WORK
Two conventional sensemaking approaches have been proposed: top-down and bottom-up. Russell et al. generalized the structure of sensemaking as an evolutionary process of building (if the observation fits), or modifying (if there are many ‘residues’) a schema and encoding the current observation into that schema. This top-down approach emphasizes the importance of finding proper representations to sensemaking [1, 2]. In contrast, ‘from
Permission to make digital or hard copies of all or part of this work for personal or classroom use is granted without fee provided that copies are not made or distributed for profit or commercial advantage and that copies bear this notice and the full citation on the first page. To copy otherwise, or republish, to post on servers or to redistribute to lists, requires prior specific permission and/or a fee. CHI 2009, April 4–9, 2009, Boston, MA, USA. Copyright 2009 ACM 978-1-60558-246-7/08/04…$5.00
1
data to wisdom’ adopts a bottom-up approach by connecting information pieces to build a knowledge schema [3]. When a group of people work together, original representations that are meaningful to individuals may be distorted as they pass from one part to another [4]. Collaborative sensemaking has been defined as ‘a process where a group of people (a group, a community, a society, etc.) seeks or creates a shared representation collaboratively to accomplish a shared task’ [5]. In collaborative sensemaking, the key point is not the structuring process, but finding mutually understandable representations. In a study of software development lifecycle, Selvin and Shum have identified the representation literacy obstacles across different stakeholders and proposed ‘representation morphing’ as a solution to overcome these obstacles [6]. However, due to task specific, choosing these morphings and their proper derivatives becomes another sensemaking process, the goal of which is to build a schema. Visual representation can assist sensemaking. People form a coherent understanding by using both external representations and internal representations [7]. In fact, visual representation tools are well known to increase the efficiency in problem-solving at individual level (e.g.[8]). Visualization provides external representations that reduce internal workload; revisable visualization represents mental processes [9] to reduce memory working load, and they amplify human mental processes by triggering solutions from feature detection. Studies in military area have shown that visualization techniques help people to rapidly comprehend complexly tangled information in emergency situations (Feibush et al., 2000). At the group level, Weick has called for “sensemaking support systems” to construct consensual definitions for building common understanding [10]. Visual representations, as a communication media, set up a platform for exchanging intelligent assistance. Dibiase (1990) has identified visual thinking in private domain versus visual communication in public domain [11]. In this model, visualization plays roles in exploring and confirming information in the private domain as well as in synthesizing and presenting information in the public domain. Then, visualization tools can work as a medium to enhance group communication effectively. Compared to the rich theory and field observations in collaborative sensemaking, most implementations of current systems focus on capturing group memory, which is critical to synchronizing collaboration (e.g. workplace that supports information searching and structuring [12]). In synchronizing collaboration where the interaction between collaborators need mutual understanding to give instant feedback, supporting systems should facilitate this process [13]. However, little research has been done on synchronizing collaborative sensemaking. Compendium, a hypertext mapping tool developed based on gIBIS [14], is
one of a few exceptions. As a meeting facilitation technique, Compendium largely focuses on public graphic representations to support synchronizing face-to-face collaboration [15]. DESIGN RATIONALES
Our design is aimed at supporting synchronous collaborative sensemaking in emergence management. Our design rationales were developed based on two previous research [16, 17]. These studies focused on emergency management planning activities. In this section, we briefly present the research work involved in these two studies, and then discuss the design requirements we developed from them. Our first study was a fieldwork on two communities in the Centre Region of Pennsylvania [16]. Its focus was on the observation of emergency management planning practice. In the study, local emergency management coordinators were interviewed about their planning activities; archival data, such as meeting minutes and email records among team members, were collected; and some of emergency planning meetings were audio-recorded and analyzed after. One of key outcomes of this study is a set of design requirements to support emergency management planning activities, including • Supporting exploration of geographic locations • Supporting labeling and annotating possible options • Supporting representations of specialized knowledge. The second study was a lab experiment to investigate how emergency management could be facilitated by a geocollaboration system. The experimental task was to construct an evacuation plan in an imaginary emergency situation. The scenario involved three subjects, acting as three domain experts – public works, environment, and mass care. Working as a team, they chose the most suitable shelter among four options by analyzing and synthesizing different pieces of information collected by individuals. From this study, we found that to support synchronous collaborative sensemaking, several design criteria are needed: • Provide both private and public working space. Private space allows individuals to explore and confirm. Individuals can use their private space to keep intermediate information and uncertain information. Public space, on the other hand, is used to display confirmed information for sharing. The distinction between private and public space grant individual freedom and deliberate publication. • Provide commenting and sketching tools for sensemaking in both private and public spaces. Comments and sketches can be visually represented based on their attributes. For example, if comments and sketches are about certain geographical locations, they
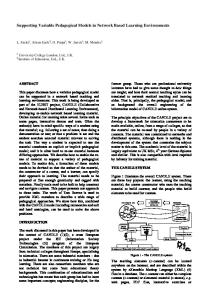
notes based on different data attributes (e.g., content, time, location). The aggregation chart creates note clusters based on data attributes and help users compare notes as groups. The timeline shows when individual notes were posted and by whom. In our design, visual items in these tools are always connected. As Figure 1 shows, clicking the second item in the table highlights the notes in the public map as well as the corresponding dots in the chart and timeline. This design allows users to examine one information artifact from multiple aspects and in different contexts simultaneously.
can be directly positioned on a map to improve the understanding, retrieval, and sharing. • Provide visualization tools to help information analysis. Properly constructing, examining and manipulating representations (e.g. clustering and aggregating) leads effective sensemaking, especially when people structure data by their collected intelligence. • Providing tools to help group understand activities of individuals. (need some details). DESIGN
Based on above design rationales, we designed a web-based collaborative sensemaking system to support emergency management. The system include map-based private and public spaces, a set of visualization tools for making sense of information artifacts, and tools to support sensemaking of individual activities. Private Map
Public Map
Supporting Collaborative Sensemaking We support collaborative sensemaking in three aspects. First, information artifacts in private space can be easily transferred into the public space for group discussion and synthesis. When a user wants to share important notes and sketches, she can copy them from the private map to the public map, at the exact same location on the map.
Focused Note Role Color
Second, all shared notes are put together for comparison and discussion. The table, the chart, and the timeline collect shared notes from everyone and allow users to aggregate them in different ways. In this way, the group can integrate relevant information from different individuals and build a better and more holistic understanding of information, which was once distributed. In addition to understanding information, our design also helps the group understand the activities of individuals. All notes and sketches are color-coded to indicate which domain experts create them. The timeline exhibits the temporal characteristics of activities by individual experts. Chatting Tool
Sorting Table
Aggregation Chart
Activity Timeline
DICUSSION AND FUTURE WORK
Figure 1. User Interface of Web-based Prototype
In synchronous collaborative work, efficiently exploring, exchanging, and synthesizing information is important to group sensemaking. Our design is an effort to study visualization tools can support different kinds of activities, individual or collaborative, in a collaborative sensemaking process. In this paper, we discussed the need of collaborative sensemaking and design requirement for visualization supportive system and presented a system prototype to support sensemaking in an emergency management scenario.
Figure 1 shows the user interface of our system. The overall user interface is dominated by two maps, a private and a public. Below two maps are a set of tools to support sensemaking and collaboration, including an embedded chatting tool, a sorting table for all shared information artifacts, a chart to aggregate shared information, and a timeline to visualize individual activities. Supporting Individual Sensemaking Individual users can explore information by directly interacting with maps. We incorporated Google Map services and users can use the map in the exactly same way as they do on the web site. Users can add notes and draw sketches at a location by directly clicking the map. We provided two maps: one private map where users keep their personal notes and sketches, and one public maps where users share notes and sketches posted.
Our future work will be focus on three directions. First, we will develop tasks to investigate the process of collaborative sensemaking. Currently, we are working on a route planning task, where team members need to workout a rescue route with various constraints. The team needs to make sense of event relationships, task priorities, temporal and spatial properties of information artifacts, and resource availability in developing an optimal solution. This task scenario will help us further gain insight into synchronous collaborative sensemaking. Second, we are also interested in exploring designs that allow people to combine combine the top-down approach with the bottom-up approach in sensemaking. Our current design largely focuses on supporting data aggregation and structure-finding, a
Representations in various visualization tools are coordinated to help users examine relevant information different aspects. All notes shared in the public map are also displayed in a sorting table, an aggregation chart, and an activity timeline. The sorting table allows users to rank
3
bottom-up approach. People may benefit more if tools to support top-down analysis are also provided. For example, in emergency management, a concept map tool can be used to help the team to decompose the overall goal into smaller sub-tasks, and then develop information requirement for each task. This goal decomposition and task-requirement development can guide bottom-up information aggregation approaches and help people better understand in what directions tangled and complex information should be extracted and analyzed. REFERENCES
1.Qu, Y. and Furnas, G. W. Sources of structure in sensemaking. Ext. Abstracts CHI '05, ACM (2005), 19891992 2.Russell, D. M., et al. The cost structure of sensemaking, ACM Press (1993), 269-276 3.Ackoff, R. L. From Data to Wisdom. Journal of Applied Systems Analysis, 16, 1 (1989), 3-9. 4.Robinson, M. and Bannon, L. Questioning representations, Kluwer Academic Publishers Norwell, MA, USA (1991), 219-233 5.Qu, Y. and Hansen, D. L. Building Shared Understanding in Collaborative Sensemaking. CHI'08 sensemaking workshop, ACM (2003), 1-5 6.Selvin, A. M. and Shum, S. J. B. Repurposing Requirements: Improving Collaborative Sense-Making over the Lifecycle. PROFES'99 (1999), 539-559 7.Hutchins, E. Cognition in the Wild. The MIT Press, Cambridge, MA, 1995.
8.Larkin, J. H. and Simon, H. A. Why a Diagram is (Sometimes) Worth Ten Thousand Words. Cognitive Science, 11, 1 (1987), 65-100. 9.Maceachren, A. M. The role of maps in spatial knowledge acquisition. Cartographic Journal, 28, 2 (1991), 152-162. 10.Weick, K. E. and Meader, D. K. Sensemaking and group support systems. Macmillan Publishing Company, New York, NY, USA, 1993. 11.DiBiase, D. Scientific Visualization in the Earth Sciences. Bulletin of the College of Earth and Mineral Sciences, 59, 2 (1990), 13-18. 12.Qu, Y. A sensemaking-supporting information gathering system. CHI'03, ACM (2003), 906-907 13.Conklin, E. J. and Yakemovic, K. C. B. A ProcessOriented Approach to Design Rationale. Human-Computer Interaction 6, 3 (1991), 357-391. 14.Conklin, J. and Bergman, M. L. gIBIS: a hypertext tool for team design deliberation. Date of Input: 10/15/2007, ACM (1987), 247-251. 15.www.compendiumInstitute.org 16.Schafer, W. A., et al. Supporting Community Emergency Management Planning through a Geocollaboration Software Architecture. Computer Supported Cooperative Work (CSCW), 16, 4 (2007), 501537. 17.Convertino, G., et al. Designing Group Annotations and Process Visualizations for Role-Based Collaboration. SBP'08 (2008), 1-10