Supporting Information � Wiley-VCH 2010 69451 Weinheim, Germany
Single-Molecule Four-Color FRET** Jinwoo Lee , Sanghwa Lee , Kaushik Ragunathan, Chirlmin Joo, Taekjip Ha, and Sungchul Hohng*
anie_201005402_sm_miscellaneous_information.pdf
Supporting Information Table of contents 1. Table S1. 2. Table S2. 3. Figure S1. 4. Figure S2. 5. Figure S3. 6. Figure S4. 7. Figure S5. 8. Figure S6. 9. Single-molecule four-color FRET in confocal microscopy. 10. Single-molecule four-color FRET in TIRF microscopy. 11. Data correction. 12. FRET calculation. 13. The Holliday junction experiments. 14. Strand exchange experiments.
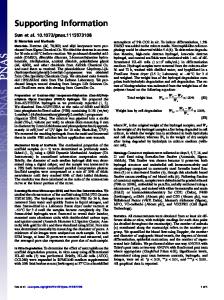
Table S1| Comparison of blue fluorophores
Dye Cy2 Atto488 Alexa488 Dylight488
Abs peak (nm) 489 510 495 493
Emi peak (nm) 506 523 519 510
*Data were collected from provider’s websites.
Extinction coefficient (M-1cm-1)
Quantum yield
150,000 90,000 71,000 70,000
0.12 0.8 0.92
Table S2| Photobleaching times of blue fluorophores
Cy2 Atto488 Alexa488 Dylight488
Bleaching time (gloxy)
Bleaching time (PCD)
SNR (gloxy)
SNR (PCD)
3.8s 35.1s 14.5s 12.1s
6.7s 44.9s 20.8s 13.1s
8.4 5.5 8.7 8.7
10.8 6.8 9.6 9.9
*The number of molecule used for data analysis. Cy2 (glucose oxidase) : 1128, Cy2 (PCD) : 1330, Atto488 (glucose oxidase) : 834, Atto488 (PCD) : 870, Alexa488 (glucose oxidase) : 543, Alexa488 (PCD) : 569, Dylight488 (glucose oxidase) : 580, Dylight488 (PCD) : 561. *The same excitation intensity was used for the measurements.
Fig. S1| Emission spectra of fluorophores and their inter-dye FRET efficiencies as a function of inter-dye distances
a) Emission spectra of Cy2, Cy3, Cy5, and Cy7. b) Six inter-dye FRET efficiencies of Cy2-Cy3-Cy5-Cy7 quartet as a function of inter-dye distances computed based on R0 values. R0’s were calculated based on reported optical properties of fluorophores. c) Emission spectra of Alex488, Cy3, Cy5, and Cy7. d) Six inter-dye FRET efficiencies Alexa488-Cy3-Cy5-Cy7 quartet as a function of inter-dye distances computed based on R0 values. R0’s were calculated based on reported optical properties of fluorophores.
Fig. S2| Spectral red-shift of blue fluorophores.
a) Representative intensity time traces of Alexa488 fluorescence recorded in the Cy2 channel (blue), and Cy3 channel (green). The similar behaviour was observed in all blue fluorophore tested. b) The fraction of red-shifted fluorophores. The fractions are 5.2% for Cy2 (85/1635), 9.1% for Atto488 (114/1254), 11.7% for Alexa488 (145/1239), 17.7% for Dylight488 (153/866), respectively.
Fig. S3| Schematic diagrams of single-molecule four-color FRET setup.
a) A schematic diagram of the setup in confocal microscopy. b) A schematic diagram of the setup in TIRF microscopy. L : lens, M : mirror, D : dichroic, F : filter, P : pinhole. Details of the setups are described in Supporting information text.
Fig. S4| A schematic diagram of the switching box used for ALEX in TIRF microscopy
a) Signal connection scheme of the switching box. The internal trigger line of EM-CCD is connected to the clock input of JK flip-flops. The first set of multiplexers select 3-laser ALEX or 2-laser ALEX, and the second set of multiplexers select automatic switching mode by EM-CCD or manual switching mode from the PC. b) Circuit diagram of 3-laser ALEX. Inverter (74HC04), D flip-flop (74F374), JK flip-flop (74LS112A), NOR (74LS02), AND (74LS08), multiplexer (74HC157, Philips), DAQ-board (PCI-6503, National Instrument) were used for this switching box.
Fig. S5| Holliday junction dynamics detected via single-molecule four-color FRET in TIRF microscopy
a) Representative fluorescence intensity time traces at blue (top), green (middle), and red excitations (bottom). Fluorescence signals of Cy2, Cy3, Cy5 and Cy7 are colored in blue, green, red and gray, respectively. In the top panel, Cy2 signal is vertically shifted for clear visualization. Experiments were performed at 20 ºC in 10 mM Tris (pH 8.0) with 100 mM MgCl2. b) FRET efficiency time traces. The six FRET efficiencies (black lines) were calculated from the data in a) following the method described in Supporting Information. c) FRET histograms collected from 22 molecules. d) Three-dimensional distribution of E12, E13, and E14 and e) E34, E23, and E24 from same molecule in c). To make a connection between two 3-D plots, each data point is color-coded based on E34.
Fig. S6| Initial and final FRET distribution of strand exchange experiment
a) Relative distribution of E13 and E24 at the initial stage of strand exchange from 132 molecules. b) Relative distribution of E13 and E24 after the completion of strand exchange.
Single-molecule four-color FRET in confocal microscopy. The setup was built based on an inverted microscope (TE2000-U, Nikon) equipped with a three-dimensional piezo-stage (LP-100, MadCityLabs). Three excitation lasers (473-nm, 0473-04-01, Cobolt; 532-nm, Excelsior-CDRH, Spectra-Physics; 633nm, HRP050, Thorlabs), were used as excitation sources. To facilitate the laser colocalization, emissions of the three lasers were coupled into a single-mode fiber (460HP, Thorlabs). An oil-immersion objective (UPLSAPO 100X, Olympus) was used for both excitation of fluorophores and collection of fluorescence signals. To reduce background noise, pinhole (P75S, Thorlabs) was used. The fluorescence signals were measured by using avalanche photo diodes (APD, SPCM-AQRH-14, Perkin Elmer). The identities of other optics in Figure 1b are: D1, a dichroic mirror (z532bcm, Chroma); D2, dichroic mirror (z488rdc, Chroma); D3, dichroic mirror (z473/532/633rpc-xt, Chroma); P, pinhole (P75S, Thorlabs); L1 and L2, lens (LAO-90.0-25.0/078, CVI); D4, dichroic mirror (540dcxt, Chroma); D5, dichroic mirror (640dcxr, Chroma); D6, dichroic mirror (740dcxr, Chroma); F1, bandpass filter (FF01-512/25-25, Semrock); F2, bandpass filter (HQ580/60m-2p, Chroma); F3, bandpass filter (HQ680/60m-2p, Chroma); F4, bandpass filter (HQ790/80m, Chroma). For ALEX technique, laser lines were switched on and off by using electrooptic modulators (EOM; 350-50, Conoptics). Switching of laser lines and detection of fluorescence signals were synchronized by using common trigger lines of a timer/counter board (DAQ PCI-6602, NI). The whole setup was run by a home-made program.
Single-molecule four-color FRET in TIRF microscopy. A prism-type TIRF setup was built based on an inverted microscope (IX71, Olympus). Three lasers (473-nm, Blues TM50, Cobolt; 532-nm, Compass215M, Coherent; 640-nm, Cube640-100C, Coherent) were used as excitation sources. The fluorescence signals were collected through a water-immersion objective (UPlanSApo 60X, Olympus), and separated by three dichroic mirrors, and focused on different areas of an electron-multiplying chargecoupled-device (EM-CCD; ProEM, Princeton Instruments). Scattered laser lines were filtered out by using two notch filters (F1, NF03-532E-25, Semrock; F2, NF03-633E-25, Semrock), and a long-pass filter (F3, LP02-473RU-25, Semrock). The identities of optics are: D2, dichroic mirror (635dcxr,
Chroma); D3, dichroic mirror (740dcxr, Chroma); L1, lens (LA1986-A, Thorlabs); L2, lens (LAO-120.040.0/075, CVI); L3, lens (LAO-260.1-50.0/075, CVI); M, mirror (BB01-E02, Thorlabs). To switch three excitation lasers, we used mechanical shutters (LS-3, Uniblitz). Relatively slow switching time of a mechanical shutter (1.5 ms) didn’t cause any practical problem when an EM-CCD was operated with filming rate below 30 frames per second. To synchronize laser switching with the acquisition of fluorescence images, we made a simple electronic circuit based on flip-flops and multiplexers (Supporting Information Figure 2).
Data correction. Before FRET analysis, all data were corrected as follows. To generalize the discussion of correction steps, we use indices to indicate FRET probes and detection channels in the increasing order of emission peaks. So, in this paper, the first, the second, the third dyes, and the fourth dyes correspond to Cy2 (or Alexa488), Cy3, Cy5, and Cy7, respectively. Thus the following symbols are: I iraw , raw intensity of the ith detection channel after background subtraction I ieff , fluorescence intensity of the ith dye detected in the ith detection channel I itot , total fluorescence intensity of the ith dye detected in the all detection channels.
The first data correction step was background subtraction. Next we corrected the bleedthrough between detection channels. We define l ij as the bleedthrough parameter of the ith dye into the jth detection channel. For example, l12 denotes the ratio of Cy2 (or Alexa488) fluorescence signal detected in the second detection channel to that of Cy2 (or Alexa488) signal detected in the first detection channel. Specifically, l1i can be determined from the ratios of I i'' I 1'' when every dye is photobleached except Cy2 (or Alexa488). The other coefficients can be determined in the same way. By assuming no bleedthrough from the longer wavelength dyes into the shorter wavelength detection channels, we get the following expressions.
I1raw I1eff
(1)
I 2raw l12 I1eff I 2eff
(2)
I 3raw l13 I1eff l23 I 2eff I 3eff
(3)
I 4raw l14 I1eff l24 I 2eff l34 I 3eff I 4eff
(4)
By solving the equations above, we obtained the following equations.
I1eff I1raw
(5)
I 2eff I 2raw l12 I1eff ' I 2raw l12 I1raw
(6)
I 3eff I 3raw l13 I1eff l23 I 2eff I 3raw l13 I1raw l23 ( I 2raw l12 I1raw )
(7)
I 4eff I 4raw l14 I1eff l24 I 2eff l34 I 3eff I 4raw l14 I1raw l24 ( I 2raw l12 I1raw ) l34 [ I 3raw l13 I1raw l23 ( I 2raw l12 I1raw )]
(8)
Next, we obtained I itot by adding back the bleedthrough signals into the proper detection channels as follows. I1tot I1eff l12 I1eff l13 I1eff l14 I1eff (1 l12 l13 l14 ) I1raw
(9)
I 2tot I 2eff l23 I 2eff l24 I 2eff (1 l23 l24 )( I 2raw l12 I1raw )
(10)
I 3tot I 3eff l34 I 3eff (1 l34 )[ I 3raw l23 I 2raw (l13 l12l23 ) I1raw ]
(11)
I 4tot I 4eff I 4raw l34 I 3raw (l24 l23l34 ) I 2raw (l14 l12l24 l13l34 l12l23l34 ) I1raw
(12)
To correctly calculate the FRET efficiency of each FRET pair, we should consider the differences in emission quantum yields of fluorophores, and the detection efficiencies of the detection channels, which can be corrected as follows, a step called the gamma correction. I1* I1tot
(13)
I 2* 12 I 2tot
(14)
I 3* 13 I 3tot
(15)
I 4* 14 I 4tot
(16)
~ ~ , where ij is the ratio of I i to I j , during a conformational change or photobleaching and I i* is the intensity of ith dye after gamma correction. After gamma correction, the intensity of each fluorophore is normalized as the intensity of first fluorophore. Therefore only 12 , 13 , 14 terms are needed for gamma correction. The final correction step is subtraction of direct excitation of acceptors. In FRET experiments, it is ideal for each laser to excite only one fluorophore which behaves as a donor in the excitation condition. This is a good approximation for green laser excitation as the absorption of Cy5, and Cy7 at 532-nm are just 3 % and 2 % of their peak values, respectively. However, the absorption of Cy3 at 473-nm and Cy7 at 633-nm or 640-nm is not negligible. Therefore, I 2 at 473-nm laser excitation and I 4 at 640-nm laser excitation are contributed by both FRET and the direct absorption of the excitation. The direct excitation of acceptor dyes must be corrected to determine reliable FRET efficiency. Based on absorption spectrum, the ratio of Cy3 intensity at 473-nm laser excitation to intensity of 532-nm laser excitation is a constant. Therefore, we defined the direct excitation coefficient at 473-nm laser d b which is the ratio of I 2,b to I 2, g after the photobleaching of Cy2. This coefficient refers to the intensity ratio of Cy3 at 473-nm and 532nm lasers. We can then remove the direct excitation part of Cy3 intensity at 473-nm laser excitation by following the equations below. It is important to notice that the direct excitation coefficient must be determined in each measurement because the coefficient also changes when the intensity of laser changes.
I 2,b I 2*,b db I 2*, g
(17)
I3,b I3*,b db I3*, g
(18)
I 4,b I 4*,b db I 4*, g
(19)
For the direct excitation of Cy7 by a red laser, we used a method different from what was used for the direct excitation of Cy3. We assumed that the ratio of the direct absorption of Cy7 to the absorption of Cy5 is conserved after gamma correction, and thus Cy7 fluorescence due to the direct absorption proportional to the sum of Cy5 and Cy7 fluorescence at 640-nm laser excitation. Because the Cy7
fluorescence when Cy5 is photobleached comes only from the direct excitation of Cy7, we can obtain 640-nm laser direct excitation coefficient d r which is defined as the ratio of I 3,r I 4 ,r before Cy5 photobleaching to I 3, r I 4 ,r after Cy5 photobleaching. Then the direct excitation portion of Cy7 at 640nm laser excitation can be determined by following equation.
I 4, r I 4*, r dr ( I3*, r I 4*, r )
(20)
FRET calculation Interaction diagrams of four fluorophores are shown in Figure 1a. The identities of symbols used there include: Gi, the excitation rate of the ith dye; ki, intrinsic decay rate of the ith dye; kij, the rate of FRET from the ith dye to the jth dye; R0,ij, the Förster distance of the corresponding FRET pair; Rij, the distance between the ith dye to the jth dye. In this notation, the FRET efficiency from the ith dye to the jth dye is expressed as follows. We assumed that following intensities were already corrected as the correction steps described above section. Eij
k ij k i k ij
1 1 ( Rij R0,ij )
6
(21)
From rate equations, fluorescence intensities at red excitation are written as follows.
I 3, r
k3 G3 k 3 k 34
(22)
I 4,r
k 34 G3 k 3 k 34
(23)
In rigorous forms, the quantum yield and the detection efficiency of the first dye should be multiplied to the right side of the above equations, but these common proportional factors are omitted here for simplicity. By solving the equations above, we obtain E34 as follow
E34
I 4, r 1 1 k3 k34 1 I 3,r I 4,r 1 I 3,r I 4,r
At green excitation, fluorescence intensities of Cy3, Cy5, and Cy7 are written as follows.
(24)
I 2, g
k2 G2 k 2 k 23 k 24
(25)
I 3, g
k3 k 23 G2 k 3 k 34 k 2 k 23 k 24
(26)
I 4, g [
k 34 k 23 k 24 ]G2 k 2 k 23 k 24 k 3 k 34 k 2 k 23 24
(27)
By solving the equations above and using E34 obtained at 640-nm laser excitation, we obtain E23 and E 24 as follows.
E23
E24
I 3, g k 23 k 2 1 k 23 k 2 I 2, g (1 E34 ) I 3, g I 4, g E34 ( I 3, g I 4, g ) I 2, g I 4, g E34 ( I 2, g I 3, g I 4, g )
(28)
(29)
At blue excitation, fluorescence intensities of all dyes are written as follows.
I1,b
k1 G1 k1 k12 k13 k14
(30)
I 2 ,b
k2 k12 G1 k 2 k 23 k 24 k1 k12 k13 k14
(31)
I 3, b
k3 k13 k 23 k 12 [ ]G1 k 3 k 34 k1 k12 k13 k14 k 2 k 23 k 24 k1 k12 k13 k14
(32)
I 4,b [
k14 k 24 k 12 k1 k12 k13 k14 k 2 k 23 k 24 k1 k12 k13 k14
k 34 k13 k 23 k12 [ ]]G1 k 3 k 34 k1 k12 k13 k14 k 2 k 23 k 24 k1 k12 k13 k14
(33)
By solving the equations above and using Eij ’s obtained at red and green excitations, we obtain the remaining FRET efficiencies as follows.
E12
E13
I 2,b (1 E23 E24 ) I1,b I 2,b I1,b ( E23 E24 ) ( I1,b I 2,b ) E23 E24 I 3,b E23 ( I 2,b I 3,b ) I 2,b E23 E34 I1,b I 3,b E23 ( I1,b I 2,b I 3,b ) I1,b E34 ( I1,b I 2,b ) E23 E34
(34)
(35)
E14
I 2,b E24 (1 E23 )(1 E34 ) I 3,b E34 (1 E23 )(1 E24 ) I 4,b (1 E23 )(1 E24 )(1 E34 ) ( I1,b I 4,b )(1 E23 )(1 E24 )(1 E34 ) I 2,b E24 (1 E23 )(1 E34 ) I 3,b E34 (1 E23 )(1 E24 )
(36)
The Holliday junction experiments
To construct the Holliday junction, we purchased the following DNA sequences (written from 5’ to 3’) from Bioneer (Daejeon, South Korea). b-strand: Cy2-CCCTAGCAAGCCGCTGCTACGG h-strand: Cy3-CCGTAGCAGCGCGAGCGGTGGG-Cy7 r-strand: biotin-CCCACCGCTCGGCTCAACTGGG-Cy5 x-strand: GGGCGGCGACCTCCCAGTTGAGCGCTTGCTAGGG The Holliday junction was annealed by mixing b-strand (5 μM), h-strand (2.5 μM), r-strand (1.25 μM), and x-strand (2.5 μM) in 10mM Tris-HCl (pH8.0) with 50mM NaCl, and slowly cooling from 90 °C to 4 °C for 2 hours. For single-molecule measurements, the Holliday junction was immobilized on glass surface by successive addition of biotinylated BSA (40 μl, 1 mg/ml, Sigma-Aldrich), streptavidin (40 μl, 0.2 mg/ml, Invitrogen), and the Holliday junction. Each addition was incubated for 5 minutes, and followed by washing with TN buffer (10 mM Tris with 50 mM NaCl). After checking that fluorescent spots were well separated from one another, we injected 60 μl of imaging buffer (10 mM Tris-HCl (pH 8.0) with 2.5mM PCA (SigmaAldrich), 50nM PCD (Sigma-Aldrich), 1 % (v/v) Trolox (Sigma-Aldrich))[1], and 100 mM magnesium ions. Experiments were performed at 20 °C. Laser intensities were ~15 uW (473nm), ~10 uW (532nm), ~5 uW (633nm). Three excitation lasers were alternatively switched every 20 milliseconds, and fluorescence signals were synchronously detected.
Strand exchange experiments
The following DNA strands were purchased from Integrated DNA Technologies (IDT).
K70+: CTTACCGAACTGAACTCTGGCTAATGTCTAAATGAACGTCGCGGGTGATCTGAATATC AATCTCTAAGCT K70-: Alexa488-AGCTTAGAGATTGATATTCAGATCACCCGCGACGTTCATTTAGACATTAGCC AGAGTTCAGTTCGGTAAG-Cy3 K70+ top 18: C-Cy7dT-TACCGAACTGAACTCTGGCTAATGTCTAAATGAACGTCGCGGGTGAT CTGAATATCAATCTCTAAGCTGCCTC GCTGCCGTCGCCA 5' biotin bottom 18 3' Cy5: Biotin-TGGCGACGGCAGCGAGGC-Cy5 The oligonucleotides were annealed by heating to 90 ºC and cooling the mixture to room temperature over a period of 90 minutes. The duplex DNA was purified from any excess single strand oligos that might be present using a native 12 % PAGE gel. This procedure ensured that only the duplex was available for interacting with the immobilized template DNA during the strand exchange reaction. The template DNA strand was immobilized by annealing with the bottom 18 DNA sequence which has a biotin at the terminal end. Acceptor labeled partial duplex DNA molecules (Figure 3a) were immobilized on a Polyethylene glycol (m-PEG-5000; Laysan Bio Inc.) and 1-2 % biotinylated PEG (biotin-PEG-5000; Laysan Bio Inc.) passivated quartz slide (Finkenbeiner) surface at concentrations ranging from 100- 150 pM. The attachment was mediated by a biotin- streptavidin (Sigma) interaction between the biotinylated DNA, streptavidin and biotin-PEG. The coating of the quartz imaging surface with PEG[2] eliminated effects due to non-specific binding of proteins. After washing away excess of acceptor molecules, the immobilized DNA was incubated with 1μM RecA (New England Biolabs) and 1 mM ATPγS (Calbiochem) in our incubation buffer (25 mM Tris- Acetate pH 7.5, 100 mM Sodium Acetate and 1 mM Magnesium Acetate). After incubating for 15 minutes to ensure complete filament formation on the immobilized DNA molecules, a mixture of homologous duplex DNA (about 500 pM- 1nM) and 1 mM ATPγS suspended in the strand exchange buffer (25 mM Tris Acetate pH 7.5, 100 mM Sodium Acetate, 10 mM Magnesium Acetate) with an oxygen scavenging system (1 mg/mL glucose oxidase, 0.8 % glucose, 0.04 mg/mL catalase and 3 mM Trolox) was flowed into the chamber. Imaging was initiated as soon as the buffer exchange was completed. All measurements were carried out at room temperature
(23±1 °C). Excitation of two donors, Alexa488 and Cy3, was carried out by alternation of 473-nm and 532-nm lasers in prism-type TIRF microscopy. Laser intensities were ~150 W/cm2, ~120 W/cm2, respectively. Fluorescence images were acquired at every 30 milliseconds, but because two lasers are alternatively used for successive frames, the effective time resolution for the measurements was 60 milliseconds.
Reference
[1] C. E. Aitken, R.A. Marshall, J. Puglisi, Biophys. J. 2008, 94, 1826–1835. [2] R. Roy, S. Hohng, T. Ha, Nat. Methods 2008, 5, 507-516.