Supporting Information
Controlled photonic manipulation of proteins and other nanomaterials Yih-Fan Chen,†,
†
,§
Xavier Serey, Rupa Sarkar,# Peng Chen,# and David Erickson*,†,§
Kavli Institute at Cornell for Nanoscale Science, Cornell University, Ithaca, New York 14853, USA
Medical Device Innovation Center and Department of Biomedical Engineering, National Cheng Kung University, Tainan 701, Taiwan §
Sibley School of Mechanical and Aerospace Engineering, School of Applied and Engineering Physics,
and # Department of Chemistry and Chemical Biology, Cornell University, Ithaca, New York 14853, USA
1
Methods Device fabrication. Devices were fabricated on silicon wafers that have a 3.5 µm- thick thermal oxide layer. A 250 nm-thick stoichiometric silicon nitride layer was deposited on the top of the silicon dioxide layer using the low-pressure chemical vapor deposition (LPCVD) process. The ma-N 2403 electron beam photoresist was spun on the wafer and then was patterned using a JEOL 9300 electron beam lithography system. The silicon nitride layer was then etched with the ma-N 2403 mask using an inductively coupled plasma reactive ion etching (ICP RIE) system, Oxford 100. Then, the lift-off process was used to create a patterned silicon dioxide layer, which is 3µm- thick and was deposited using a magnetron sputtering deposition system, CVC 601, to cover the entire wafer except the area where the resonators were located. Sample preparation. 22-nm fluorescent polymer particles (Thermo Scientific) and streptavidin-coated QDs (Life Technologies) were suspended in 1X phosphate buffered saline solution (PBS) and 50 mM borate buffer solution (pH 7.4), respectively. Wilson disease proteins were suspended in HEPES buffer solution (60 mM HEPES, 110 mM NaCl, pH 7.4). Each of the three buffer solutions mentioned above also contained 0.05% (v/v) Tween 20 surfactant to reduce nonspecific binding. In addition, an oxygen scavenging system that consists of 50 nM protocatechuate-3,4-dioxygenase (PCD) and 2.5 mM protocatechuic acid (PCA) was introduced into the buffer solution right before each optical trapping experiment to increase the stability of fluorescent dyes. The Wilson disease proteins used in this study, WD14, is a truncated and mutated version1. It contains only the first four N-terminal metal binding domains that can acquire copper from the copper chaperone Hah1. The molecular weight of WD14 is ~46 kDa. Considering each metal binding domain is ~2-3 nm in diameter, the size of the protein WD14 is estimated to be ~10 nm. Each protein contains two cysteine residues that were labeled with a mixture of Cy3 and Cy5, and each protein contains maximally two Cy3 or Cy5 dyes. However, since the filter cube used in the fluorescence microscope was for observing Cy5
2
but not Cy3, only Cy5 dyes were observed in the setup. A mercury arc lamp was used to excite the fluorescence of Cy5 dyes. Flow chamber preparation. To make the flow chamber, two access holes were made on a coverslip using a CO2 laser system, and then Tygon tubing was attached to the holes through PDMS fixtures. Then, the coverslip, the fabricated chip, and the parafilm spacer, which has a cut-out for the flow channel between the holes, were sandwiched together and briefly baked to create a sealed chamber. The dimensions of the cross section of the flow chamber were about 2 mm by 100 µm. During optical trapping experiments, a syringe pump was used to inject buffer solutions into the chamber via Tygon tubing. Before introducing particles into the flow chamber, the chamber was first incubated with PBS solution that has 1 mg/ml casein for ~20 minutes to prevent nonspecific binding. Optical trapping experiments. A 1064-nm fiber-coupled high power diode laser (LU1064M400; Lumics, El Segundo, CA) was used to provide the light source for optical trapping. Laser light was coupled into silicon nitride waveguides through a lensed fiber. The temperature of the laser diode was adjusted to fine-tune the center wavelength of the laser diode, which shifts 0.3 nm per degree centigrade. Images were captured on an upright fluorescence microscope equipped with a Hamamatsu ORCA-ER CCD camera. A mercury arc lamp was used to excite the fluorescence of fluorescent polymer particles, QDs, and Cy5-labelled proteins. To measure the power coupled into the resonator, light emitting from the end of the waveguide being used is focused by a lens onto a detector of a power meter. When calculating the power, the lightgathering efficiency of the detection setup and the fact that the polarization of light is not perfectly TE are taken into account.
3
Simulation and data analysis. The analysis of the Brownian motion of 22-nm polymer particles was performed using the Video Spot Tracker software developed by CISMM at UNC Chapel Hill. The FIONA kernel of the Video Spot Tracker software was used to for particle tracking. The measured standard deviations were corrected for the effect of the integration time of the CCD camera on the measurements of the particle motion2,3. The trapping stiffness is calculated through the equipartition theorem
(1 2 ) k BT = (1 2 ) k
x 2 , where kB is the Boltzmann constant, T is the absolute temperature, k is the stiffness
of the optical trap, and x is the displacement of the particle from its equilibrium position. The threedimensional FDTD simulation was carried out using FDTD Solutions (Lumerical Solutions, Inc.), and the finite-element analysis was done using COMSOL Multiphysics (COMSOL, Inc.). The decay of the fluorescence intensity of the Wilson disease protein was determined using ImageJ software (US National Institutes of Health).
4
Movies Erickson_movie1.mpg: Trapping and release of fluorescent 22-nm polymer particles on silicon nitride PhC resonators. A 22-nm polymer particle is propelled by the optical scattering force towards the center of the cavity while it is trapped on the resonator surface. The 22-nm polymer particle is released from the resonator when the laser is switched off.
Erickson_movie2.mpg: Trapping and release of fluorescent 22-nm polymer particles on silicon nitride photonic crystal resonators. It is the zoomed in version of movie 1.
Erickson_movie3.mpg: Trapping and release of quantum dots on silicon nitride photonic crystal resonators. Quantum dots (QDs) flowing in the channel are observed under the mixed fluorescence/nearinfrared imaging mode. As time increases, more QDs are trapped on the optically excited resonator, and the scattered 1064-nm light increases with the number of the trapped QDs. The intense light in the location of the resonator is the scattered laser light.
Erickson_movie4.mpg: Trapping and release of Wilson disease proteins on a silicon nitride photonic crystal resonator. Cy5-labeled Wilson disease proteins are trapped when they arrive at the vicinity of an optically excited resonator. The fluorescence intensity of the Cy5-labeled proteins decreases over time because of photobleaching. The proteins are released from the resonator when the laser is switched off.
Erickson_movie5.mpg: Trapping of Wilson disease proteins on a silicon nitride photonic crystal resonator. Cy5-labeled Wilson disease proteins are trapped when they arrive at the vicinity of an optically excited resonator. The fluorescence intensity of the Cy5-labeled proteins decreases over time because of photobleaching.
5
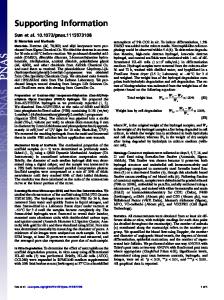
Calculation of the thermophoretic free energy of a 22-nm polymer particle The transport of species in microchannels is perturbed by the presence of a heat source. The flow lines are modified by the buoyancy forces arising from the temperature increase. The pathlines of molecules in solution is deviated from the flow lines because of thermophoresis. We describe the transport of 22 nm polystyrene beads in terms of energy in order to compare the thermal effects to the trapping energy potential that is known to be deeper than 10kBT because of the stable trapping we observed experimentally. Thermophoresis is the phenomenon by witch solutes migrate in response to temperature gradients. It is described by the equation of migration, uT = − DT ∇T ,
where uT is the thermophoretic speed, DT is the thermophoretic coefficient and T is the temperature. The thermophoretic coefficient encompasses complex physical phenomena that are still being investigated4. It has been shown to greatly vary with the species, the buffer and the temperature5-7. Because of these difficulties, no universal expression of the forces involved in thermophoresis has been proposed to this point. In order to compare thermophoresis to other forces present in the system, we use a local equilibrium approach that is valid when the following condition is satisfied7: ( a × ST )∇T ≤ 1,
where a is the hydrodynamic radius of the particle and ST is the Soret coefficient, defined as the ratio DT / D, with D the diffusion coefficient. The temperature T was first computed for both silicon nitride and silicon resonators assuming 6 mW of power coupled to the cavity. From the temperature profile, we verified that for 22 nm beads (ST = 0.02 K-1)7, this condition is satisfied in both resonators. The local equilibrium assumption therefore holds and it is legitimate to calculate the free energy associated to the thermophoretic repulsion. 6
In order to compute the free energy, we solved the diffusion convection equation for 22 nm beads in the system. The solution, a concentration profile in the micro channel and around the resonator was related to the free energy through a Boltzmann equation: −F (r)
c ( r ) = c0 e
k BT
.
Where c(r) and F(r) are respectively the concentration and free energy at location r, c0 is the bulk concentration, and kB is the Boltzmann constant.
References (1) Wernimont, A. K.; Yatsunyk, L. A.; Rosenzweig, A. C. J. Biol. Chem. 2004, 279, 12269-12276. (2) Mandal, S.; Serey, X.; Erickson, D. Nano Lett. 2010, 10, 99-104. (3) Wong, W. P.; Halvorsen, K. Opt. Express 2006, 14, 12517-12531. (4) Wurger, A. Rep. Prog. Phys. 2010, 73. (5) Hammack, A.; Chen, Y. L.; Pearce, J. K. Phys. Rev. E 2011, 83. (6) Iacopini, S.; Rusconi, R.; Piazza, R. Eur Phys J E 2006, 19, 59-67. (7) Duhr, S.; Braun, D. Proc. Natl. Acad. Sci. USA 2006, 103, 19678-19682.
7