Staten Island Community District 2

See SI 2's profile online

Neighborhoods1: Arrochar, Bloomfield, Bulls Head, Chelsea, Concord, Dongan Hills, Egbertville, Emerson Hill, Grant City, Grasmere, Heartland Village, Lighthouse Hill, Manor Heights, Midland Beach, New Dorp, New Dorp Beach, New Springville, Old Town, South Beach, Todt Hill, Travis, Willowbrook PO P U L ATI O N & D E N S I T Y

Hospitals and Clinics

22

3

25

Click to visit the NYC Facilities Explorer

M E A N C O M M U T E T O W O R K 4, 8

41 minutes

Staten Island 43 minutes

NYC 40

minutes

E D U C AT I O N A L AT TA I N M E N T 4 , 1 0

Staten Island CD 2

32%

of residents 25 years or older have earned a bachelor's degree or higher

a nd A v

y Exw

Bay St S

Miller Field

SI 3

yR bo m A

d

Hylan B lvd

Se av iew

Rd

42

Staten Island CD 2

c kl

Victory Blvd

ll Hi

Public Schools

Parks

Ro

Ex wy

SI 1

Av

FDR Beach

Lower New York Bay

Fort Wadsworth

Click here for a more detailed land use map of Staten Island CD 2

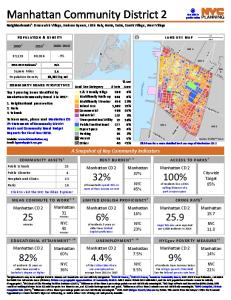
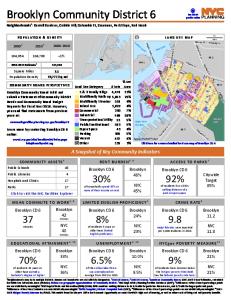
A Snapshot of Key Community Indicators

CO M M U N I T Y A S S E T S 5

Public Libraries

ur th Ar

Rd Kill

Av

Website: www.cb2si.com Email: [email protected]

30% 3% 1% <1% 5% 1% 7% 10% 26% <1% 17% <1%

ot uen Hug

To learn more, please read Staten Island CD 2's Statements of Community District Needs and Community Board Budget Requests for Fiscal Year 2018.

Is

Av Forest Clo ve Rd

d on m

1. Street flooding 2. Traffic 3. Transit (buses & subways)

1 & 2 Family Bldgs 29,825 Multifamily Walk-up 531 Multifamily Elevator 20 Mixed Use 309 Commercial 790 Industrial 87 Transportation/Utility 127 Public/Institutional 186 Open Space 219 Parking 172 Vacant 2,365 Other 54

ten

ch Ri

Top 3 pressing issues identified by Staten Island Community Board 2 in 2017:

v rA eke Me Sta

v kA v Yor nd A Po Lily

Land Use Category

ond T er

Manor Rd

COMMUNITY BOARD PERSPECTIVES

% Lot # Lots Area

Br

WS hor e

21.3 6,197/sq mi

Richm

Rd

133,508

als

w Ne

Square Miles Population Density

Go eth

Upper New York Bay

Rich mo nd

+4%

Bayo nne Br

132,003

Bl v d

127,071

Source: PLUTOTM 16v2

lan

2000-2010

1

Mile

Hy

20103

Richmond Av

20002

2011-2015 Estimate4

LA N D U S E M A P

[

Staten Island 31% NYC 36%

R E N T B U R D E N 4, 6

Staten Island CD 2

45%

of households spend 35% or more of their income on rent

Staten Island 46% NYC 45%

LI M I T E D EN GL I S H P RO FI CI EN C Y 4

Staten Island CD 2

14%

of residents 5 years or older have limited English proficiency

Staten Island 11% NYC 23%

U N E M P L OY M E N T 4 , 1 0

Staten Island CD 2

6.2%

of the civilian labor force was unemployed on average from 2011 to 2015

Staten Island 6.9% NYC 9.5%

A C C E S S TO PA R KS 7

Staten Island CD 2

68%

Citywide Target 85%

of residents live within walking distance of a park or open space

C R I M E R AT E 9

Staten Island CD 2

6.4

major felonies were reported per 1,000 residents in 2016

Staten Island 6.5 NYC 11.8

N YC g o v P O V E R T Y M E A S U R E 1 1

Staten Island CD 2

14%

of residents have incomes below the NYCgov poverty threshold. See the federal poverty rate here.

Staten Island 16% NYC 21%

Neighborhoods may be in multiple districts. Names and boundaries are not officially designated. 22000 US Census; 32010 US Census; 4American Community Survey 2011-2015 5-Year Estimates, calculated for Public Use Microdata Areas (PUMAs). PUMAs are geographic approximations of community districts. 5NYC Dept of City Planning Facilites Database (2017); 6 Differences of less than 3 percentage points are not statistically meaningful. 7NYC Dept of Parks and Recreation (DPR) (2016). DPR considers walking distance to be 1/4 mile for parks less than 6 acres, and 1/2 mile for larger parks and pools. 8 Differences of less than 2 minutes are not statistically meaningful. 9NYPD CompStat, Historic Complaint Data (2017); 10 Differences of less than 2 percentage points are not statistically meaningful. 11 20112015 NYCgov Poverty Measure by PUMA. This metric from the Mayor's Office for Economic Opportunity accounts for NYC's high cost of housing, as well as other costs of living and anti-poverty benefits. 1

Staten Island Community District 2 - GitHub

for Public Use Microdata Areas (PUMAs). PUMAs are geographic approximations of community districts. 5NYC Dept of City Planning Facilites Database (2017); 6 Differences of less than 3 percentage points are not statistically meaningful. 7NYC Dept of Parks and Recreation (DPR) (2016). DPR considers walking distance ...

943KB Sizes 1 Downloads 210 Views

Recommend Documents

Staten Island Community District 3 Basemap - GitHub
LEEDS ST. CUBA AV. THOMAS ST. 8 ST. ISERNIA AV. LEXA PL. VERNON AV. CUNNINGHAMRD. CORBIN AV. NUGENT ST. HEINZ AV. DINTREE. LA. HARRISLA. TARRING ST. CLAWSON ST. BOW. ER. COURT. COTTER AV. WEST. SHO. REEXPY. BALTIMORE ST. AINSWORTH AV. CORTELYOU AV. B

Staten Island Community District 1 Basemap - GitHub
TAPPEN. COURT. NETHERLAND. AV. LIBERTY AV. MILLSAV. PARK HILL AV. DALEMERE RD. COVENTRYRD. SIMONSON AV. ANJALI. LOOP. KINSEY PL. HODGES. PL. FREEDOM AV. VERA ST. GINA. COURT. MAPLE PKWY. GILESPL. KLONDIKE AV. THO. MPSO. N ST. GRASMERE DR. AYMAR AV. C

Staten Island Community District 1 - GitHub
22000 US Census; 32010 US Census; 4American Community Survey 2011-2015 5-Year Estimates, calculated for Public Use Microdata Areas (PUMAs). PUMAs are geographic approximations of community districts. 5NYC Dept of City Planning Facilites Database (201

Staten Island Community District 3 - GitHub
Citywide. Target. 85%. H ylan Blvd. M ain St. M an o r R d. Richm ond Rd. RocklandAv. H u gu en o t A v. Am boy Rd. ArthurKillRd. Richm ond Hill Rd. R ich m o.

Queens Community District 2 - GitHub
for Public Use Microdata Areas (PUMAs). PUMAs are geographic approximations of community districts. 5NYC Dept of City Planning Facilites Database (2017); 6 Differences of less than 3 percentage points are not statistically meaningful. 7NYC Dept of Pa

Bronx Community District 2 - GitHub
for Public Use Microdata Areas (PUMAs). PUMAs are geographic approximations of community districts. BX 2 shares PUMA 3710 with BX 1, and the ACS population estimate cannot be reliably disaggregated. 5NYC Dept of City Planning Facilites Database (2017

Brooklyn Community District 2 - GitHub
for Public Use Microdata Areas (PUMAs). PUMAs are geographic approximations of community districts. 5NYC Dept of City Planning Facilites Database (2017); 6 Differences of less than 3 percentage points are not statistically meaningful. 7NYC Dept of Pa

Manhattan Community District 2 - GitHub
for Public Use Microdata Areas (PUMAs). PUMAs are geographic approximations of community districts. MN 2 shares PUMA 3810 with MN 1, and the ACS population estimate cannot be reliably disaggregated. 5NYC Dept of City Planning Facilites Database (2017

Page 1 Staten Island Community District 2 - Land Use One & Two ...
Jersey. S T A T E N I S L. Is L A N D E X P v | C T O R Y B L V D. * S H O R E EX P Y. W EST S H. William T. Davis. Wildlife Refuge. D A VE. Ocean. Breeze. Park. R I C H M O N O. C H M O N D R D. H Y L A N B L V D. Latourette. Park. Freshkills Park.

Bronx Community District 2 Basemap - GitHub
South. Brother. Island. Rainey. Park. Soundview. Park. Tiffany. Street Pier. Barretto. Point Park. C o n cre te. P lan t P ark. Bronx. River. Parkway. North. Brother. Island. LAFAYETTE AV. HUNTS. PO. INT. AV. BARRETTO. ST. LONGWOOD. AV. BR. UC. KN. E

Brooklyn Community District 2 Basemap - GitHub
E. A. ST. R. IV. E. R. W. ALLABOUT CHANNEL. C o m m o d o re. B arry P ark. Fort. Greene. Park. Cadman. Plaza Park. Columbus Park. B ro o klyn. B rid ge Park. UN. IO. N. ST. UN. IO. N. ST. PEARL ST. VAN BRUNT ST. MARCY AV. 2P. L. M. YRTLE. AV. MANHAT

Queens Community District 2 Basemap - GitHub
JEWEL ST. 61 ST. 54. RD. 63 ST. ECKFORD ST. 58. RD. 60 ST. 72 ST. 35 ST. 53. RD. 57. RD. 59 PL. 34 ST. 54 ST. 48 ST. 34 ST. RUSSELL ST. NEWEL ST. DIAMOND ST. 55. AV. DUPO. N. T. ST. 62 DR. STEINW. AY ST. 61 RD. LO. MBARDY. ST. OLD. LA. 62 RD. 37. RD.

Brooklyn Community District 5 - GitHub
Affordable housing. 2. Cultural facilities & programs. 3. Unemployment. To learn more, please read Brooklyn CD 5's · Statements of Community District Needs · and Community Board Budget Requests · for Fiscal Year 2018. A Snapshot of Key Community Indi

Manhattan Community District 6 - GitHub
16%. 6%. NYC. 23%. Manhattan CD 6. LIMITED ENGLISH PROFICIENCY4 of residents 5 years or older have limited · English proficiency. Manhattan. 14%. 11%. NYC. 21%. Manhattan CD 6 of residents have incomes below the NYCgov poverty threshold. See the fede

Brooklyn Community District 6 - GitHub
Neighborhoods1: Carroll Gardens, Cobble Hill, Columbia St, Gowanus, Park Slope, Red Hook. Brooklyn Community Board 6 did not submit a Statement of Community District. Needs and Community Board Budget. Requests for Fiscal Year 2018. However, you cand

Brooklyn Community District 13 - GitHub
Open Space. Parking. Vacant. Other. 3,563. 1,427. 180. 391. 253. 56. 45. 117. 67. 240. 455. 48. Kings Hwy. BeltPkw y. Bay Pkw y. O ce an. A v. O ce a n. P kw y. BK 11. BK 15. Brooklyn Community District 13. Neighborhoods1: Brighton Beach, Coney Islan

Brooklyn Community District 7 - GitHub
Commercial. Industrial. Transportation/Utility. Public/Institutional. Open Space. Parking. Vacant. Other. 6,500. 3,683. 75. 1,461. 241. 646. 94. 169. 36. 213. 218. 36. 4 A v. G ... Neighborhoods1: Sunset Park, Windsor Terrace. Top 3 pressing issues i

Queens Community District 3 - GitHub
This metric from the Mayor's Office for Economic Opportunity accounts for NYC's high cost of housing, as well as other costs of living and anti-poverty benefits. Land Use Category. % Lot. Area. # Lots. Click here for a more detailed land use map of Q

Queens Community District 5 - GitHub
of residents 5 years or older have limited · English proficiency. Queens. 18%. 20%. NYC. 21%. Queens CD 5 of residents have incomes below the NYCgov poverty threshold. See the federal poverty rate here. NYCgov POVERTY MEASURE11. Queens. 30%. 25%. NYC

Manhattan Community District 4 - GitHub
Page 1. 1%. 6%. 12%. 15%. 13%. 3%. 28%. 10%. 2%. 3%. 6%.

Manhattan Community District 3 - GitHub
E 14 St. EastRiver. MN 6. MN 2. MN 1. Manhattan Community District 3. Neighborhoods1: Chinatown, East Village, Lower East Side, NoHo, Two Bridges. LAND USE MAP. 164,407. 163,277. -1% ... ACCESS TO PARKS7 of residents live within.

Queens Community District 9 - GitHub
Health care services. 3. Senior services. To learn more, please read Queens CD 9's · Statements of Community District Needs · and Community Board Budget ...

Manhattan Community District 10 - GitHub
21%. 22%. 23%. 5%. 1%. 1%. 15%. 6%. 1%. 4%.

Brooklyn Community District 9 - GitHub
12%. NYC. 23%. Brooklyn CD 9. LIMITED ENGLISH PROFICIENCY4 of residents 5 years or older have limited · English proficiency. Brooklyn. 21%. 23%. NYC. 21%. Brooklyn CD 9 of residents have incomes below the NYCgov poverty threshold. See the federal pov