2009 International Conference on Web Information Systems and Mining
SROS: Sensor-based Real-time Observing System for Ecological Research Jie Cheng1, 2, Yuanchun Zhou1, Binglin Wang1, 2, Xuezhi Wang1, Jianhui Li1 1 Computer Network Information Center, Chinese Academy of Sciences 2 Graduate University of Chinese Academy of Sciences
[email protected], {zyc, yulin,wxz,lijh}@cnic.cn
Abstract — The environmental science communities are actively engaged in developing the next generation of large-scale sensor based field observing systems. The challenges that these systems face are listed as below: complexity of sensor data stream processing and effects of web-based real-time data display. In this paper, we utilized the RBNB DataTurbine, an open-source streaming data middleware to improve the reliability of streaming data transportation. By using server push technology, we ensure the stability and effectiveness of web-based streaming data visualization. The results indicate that the system has enhanced the efficiency and performance of field ecological data transportation and visualization. The system is currently used for observation by ecological research scientists at the Institute of Geographic Sciences and Natural Resources Research, Chinese Academy of Sciences.
of data stream processing. Requirements on the cyberinfrastructure include scalable and secure support for real-time data acquisition, reliable data capture and transport, persistent monitoring of numerous data channels and real-time tasking and remote operations. The current RBNB DataTurbine [2][3] streaming data middleware system satisfies a core set of critical infrastructure requirements including reliable data transport, the promotion of sensors and sensor streams to first-class objects, a framework for the integration of heterogeneous instruments, and a comprehensive suite of services for data management, routing, synchronization, monitoring, and visualization. Streaming data middleware provides scientists and system users with richer control over data streams, sources, and sinks. To that end, we have started deploying RBNB DataTurbine at individual ChinaFlux sites. This allows individual sites to perform sensor data acquisition, transport, and dissemination in a scalable and reliable fashion.
Keywords: rbnb; server push; sensor networks; real-time data transportation
I.
We utilized the RBNB middleware for real-time data transportation. Instead of receiving the data from the equipments, we get the newest data from the ring buffer, so that it can make the transportation more steadily and when the network fails to work, it can retransmit the data from the ring buffer. To a better performance of real-time data display, we use the server push technology to push the data into the client from the web server and the performance is very good till now. The rest of the paper is organized as follows: Section 2 shows some related works similar to ChinaFlux project. Section 3 describes the system architecture of SROS. Section 4 describes the design and implementation of our SROS system. Section 5 presents the results in SROS as a real world example. Finally, in section 6, we give a discussion and future work direction.
INTRODUCTION
The Chinese Terrestrial Ecosystem Flux Research Network (ChinaFLUX) [1] is a long-term national network of micrometeorological flux measurement sites that measure the net exchange of carbon dioxide, water vapor, and energy between the biospheres. The ChinaFLUX network includes eight observation sites and encompasses a large range of latitudes, altitudes, climates and species. It relies on the existing Chinese Ecosystem Research Network (CERN), fills an important regional gap and increases the number of ecosystem types in FLUXNET. Each observation site is responsible for collecting the data and sending the data to the synthesis center located in Beijing in real-time. At each observation site, there is an observation server connected with the sensor equipments through a wireless network. Lots of heterogeneous data are generated by sensors and cameras. These large-scale sensor-based observing systems face a number of significant challenges in design and operations, including heterogeneity of instrumentation and complexity 978-0-7695-3817-4/09 $26.00 © 2009 IEEE DOI 10.1109/WISM.2009.87
II. RELATED WORKS In recent years, there are lots of projects related to the real-time data transportation and environment monitoring.
396
COast-to-Mountain Environmental Transect (COMET) [4] to develop a cyberinfrastructure prototype to facilitate the study of the way in which multiple environmental factors, including climate variability, affect major ecosystems along an elevation gradient from coastal California to the summit of the Sierra Nevada. Real-time Environment for Analytical Processing (REAP) [5] is an NSF-funded cyberinfrastructure development project, focused on creating technology in which scientific workflows tools can be used to access, monitor, analyze and present information from fielddeployed sensor networks, for both the oceanic and terrestrial environments, and across multiple spatiotemporal scales. This near real-time environment for analytical processing will provide an open-source, extensible and customizable framework for designing and executing scientific models that consume data streams from sensor networks.
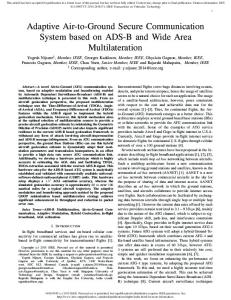
Figure 1 Framework of the SROS system
In filed station, there are many sensors deployed for measuring the exchanges of carbon dioxide, water vapor and energy between terrestrial ecosystem and atmosphere across diurnal, daily, seasonal and inter-annual time scales. These sensors are deployed at the flux tower, the distance between the flux tower and the field station is about 500m.We built the wireless network between these two places, the data generated by dataloggers which are linked with sensors can transmit to the field station’s server and write into the DataTurbine source. We use AXIS cameras on pan-tilt-zoom (PTZ) platforms to record videos about the plant’s growth, this real-time video data will be also transmitted via DataTurbine middleware to the synthesis center. In synthesis center, the DataTurbine sinks read the data from all of the field stations. The flux data and video data are then pushed into the GlassFish [9] server and VLC Media server respectively .By using the server push technique, the data can be pushed into client and presented via web browsers with a high performance. The SROS system includes three main layers: a) Data Collection Layer. This layer is responsible for collecting the data generated by sensors and cameras. In the ChinaFlux project, these data include carbon dioxide, water vapor and heat fluxes between vegetation and the atmosphere in typical Chinese ecosystems and some video data generated by cameras. We use the application programming interface provided by the equipment company to connect to these equipments and collect the data.
The Real-time Observatories, Application, and Data management Network (ROADNet) [6] aims to develop an integrated, seamless, and transparent environmental information network that will deliver geophysical, oceanographic, hydrological, ecological, and physical data to a variety of users in real-time. ROADNet uses data grid technology to solve the challenges associated with management and manipulation of real-time data. US Array [7]. USArray, which is part of the EarthScope experiment, is a 15-year program to place a dense network of permanent and portable seismographs across the continental United States. The seismographs record the energy released by earth movements from the rumbling of cars on the highway to the seismic waves released by the hundreds of earthquakes that occur around the world every day. Some of these projects use data grid [8] technology to transmit and manage the data, such as images, videos, and other data generated in the field ecological data collection. For the different sites have different network conditions, it’s difficult for the observation site to transmit the data to synthesis center located in Beijing through a long distance internet network by using grid technology, so we utilized RBNB DataTurbine middleware to solve this problem and the results proved that its efficiency and performance are good.
b) Data Transportation Layer. Lots of data need to transmit to the central server to preserve and visualization. Instead of receiving the data from the equipments, we get the newest data from the ring buffer, so that it can make the transportation more steadily and when the network fails to work, it can retransmit the data from the ring buffer.
III. SYSTEM ARCHITECTURE The system architecture of the SROS is shown in Figure 1.
c) Data Visualization Layer. There are lots of flux data and video data which are collected in real-time. We use server push and streaming media technologies to display the data and show them via charts and video player. 397
IV. DESIGN AND IMPLEMENTATION
1) Real-time Flux Data Transportation Step 1: Extract the flux data. All the flux data sensors are connected with dataloggers provided by Campbell Scientific Inc [10]. LoggerNet [11] software stores the data in a cache and writes data to ASCII files. We extract the newest flux data from the ASCII file and send them to the ring buffer.
A. RBNB DataTurbine From the perspective of distributed systems, the RBNB DataTurbine is a ”black box” from which applications and devices send data and receive data. RBNB DataTurbine handles all data management operations between data sources and sinks, including reliable transport, routing, scheduling, and security. RBNB accomplishes this through the innovative use of memory and file-based ring buffers combined with flexible network objects. Ring buffers are a programmer-configurable mixture of memory and disk, allowing system tuning to meet application-dependent data management requirements. Network bus elements perform data stream multiplexing and routing. These elements combine to support seamless real-time data archiving and distribution over existing local and wide area networks. Ring buffers also connect directly to client applications to provide TiVo-like services including data stream subscription, capture, rewind, and replay. This presents clients with a simple, uniform interface to real-time and historical data [2] [3].
Step 2: Send the flux data to the central server. Get the newest data from the circular buffer and send them to the central server. If the system fails to transmit the real-time flux data, it will retransmit the data from the circular buffer to the central server when the system starts to work again. Step 3: Data goes to the GlassFish server. After the central server received the flux data, it will redirect these flux data to the GlassFish server and push them into the client and display via web browsers. 2) Real-time Video Data Transportation In the ChinaFlux project, we use the camera AXIS 214 PTZ and it supplies the application programming interface so that we can use the API to control this camera. Step 1: Get the video stream. We use the AXIS API to get the mjpg format video stream from the video camera, and store them in the ring buffer in the field station server.
Naming and addressing: Each data source can have multiple “channels” of data, where channel data are referenced by name and time. Each RBNB server has one or more data sources. Each data source has one or more frames of data. Data frames have one or more data channels, and each channel contains one or more blocks of data per frame. From an external point of view, an RBNB server resembles streams of data that are accessed by timestamp. Data streams are addressed via a three-part naming system of Server / Source / Channel e.g. Server name / QYZ / X-Wind. Data is therefore addressed via a triplet of Name, Timestamp, and Duration.
Step 2: Send the video stream to the central server. Get the newest video data from the ring buffer and send them to the central server. Step 3: Central server redirects the stream to the streaming server. After received the video stream which sent from the field station server, the video stream data will be sent to the streaming media server. The streaming server is used to broadcast the real-time video stream for web users.
Sources: Source clients are “active”, that is they initiate data transmission to the server. Each time a source sends some data to the server, it is called a “frame”. A source can send a sequence of frames to the server. Each frame can consist of one or more named “channels”. Each channel can consist of one or more data points per frame. Increasing the number of points per frame increases efficiency by using larger TCP packets, but adds to the total latency.
3) Real-time Equipment Status Data Transportationt One observation server is connected with tens of thousands sensor and camera equipments. Because we need to assure that these equipments are at the normal status and can detect the abnormal state in real-time, so we have an equipment status monitor module which used to monitor the status of all equipments including the network equipments, camera equipments, sensor equipments. The status data are stored in the observation server database, which can be used to calculate the rate of equipment errors in the future. Because the synthesis center has the right to know each observation site’s status information, these status data stored in database should transmit in time and display by using the Web GIS on the map.
Sinks: Sink clients are “active”, that is they initiate data retrieval from the server. Just as for a source, each time a sink gets frames of data from a server. Each frame consists of one or more named channels, with each channel consisting of one or more data points. A sink requests data by both channel name(s) and timestamp. The data returned to a sink can consist of multiple or partial source frames, depending upon the requested time slice.
B.
398
Server Push
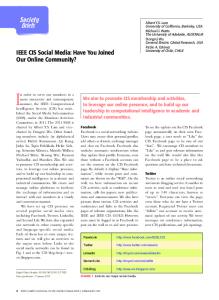
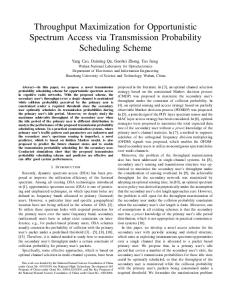
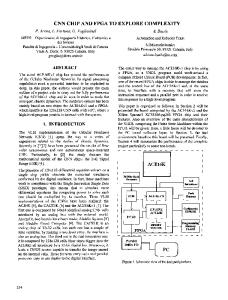
Figure 2 shows that results of using the flash chart to display the real-time flux data which transmitted via RBNB DataTurbine in the ChinaFlux project. We transmitted the flux data from the field station server which is located in Jiangxi province to the central server in Beijing, and then push these data into the GlassFish server and show these data by using flash chart finally. Figure 3 shows the results of using the Web GIS technique to visualize the equipment status data of the Qian Yanzhou field station in Jiangxi province. The map describes the terrain of the field station: the lines on the map represent the local area network, and the buttons represent the network nodes in the network. When some problems happened, we can know the work condition of the network and equipments through the GIS map. Figure 4 shows the results of transmitting the real-time video data generated by the camera from the field station, and the image shows the forest monitoring.
In a traditional web application, the HTML interface is computing by the server at each user’s request. When the user interacts with a link or a button on the page, the server is invoked and a new page is computed and sent back to the client. The role of the browser is simply to intercept the user’s actions, deliver the request to the server, and present a whole new interface even if there is no change compared with last request. In a Rich Internet Application, the client-side logic handles each user interaction updating interface subelements only. Furthermore, when client-server communication is needed to transfer some data, it can be performed in the background, asynchronously, allowing continuous user interaction with the interface. This, together with HTTP/1.1 persistent connections, are the key ingredients of a technique called HTTP trickling, one of the solutions enabling servers to initiate server-to-client communication once a first HTTP request is happened. The programming technique for server-push is also known as “Comet”, relevant implementations are in Cometd, Glassfish, and Pushlets. In particular, the HTTP 1.1 specification states that a browser should not have more than 2 simultaneous connections with a web server. However, holding one connection open for real-time events has a negative impact on browser usability. The browser may be blocked from sending a new request while it still loads, for example, a series of images. This can be worked around by creating a distinct hostname for real-time information, which is an alias for the same physical server. Specific methods of implementing Comet fall into two major categories: streaming and long polling [12]. The GlassFish server includes the Grizzly HTTP Engine, which enables asynchronous request processing (ARP) by avoiding blocking connections. Grizzly's ARP implementation accomplishes this by using the Java NIO API. With Java NIO, Grizzly enables greater performance and scalability by avoiding the limitations experienced by traditional web servers that must run a thread for each request. Instead, Grizzly's ARP mechanism makes efficient use of a thread pool system and also keeps the state of requests so that it can keep requests alive without holding a single thread for each of them [13]. We utilized this technique to push the data in real-time. Unlike client-pull technique by using Ajax, this solution will reduce the load of web server for frequently requested and get a better performance and scalability. When newest data received from the server’s push, we display them on the web browser by using flash chart. The X-axis is the time series, and the Y-axis is the value of each measurement parameter.
Figure 2. The real-time flux data display
Figure 3. The Web-GIS based equipment status display
V. RESULTS
399
REFERENCES [1] GR Yu, XF Wen, XM Sun, BD Tanner, X Lee, JY Chen. Overview of ChinaFLUX and evaluation of its eddy covariance measurement. Agricultural and Forest Meteorology, 2006 [2] Tilak, S.; Hubbard, P.; Miller, M.; Fountain, T. The Ring Buffer Network Bus (RBNB) DataTurbine Streaming Data Middleware for Environmental Observing Systems. IEEE International Conference on eScience and Grid Computing, Volume, Issue, 10-13 Dec. 2007 Page(s):125 - 133 [3] Strandell, E.; Tilak, S.; Hsiu-Mei Chou; Yao-Tsung Wang; FangPang Lin; Arzberger, P.; Fountain, T.; Tung-Yung Fan; Rong-Quen Jan; Kwang-Tsao Shao. Data Management at Kenting's Underwater Ecological Observatory , 3rd International Conference on Intelligent Sensors, Sensor Networks and Information, 2007. Volume, Issue, 3-6 Dec. 2007 Page(s):715 – 720
Figure 4. The real-time video display
[4] “COast-to-Mountain Environmental Transect.” http://comet.ucdavis.edu/wiki/index.php/ Overview_Temp
VI. DISCUSSION AND FUTURE WORK
[5] “Real-time Environment for Analytical Processing.” http://reap.ecoinformatics.org/
In this paper, we proposed a sensor-based real-time observing system for ecological research. We transmitted the real-time flux data and real-time video data from the field station which located in different area of China to the central server to display and store. We used the RBNB DataTurbine technique to transmit the streaming data in real-time and the server push technology to push these data into the client from the web server. The results indicate that the system has enhanced the efficiency and performance of field ecological data transportation and visualization. The contributions of our work include: (1) a generic framework for observing system that supports ecological research work, (2) a friendly used web interface and application that supports real-time flux data display and video display, (3) a Web-GIS based approach to monitor the equipment’s work condition among all of the filed sites in ChinaFlux. Although this paper is on ecological observing system, the solutions are generic to other domains as well. As for future work, we would like to develop a workflow system that supports these real-time data analyses and can be used to access, monitor and present information from field-deployed sensor networks. Moreover, building a robust and scalable equipment management system is our near future plan.
[6] F Vernon, T Hansen, K Lindquist, B Ludaescher. ROADNET: A Real-time Data Aware System for Earth, Oceanographic, and Environmental Applications. Eos Transactions (American Geophysical Union fall meeting [7] C Cotofana, L Ding, P Shin, S Tilak, T Fountain. An SOA-based Framework for Instrument Management for Large-scale Observing Systems (USArray Case Study). Proceedings of the IEEE International Conference on Web Services, 2006 [8] A Chervenak, I Foster, C Kesselman, C Salisbury. The Data Grid: Towards an Architecture for the Distributed Management and Analysis of Large Scientific Datasets. Journal of Network and Computer Applications, 2000 [9] “GlassFish”, https://glassfish.dev.java.net/. [10] “Campbell scientific Inc.” http://www.campbellsci.com/index.cfm. [11] MT Ritsche, DJ Holdridge, R Pearson. New and Improved Data Logging and Collection System for Atmospheric Radiation Measurement Climate Research Facility, Tropical Western Pacific, and North Slope of Alaska Sky Radiation, Ground Radiation, and MET Systems. Fifteenth Atmospheric Radiation Measurement, 2005. [12] http://en.wikipedia.org/wiki/Comet_(programming) [13] Sun GlassFish Enterprise Server v3 Prelude Developer's Guide. http://docs.sun.com/app/docs/doc/820-4496/ggrgt?a=view
ACKNOWLEDGEMENT We would like to thank Professor Honglin He, Wen Su and Wenqing Li from Institute of Geographic Sciences and Natural Resources Research, Chinese Academy of Sciences, for their open idea, discussions and contribution. This work was supported by the Knowledge Innovation Program of the Chinese Academy of Sciences (No.O815021108). 400