Anal. Chem. 1995, 67, 1892-1895
Square-Wave Voltammetric Determination of Uric Acid by Catalytic Oxidation at a Perfluorosulfonated lonomer/Ruthenium Oxide Pyrochlore Chemically Modified Electrode JyhMyng Zen* and Jen-Sen Tang Department of Chemistty, National Chung-Hsing Universiiy, Taichung, Taiwan 402, Republic of China
A Naiionhuthenium oxide pyrochlore (PbzRuz-,Pb,07-,) chemically modified electrode (CME) for the determination of uric acid by Osteryoung square-wavevoltammetry (OSWV) is described. Compared to the glassy carbon electrode, the CME exhibits a 150 mV shift of the oxidation potential of uric acid in the cathodic direction and a marked enhancement of the current response. The best instrumental settings for OSWV are 50 Hz modulation frequency, 20 mV modulation amplitude, and 2 mV step height. finear calibration curves are obtained over the 7.5 x 10⁻⁵-5 x M range in pH 1 buffer solution. The detection limit (34is 1.1 x M. Ascorbic acid in less than 10-fold excess does not interfere. The practical analytical utility is illustrated by selective measurements of uric acid in human urine and serum without any preliminary treatment. Uric acid and ascorbic acid are both present in biological fluids such as blood and urine. Earlier electrochemical based on the oxidation of uric acid at carbon-based electrodes in acidic solutions suffer from interference from ascorbic acid, which can be oxidized at a potential close to that of uric acid. To solve this problem, Wang et al.3 described an adsorption/medium exchange approach in the analysis of uric acid to avoid the interference from ascorbic acid. However, the detection limit is only about 10-j M. On the other hand, various enzyme-based techniques are promising due to their high selectivity, but these methods are inherently more expensive, and there are improvements to be made in the detection limits M) for uric acid reported in the l i t e r a t ~ r e . ~Polymer -~ membrane that can preconcentrate analytes with some selectivity was also used to coat carbon-based electrodes, but the detection limit for uric acid was reported only MS8 More recently, several methods were reported for the detection of uric acid with excellent sensitivity. For example, a sensitive voltammetric method based on controlled adsorptive preconcentration of uric acid on the hanging mercury drop electrode followed by tracing the voltammogram in the cathodic-going potential scan with a detection limit of M (1) Park, G.; Adams, R. N.; White, W. R. Anal. Lett. 1972,5,887. (2) Yao, T.; Taniguchi, Y.; Wasa, T.; Musha, S. Bull. Chem. SOC.JPn. 1978,51, 2937. (3) Wang, J.; Freiha, B. A. Bioelectrochem. Bioenerg. 1984,12, 225. (4) Tatsuma, T.; Watanabe, T. Anal. Chim. Acta 1991,242, 85. (5) Keedy, F. E.; Vadgama, P. Biosens. Bioelectron. 1991,6, 491. (6) Gonzalez, E.; Panente, F.; Lorenzo, E.; Hemandez, L. Anal. Chim. Acta 1991,242, 267. (7) Gilmartin, M. A. T.; Hart, J. P.; Birch, B. Analysis 1992,117, 1299. (8) Rocheleau, M. J.; Purdy, W. C. Electroanalysis 1991,3,935.
1892 Analytical Chemistry, Vol. 67, No. 11, June 1, 1995
was r e p ~ r t e d .However, ~ the interference effect of ascorbic acid was not mentioned. Another improved voltammetric method with an electrochemically pretreated carbon paste electrode, which can tolerate the interference of ascorbic acid up to 3Gfold excess, was reported with a detection limit of 1.2 x M.l0 Unfortunately, a pretreatment procedure was required before each run, and the electrode material was found to be swollen after more than 30 measurements. Overrall, up to now, sensitive and selective methods are still needed to be developed for the detection and determination of uric acid due to its clinical significance. We have recently reported a Nafiodruthenium oxide pyrochlore (PbzRu2-xPbx07-y) chemically modified electrode (CME) for the determination of dissolved oxygen" and hydrazine12with excellent sensitivity. Significant advantages have been achieved by combining the electrocatalytic function of ruthenium oxide pyrochlore with the charge-exclusion and preconcentration features of Nafion. In this paper, this CME is used for the determination of uric acid in real samples by Osteryoung squarewave voltammetry (OSWV) without any preliminary treatment. The experimental conditions for the determination as well as possible interferents, including ascorbic acid, were investigated. The transport characteristics of uric acid in the CME was also discussed. EXPERIMENTAL SECTION
Chemicals and Reagents. Nafion peduorinated ion-exchange powder, 5 wt % solution in a mixture of lower aliphatic alcohols and 10%water, was obtained from the Aldrich Chemical Co. (Milwaukee, WI). Lead nitrate (Pb(N0,)Z) and ruthenium chloride (RuClyxHzO) were also obtained from Aldrich. Uric acid (Sigma), ascorbic acid (Wako), and all the other compounds (ACS certified reagent grade) were used without further puriiication. Aqueous solutions were prepared with doubly distilled deionized water. Apparatus. Electrochemistry was performed on a Bioanalytical Systems (West Lafayette, IN) BAS50W electrochemical analyzer. A BAS Model VC-2 electrochemical cell was employed in these experiments. The three-electrode system consisted of either a glassy carbon electrode (GCE) or a Nafion/ruthenium oxide pyrochlore CME working electrode, a Ag/AgCl reference electrode (Model RE-5, BAS), and a platinum wire auxiliary electrode. Since dissolved oxygen did not interfere with the anodic voltammetry, no deaeration was performed. (9) Gandour, M. A; Kasim, E.-A; Amrallah, A H.; Farghaly, 0. A Talanta 1994, 41, 439. (10) Cai, X.; Kalcher, IC; Neuhold, C.; Ogorevc, B. Talanta 1994,41,407. (11) Zen, J.-M.; Wang, C.-B. J. Electroanal. Chem. 1994,368, 251. Anal. Chem. 1995,67, 208. (12) Zen, J.-M.: Tang, J.3
0003-270019510367-1 892$9.00/0 0 1995 American Chemical Society
T
1
,
1
,
+0.85
+1.00
,
~
,
+0.70
,
,
1
,
+0.55
,
,
+OM
,
,
1
+0.25
,
,
1
+0.10
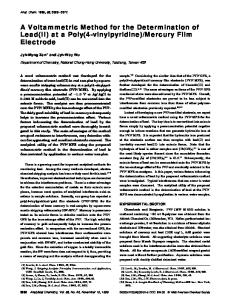
Potentiolfi Figure 1. Linear scan voltammograms (a, d) and Osteryoung M uric acid in pH 1 square-wave voltammograms (b, c) for 5 x buffer solution at the bare GCE (a, b) and at the Nafion/ruthenium oxide pyrochlore CME (c, d). Scan rate, 100 mV/s; SW amplitude, 20 mV; SW frequency, 50 Hz; step height, 2 mV.
Procedure. The preparation of the Nafion/ruthenium oxide pyrochlore CME was described elsewhere.11J2The glassy carbon disk electrode (3 mm diameter, BAS) was polished on a polishing cloth sequentially with diamond of decreasing particle size (15, 3, 1, and 0.05 pm) to a shiny surface. It was then rinsed with deionized water and further cleaned ultrasonically in 1:l nitric acid and deionized water successively. Dependence of the anodic peak current of uric acid on pH at the Nafion/ruthenium oxide pyrochlore CME was evaluated using the following buffer mixtures: KCl HC1 @H 1-2), HCl KHP @H 3-5), and Nar HP04 NaHZP04 @H 6). The Nafion/ruthenium oxide pyre chlore CME was equilibrated in the test buffer solution containing uric acid before measurement. Osteryoung square-wave voltammograms were obtained by scanning the potential from 0.1 to 1.0 V vs Ag/AgCl at a square-wave frequency of 50 Hz and squarewave amplitude of 20 mV. At a step height of 2 mV, the effective scan rate is 100 mV/s. The uric acid quantitation was achieved by measuring the current of the oxidation peak after background subtraction. For most of the experiments, a pH 1buffer solution was used as supporting electrolyte. Urine samples were obtained from laboratory personnel, while the blood sample was donated by a local hospital. After being filtered through membrane filters (0.45 pm), all samples were stored in the dark at 4 "C. In order to fit into the linear range, all samples used for detection were diluted by 100 times. The standard addition method was used to evaluate the content of uric acid in samples.
+
+
+
RESULTS AND DISCUSSION
VoltammetricBehavior of Uric Acid. The catalytic function of the Nafion/ruthenium oxide pyrochlore CME is demonstrated in Figure 1for 5 x M uric acid recorded at a bare GCE and the Nafion/ruthenium oxide pyrochlore CME by OSWV and linear scan voltammetry 0. On scanning from +0.10 V toward a positive potential at a clean GCE in LSV, a very small anodic peak at $0.80 V vs Ag/AgCl was observed (curve a), whereas some improvement in the activity of the electrode toward the oxidation of uric acid was achieved by measuring in the OSWV mode (curve b). A large increase in the peak current, however, was observed
when the Nation/ruthenium oxide pyrochlore CME was used in LSV (curve d) and particularly in OSWV (curve c) . The enhanced current response is clear evidence of the catalytic effect of the Nafion/ruthenium oxide pyrochlore CME toward uric acid oxidation. In addition, two important evidences for the catalytic reaction should also be pointed out here. First, a shift in the oxidation potential of uric acid by about 150 mV in the cathodic direction to about +0.65 V vs Ag/AgCl was observed at the Nafion/ ruthenium oxide pyrochlore CME. The result of lowered overpotential is once again a good indication of the catalytic effect. Second, the current response at the GCE is rather broad, while it is sharp and well defined at the CME, indicating an acceleration of the electron transfer reaction. Since the detection in the OSWV mode was more sensitive than that in LSV, OSWV was used in the subsequent analytical experiments. Further investigation was made into the transport characteristics of uric acid in the Nafion/ruthenium oxide pyrochlore CME. The LSV current response obtained at the CME was found to be linearly porportional to the square root of the scan rate, which illustrated that the process was diffusion controlled. Further evidence for the nonadsorptive behavior of uric acid was demonstrated by the following experiment. When the CME was switched to a medium containing only pH 1buffer solution after being used in measuring a uric acid solution, no voltammetric peak signal was observed at all. Effect of pH on the Voltammetric Oxidation of Uric Acid. The pH range is critical for the Nafiorhthenium oxide pyrochlore CME in the determination of dissolved oxygen and hydrazine,11J2so the effect of pH on the voltammetric oxidation of uric acid was studied. The results obtained are shown in Figure 2. As can be seen (Figure 2A, dash line), the current response is virtually constant for pH > 3 and starts to increase rapidly for pH < 3. Apparently, uric acid gives a better response in the acidic environment; the stronger the acidic medium, the better the performance of the CME. Interestingly, the trend of the peak potential (Figure 2A, solid line) is exactly opposite to that of the peak current. The peak potential is fairly constant for pH < 3 and starts to shift linearly toward negative potentials with an increase in pH (-60 mV/pH). The fact that the peak potential is fairly constant between pH 1 and 3 indicates that the proton is not directly involved in the rate determinationstep of the catalytic reaction. As the dissociation constant, pKa, is 5.40 at 25 "C for uric acid,13the abrupt break around pH 3 apparently is not directly related to the dissociation. Instead, this phenomenon may have somethingto do with the genuine property of the oxide pyrochlore toward the catalytic reaction. For comparison, Figure 2B shows the results reported in our previous study on the dissolved oxygen determination with the same CME in solutions of various pH. As can be seen, the trend of curve in Figure 2A is similar to that in Figure 2B. Apparently, the same catalytic mechanism of the ruthenium oxide pyrochlore is in operation in both cases. Part of the conclusions in previous studies can therefore also be applied here. It has been shown that the hydroxyl radical species are generated on the 0-oxygen site in acidic solutions; the stronger the proton activity at the catalyst surface, the greater the a ~ t i v i t y . ~ ~Here, J ~ J ~the 0-oxygen site refers to the oxygen on (13) Dean, J. A. Lange's Handbook of Chemistry; McGraw-Hill Inc.: New York, 1973. (14) Zen, J.-M.; Manoharan, R; Goodenough, J. B.J. Appl. Electrochem. 1992, 22, 140.
Analytical Chemistry, Vol. 67, No. 11, June 1, 1995
1893
1
* ,6
700
R
500-
4
400-
A
/I I\
T
1P-4
2"
I
600-
8 a
$' , , , & 0 0 200 3 0
1
2
3
4
5
6
7
PH
a I , , , , , , , , , , , ) +1.00
+OB5
+0.70
+0.55
+O.M
Peak potential / V
1
I
Figure 3. Dependence of the OSWV peak current on increasing (c) 1 x (d) 2.5 uric acid concentrations of (a) 0, (b) 5 x x and (e) 5 x M. Supporting electrolyte was pH 1 buffer solution. SW parameters as in Figure 1.
O 0
2
4
6
8
10
12
14
PH Figure 2. (A) dependence of the anodic peak current (dashed line, right scale) and peak potential (solid line, left scale) on pH in OSWV M uric acid at the Nafionhthenium oxide pyrochlore for 5 x CME. SW parameters as in Figure 1. (6)Data from ref 11 are shown for comparison. OSWV peak current of oxygen reduction obtained at the same CME in solutions with different pH values.
the B sites of the general oxide pyrochlore A Z B ~ O ~ Ostructure. 'I-~ Hence, the abrupt break around pH 3 is the point where the hydroxyl radical at the catalyst starts to be generated. The hydroxyl radicals then accelerate or electrocatalyze oxidation of uric acid. The amount of radical generated in pH 1 solution is much more than that in pH 3 solution. As a result, a much higher catalytic current was observed in pH 1solution. In the mean time, it is reasonable to suspect that the rate determination step for the catalytic reaction is the reaction between the radical and uric acid. Further study in this direction is currently underway. Effect of SquareWave Parameters and Calibration Curve. The peak current obtained in OSWV is dependent on various instrumental parameters such as square-wave amplitude, squarewave frequency, and step height. These parameters are interrelated and have a combined effect on the response, but here only the general trends will be examined. It was found that these parameters had little effect on the peak potential. When the square-wave amplitude was varied between 10 and 50 mV, the peak currents increased with increasing amplitude. However, the peak width was also increasing at the same time, in particular when the amplitude was greater than 20 mV. Hence, 20 mV was chosen as the square-wave amplitude. The step height together with the frequency defines the effective scan rate. Hence, an increase in either the frequency or the step height results in an increase in the effective scan rate. The response for uric acid (15) Zen, J.-M.; Wang. C.-B. J. Electrochem. Soc. 1994, 141, L51.
1894 Analytical Chemistry, Vol. 67,No. 7 1, June 1, 1995
increases with square-wave frequency up to 50 Hz, above which the peak current was unstable and was obscured by a large residual current. By fixing the frequency at 50 Hz, the effect of step height could be studied. At step heights greater than 8 mV, too few points are sampled, thus affecting the reproducibility of the detection, whereas at a step height of 2 mV, the response is more accurately recorded. Overall, the optimized parameters can be summarized as follows: square-wave frequency,50 Hz; squarewave amplitude, 20 mV; step height 2 mV. The effective scan rate is 100 mV/s. Under optimum conditions, the OSWV current response is linearly dependent on the concentration of uric acid between 7.5 x and 5 x M in pH 1buffer solution with slope (uA/pM), intercept @A),and correlation coefficient of 0.080, 0.0079, and 0.9998, respectively, as shown in Figure 3. The detection limit (30) is 1.1 x M. Interference Effect Various possible interfering substances, such as urea, purine, glucose, sucrose, and ascorbic acid, were examined for their effects on the determination of uric acid. All the species except ascorbic acid do not interfere with the determination for up to >1000-fold excess. This is clearly demonstrated in Figure 4,which shows the observed voltammograms for 5 x M uric acid with (curve bj and without (curve a) the existence of urea, purine, glucose, and sucrose M each). It is well known that ascorbic acid coexists with uric acid in lots of samples; therefore, its interference was investigated in more detail. Figure 5 shows Osteryoung square-wave voltammograms of uric acid in the presence of different concentrations of ascorbic acid. Evidently, the current responses of uric acid and ascorbic acid are separated with a potential difference of 150 mV; the CME actually responds much better to uric acid. It can be seen in Figure 5 that, although the detection of ascorbic acid by the CME is not as sensitive as that of uric acid, simultaneous determination of uric acid and ascorbic acid by the CME is possible. Since the acceptable tolerance of ascorbic acid concentration for the determination of uric acid is at least as high as a
Table 1. Determination of Uric Acid in Real Samples with the NafionlRuthenium Oxide Pyrochlore CMEa
detctd value (mg/L)
spike (mg/L)
recovery
sample
(%I
total value6 (mg/L)
urine 1 urine 2 urine 3 serum
4.39 i 0.06 4.60 i 0.06 4.28 i 0.03 0.21 f 0.01
4.20 4.20 4.20 0.42
99.4 f 0.3 101.7 f 0.3 99.0 f 0.1 93.4 f 2.7
438.8 f 6.1 459.5 f 5.6 428.2 f 2.9 20.5 f 0.6
Conditions as in Figure 3. Number of samples assayed, 6. Total value is obtained by multiplying the detected value and the dilution factor.
b
l
,
+1.00
,
,
r
+0.85
,
,
,
,
1
+0.70
,
1
+ O S
,
,
1
+O.N
,
,
,
+0.25
1
+O.lO
Potentiol/V Figure 4. (a) OSWV response for 5 x M uric acid. (b) Same as the sample in (a) but after addition of urea, purine, glucose, and M each) at the Nafionhuthenium oxide pyrochlore sucrose (1 x CME. Other conditions as in Figure 3.
n
T
1P-4
with the method presented above. In order to fit into the linear range, all the samples used for detection were diluted by 100 times. The dilution process can actually help in reducing the matrix effect of real samples. The results obtained are listed in Table 1. In order to ascertain the correctness of the results, the samples were spiked with certain amounts of uric acid in about the same concentrationsas found in the samples themselves. The recovery rates of the spiked samples were determined to be between 99.0 and 101.7%for urine and 93.4% for serum. Note that the uric acid concentrationsfound in urine and serum samples are fairly close to those reported elsewhere? The fact that the recovery rate for the serum sample is not as good as that for the urine sample might have something to do with the existence of proteins, as indicated in our previous study.12 Finally, most important of all, the stability of the Nafion/ ruthenium oxide pyrochlore CME was also evaluated. The CME shows an excellent long-term stability. No decrease in uric acid response with regard to either peak potential or peak current was observed after the electrode was repeatedly used and stored in 1 M NaOH solution for more than 2 months. Furthermore, since the process is diffusion controlled, as discussed previously, the response time for the CME is very fast. All the measurements were done immediately after the CME was immersed into the test samples. CONCLUSIONS
This study has demonstrated that Nafiodruthenium oxide pyrochlore CME can be applied to the detection of uric acid in OSWV with excellent sensitivity and selectivity. Significant advantages have been achieved by combining the electrocatalytic function of the ruthenium oxide pyrochlore with the chargeexclusion and preconcentration features of Nafion. The reliability and stability of the Ndodruthenium oxide pyrochlore CME offer a good possibility for extending the technique to routine analysis of uric acid in real samples. +1.W
+0.85
+0.70
+OS5
+OM
+0.25
+O.lO
Potentiol/V Figure 5. OSWV response for 5 x M uric acid after addition of (a) 0, (b) 2.5 x (c) 5 x and (d) 7.5 x M ascorbic acid at the Nafionhthenium oxide pyrochlore CME. Other conditions as in Figure 3.
l@fold excess, the method is applicable to various biological samples. Sample Analysis. Three human urine samples from laboratory personnel and one human serum sample were determined
ACKNOWLEDGMENT
The authors gratefully acknowledge financial support from the National Science Council of the Republic of China under Grants NSC 842732-M-005001and NSC 84-2113-M-005415. Received for review November 28, 1994. Accepted March 21, 1995.@ AC941147+ Abstract published in Advance ACS Abstracts, May 1, 1995.
Analytical Chemistry, Vol. 67, No. 11, June 1, 1995
1895