INDIA BFSI Ltd. (SQS) SQS Upgraded to BUY | TP Increased to Rs.1,053
Previous Current CMP : Rs.794 Rating : BUY Rating : HOLD Target : Rs.1,053 Target : Rs.665 STOCK INFO THINKSOFT Bse Nse SQSBFSI SQSI IN Bloomberg Reuters THIN.BO Sector IT‐Software 10 Face Value (Rs) Equity Capital (Rs mn) 103 Mkt Cap (Rs mn)‐Full 8,386 842/508 52w H/L (Rs) Avg Daily Vol (BSE+NSE) 43,166 SHAREHOLDING PATTERN (as on Sep. 2015) Institutions Others, Incl Public Promoters
In 1HFY16, the company’s performance improved significantly (+15.8%
Y/Y) relative to same period last year. The revenue growth was broad based largely delivered by key geographies and verticals. In 1HFY16, verticals like Cards & Payments (+12.0%), Banking (+13.3%), and Insurance (+87.2%) demonstrated growth; partially offset by 30.9% de‐ growth in Capital Markets. Europe delivered above company average revenue growth (+36.6%) followed by Asia (7.9%) in 1HFY16. However, the performance in N.America continues to remain lacklustre (25.1% de‐growth in 1HFY16 v/s 1HFY15). The integration between parent and SQS India remains on the track. In our view, these are the early sign of integration actual benefit and J‐Curve type growth should be visible in FY17E.
%
4.4 41.1 54.5
1m 20 ‐4
3m 19 0
12m 33 ‐9
Source: Capitaline, IndiaNivesh Research
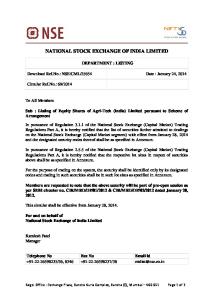
SQS v/s SENSEX 150 140 130 120 110 100 90
SQS
Sensex
Source: Capitaline, IndiaNivesh Research
06/11/2015
07/10/2015
07/09/2015
08/08/2015
09/07/2015
09/06/2015
10/05/2015
10/04/2015
11/03/2015
09/02/2015
10/01/2015
11/12/2014
80
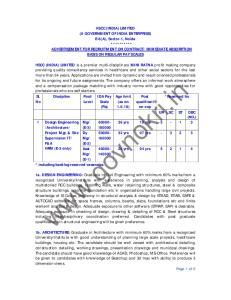
Revenue Growth (% Q/Q)
15.0%
14.1% 10.8%
10.0%
10.0% 2.6%
5.0% 0.0% Q1FY16
Q1FY15
Q2FY16
Q2FY15
Source: Company Filings; IndiaNivesh Research
Daljeet S. Kohli Head of Research Tel: +91 22 66188826
[email protected] Amar Mourya Research Analyst Tel: +91 22 66188836
[email protected]
IndiaNivesh Research
Revenue growth trajectory improved significantly…
Source: BSE
STOCK PER. (%) SQS BFSI Bse Sensex
11/11/2014
November 16, 2015
As mentioned in our initiating coverage (Dated: 7‐4‐2014) Integration with parent is the potential game changer for SQS India BFSI Ltd (SQS). The combination started yielding positive results in the form of following: (1) Strong revenue growth, (2) Improving utilization level, (3) Consistent improvement on margin front, and (4) Growth in key vertical and geography. As a result, we increase our TP to Rs.1,053 from Rs.665 and upgrade our rating to BUY from HOLD on the stock.
Company Update
Improving margin profile… SQS margin profile improved consistently and touched the five quarter
high of 21.7% in Q2FY16. The key drivers were better consultant utilization, higher onsite ratio, and efficient overhead cost management. Additionally, the company’s strategy to terminate low margin clients and focus on long‐term (managed testing services) high margin Europe, US, and Australia contracts boosted the overall margin. The incubation of automation should further bode well on EBITDA margin going‐ahead. The management target 300 bps improvements on utilization front (from 72% FY15 to 75%) in near‐to‐medium‐term, which could lead to further expansion in EBITDA margin. IndiaNivesh Securities Limited|Research Analyst SEBI Registration No. INH000000511 601 & 602, Sukh Sagar, N. S. Patkar Marg, Girgaum Chowpatty, Mumbai 400 007. Tel: (022) 66188800 IndiaNivesh Research is also available on Bloomberg INNS, Thomson First Call, Reuters and Factiva INDNIV.
SQS India BFSI Limited (SQS)….Upgraded to BUY | TP Increased to Rs.1053
EBITDA Margin Trend (%) 19.7%
Q1FY15
20.7%
Q4FY15
21.7% 19.1%
Q3FY15
17.1%
17.3%
Q4FY15
Q1FY16
Q2FY16
Increasing Utilization Level (%) 74.0% 69.0%
70.0%
67.0% 65.0% 62.0%
Q1FY15
Q2FY15
Q3FY15
Q4FY15
Q1FY16
Q2FY16
Source: Company Filings; IndiaNivesh Research
Network effect started triggering… After becoming the part of parent, SQS started seeing substantial ramp‐up in SQS BFSI Europe revenue. The integration led to increase in sales team from mid‐single digit to low‐ triple ‐digit in Europe region. Further, joint‐go‐to‐market strategy led to increase in order magnitude. Additionally, the parent’s strategy to build employee base of 8,000‐10,000 at group level and large proportion of billable staff in offshore destinations, illustrates that bulk of such expansions could come in India. Europe Contr. (as % of Rev)
Europe (Q/Q Gr %) 69.1%
50.0% 48.4%
48.0%
Q1FY16
Q2FY16
47.1% 45.8%
14.5% 5.8%
2.7%
11.6% 42.1%
‐17.0% Q1FY15
Q2FY15
Q3FY15
Q4FY15
Q1FY16
Q2FY16
Q1FY15
Q2FY15
Q3FY15
Q4FY15
Source: Company Filings; IndiaNivesh Research
BASF India Ltd. (contd...)
November 16, 2015 | 2
SQS India BFSI Limited (SQS)….Upgraded to BUY | TP Increased to Rs.1053
Large‐Size Advantage After become the part of leading testing company, we expect significant increases in revenue profile on back of premium deal‐size going ahead. The combine strength will allow SQS BFSI to qualify for large size (request for proposal) RFP’s and enhance the client mining opportunity. This could lead to significant expansion in average revenue per client/employee going‐ahead. On back of 910 employee strength, SQS BFSI is strategically placed to expand its presence in high growth US & Europe markets. Further, the recent acquisition of Trissential LLC (US) and Galmont (US) strengthens SQS BFSI presence in this geography.
Revenue Trend (Rs Mn) 11.0 0.7 10.5
0.6
0.6
0.7
0.7
0.6
0.8 0.7 0.6
10.0
0.5
9.5
0.4 9.0 9.6
8.5
10.4
10.0
9.0
8.8
8.0
0.3 0.2
9.1
0.1
7.5
‐ Q1FY15
Q2FY15
Q3FY15
Per Client Rev (Rs Mn)
Q4FY15
Q1FY16
Q2FY16
Per Employee Rev (Rs Mn)
Source: Company Filings; IndiaNivesh Research
Valuations At CMP of Rs.796, the stock is trading at P/E multiple of 19.2x FY16E and 9.1x FY17E earning estimate. The current quarter performance gives the indication of integration benefit through following: (1) Strong revenue growth, (2) Improving utilization level, (3) Consistent improvement on margin front, and (4) Growth in key vertical and geography. The higher revenue growth during 1HFY16 remains the positive surprise. The sustenance of similar performance for medium‐term could lead to significant re‐rating. We upgrade our rating from BUY to HOLD with increase in TP to Rs.1,053 (valuing 12.0x FY17E) from Rs.665 on SQS India BFSI.
BASF India Ltd. (contd...)
November 16, 2015 | 3
SQS India BFSI Limited (SQS)….Upgraded to BUY | TP Increased to Rs.1053
Income Statement
Balance Sheet
Y E March (Rs m)
FY13
FY14
FY15
FY16e
FY17e
Y E March (Rs m)
FY13
FY14
FY15
FY16e
Net sales
1,614
1,944
2,142
2,782
5,395
Share Capital
101
103
106
106
106
Y/Y Ch %
32.9
20.4
10.1
29.9
93.9
Reserves & Surplus
781
980
913
1,210
1,822
Net Worth
882
1,082
1,018
1,316
1,927
COGS
966
1,182
1,361
1,648
2,827
Minority
0
0
0
0
0
SG&A
347
365
365
486
1,222
Long‐term loans
114
96
73
73
73
EBITDA
FY17e
302
397
416
647
1,345
Others
0
0
‐1
0
0
134.7
31.6
4.6
55.7
107.9
Total Liabilities
996
1,179
1,090
1,389
2,000
18.7
20.4
19.4
23.3
24.9 Gross Block
457
483
511
845
1,492
Interest
15
20
16
13
13
Less Depreciation
146
202
254
310
403
Deprecaition
46
57
52
56
93
Net Block
312
281
257
535
1,089
1 0
0 0
0 0
0 0
0 0
10
6
7
7
7
Y/Y Ch % EBITDA Margin %
EBIT
241
320
347
578
1,239
EBIT Margin %
14.9
16.5
16.2
20.8
23.0
24
102
Capital Work in Progress Investments Defered tax (net)
Other Income (Inc Forex)
Extra Ordinary Exps/(Income)
0
0
‐27 17 16
0
0
Others
12 25 3 4 8
0
PBT
265
422
320
595
1,255
Current Assets
952
1,157
1,383
1,533
2,233
Tax
70
122
104
167
377
Sundry Debtors
413
558
567
731
1,417
26.6
28.9
32.4
28.0
30.0
Cash & Bank Balance
387
502
684
631
487
Loans & advances
151
97
132
171
329
0
0
0
0
0
Current Liabilities
170
195
254
292
566
Provisions
119
95
306
397
770
Effective tax rate % Reported PAT
194
300
216
428
879
Y/Y Ch %
70.8
54.5
‐28.0
98.0
105.1
Forex Gain
10 77 ‐45 ‐
‐
Others
Adj. PAT (APAT)
184
223
261
428
879
Net Current Assets
663
867
823
844
897
RPAT Margin %
11.4
11.5
12.2
15.4
16.3
Total assets
996
1,179
1,090
1,389
2,000
183.2
21.4
16.8
64.2
105.1
Y/Y Ch %
Source:Company filings; IndiaNivesh Research
Source:Company filings; IndiaNivesh Research
Cash Flow
Key Ratios
Y E March (Rs m)
FY13
FY14
FY15
FY16e
FY17e
Y E March
FY13
FY14
FY15
FY16e
Operaing Profit
255
340
364
591
1,252
Adj.EPS (Rs)
18.0
21.9
25.5
41.9
86.0
Depreciation
46
57
52
56
93
Cash EPS (Rs)
23.6
34.9
26.3
47.4
95.1
Interest Exp
‐15
‐20
‐16
‐13
‐13
2
60
275
‐57
‐185
Changes in Working Capital Cash Flow After Chang in WCapital
289
437
674
577
1,147
Tax
‐70
‐122
‐104
‐167
‐377
Others
DPS (Rs) BVPS
FY17e
5.9
9.0
6.5
12.8
26.2
87.1
106.0
99.2
128.4
188.2
ROCE %
25.6
28.9
33.3
42.5
62.6
ROE %
22.0
27.8
21.3
32.7
45.7 35.1
0
0
0
0
1
ROIC %
24.6
22.8
22.8
29.8
Cash flow from operations
219
316
570
411
772
EBITDA Margin %
18.7
20.4
19.4
23.3
24.9
Capital expenditure (net)
‐279
‐82
‐80
‐334
‐647
Net Margin %
11.4
11.5
12.2
15.4
16.3
Free Cash Flow
‐60
234
490
77
124
PER (x)
41.8x
27.1x
37.6x
19.0x
9.3x
Other income
0
0
0
0
0
P/BV (x)
9.2x
7.5x
8.0x
6.2x
4.2x
0
0
0
0
0
Cash flow from investments
Investments
‐279
‐82
‐80
‐334
‐647
Long‐Term Debt (Decrease) Increase
114
‐17
‐21
0
0
Dividend paid (incl tax)
‐60
‐81
‐66
‐130
‐268
‐7
‐19
‐220
1
0
Share Issue / Repurchase & Others
P/CEPS (x)
33.8x
22.8x
30.3x
16.8x
8.4x
EV/EBITDA (x)
26.0x
19.8x
18.9x
12.1x
5.8x
Dividend Yield %
0.4 0.7 1.1 0.8 1.6
m cap/sales (x)
5.0x
4.2x
3.8x
2.9x
1.5x
net debt/equity (x)
‐0.3x
‐0.4x
‐0.6x
‐0.4x
‐0.2x ‐0.3x
Cash flow from Financing
47
‐117
‐307
‐129
‐268
net debt/ebitda (x)
‐0.9x
‐1.0x
‐1.5x
‐0.9x
Net change in cash
‐13
117
183
‐53
‐143
Debtors (Days)
73
91
96
96
96
Cash at the beginning of the year
401
387
502
684
630
Creditors (Days)
37
34
38
38
38
Cash at the end of the year
387
502
684
630
487
Cash Conversion Cycle (Days)
36
57
58
58
58
Source:Company filings; IndiaNivesh Research
Source:Company filings; IndiaNivesh Research
BASF India Ltd. (contd...)
November 16, 2015 | 4