Japanese Psychological Research 2000, Volume 42, No. 1, 69-75 Special Issue: Brain images and cognitive functions
Spatial and temporal variations in eye-fixation-related potentials' AKIHIRO VAGI, KOJI KAZAI and VUJI TAKEDA Department of Psychology, Kwansei Gakuin University, Uegahara, Nishinomiya 662-8501, Japan
Abstract: When electroencephalograms (EEGs) are averaged at eye fixation pauses (at the end of saccades), the specific brain potentials related to the visual information processing can be obtained. This eye-fixation-related potential (EFRP) is a type of event-related potential. In this paper, the authors introduced two systems developed at their laboratory. The first measured the distribution of EFRPs on the scalp with DC amplifiers in order to nullify eye movement artifacts. Three-dimensional EFRP topographies were obtained. The most prominent component (lambda response) of the waveform appeared at occipital sites. The second system was designed to examine the variation in EFRPs over time, using a sliding average method. The dynamic variation in EFRPs could be observed as an animation. The sequence of variations in amplitude was continuously displayed on a screen. This indicated the process of decrease and recovery of the lambda response generated by changes between periods of brightness and darkness. Key words: EEG, ERP, eye movement, cognition, topography.
Event-related potentials (ERPs) have been used as an index of psychological factors, including perception and attention (Hillyard & Picton, 1988). However, there are few studies of ERPs at eye movement situations, because of eye movement artifacts in measuring ERPs. The authors, however, have found a specific ERP that can be recorded while manipulating eye movements. When a person looks at something, the eye movement record shows a step-like pattern consisting of saccades and eye fixations. The saccadic suppression occurs during the saccade (Latour, 1962). Therefore, information on the visual object is sent from the retina to the brain during the eye fixation pause, not during the saccade. We can obtain a specific ERP
associated with the occurrence of eye fixation pauses by averaging data starting with the termination of a saccade (Yagi, 1979). This specific ERP is referred to as the eye-fixationrelated potential (EFRP). The EFRP has several characteristics in common with the visual evoked potential (VEP) and the ER~ EFRP changes with the physical properties of the stimulus (Kazai & Yagi, 1999; Yagi, 1995) and some psychological factors (Yagi, 1981, 1996). In order to analyze the topographical distribution of ERPs and to estimate the location of ERP dipoles, EEGs are often measured from sites over the whole head. For both the topographical analysis and the dipole estimation, corresponding EEGs need to be measured at various sites, including frontal regions.
1 The present study was supported by the Ministry of International Trade and Industry, and the New Energy and Industrial Technology Development Organization's project on "Human Sensory Measurement Application Technology".
© 2000 Japanese Psychological Association. Published by Blackwell Publishers Ltd, 108 Cowley Road, Oxford OX4 1JF, UK and 350 Main Street, Maiden, MA 02148, USA.
70
A. Yagi, K. Kazai, and Y. Takeda
However, the EEG may be distorted by eye movement artifacts if the EEG is measured using the usual AC amplifier. When a saccade occurs, the baseline of the EEG record at the frontal sites is shifted according to the size of the saccade. The EEG is usually amplified by an AC amplifier with a low-frequency cutoff filter to reduce slow changes in the potential. Whenever a sudden shift occurs in the EEG baseline, the shift in the AC recording is automatically returned to the former base, corresponding to the time constant of the amplifier (Figure lA). However, the returning itself distorts the ERP waveform in the frontal regions. Therefore,
A
EGG
~
Measurement of the EFRP spatial distribution
EEG
ACAmp.
~~~~:::=::::=:--:--
Superimposed AC waveforms at offset of saccades
B EGG
Superimposed DC waveforms at offset of saccades Figure 1.
eye movements are restricted in such ERP studies. The use of a DC amplifier can overcome this limitation. The first purpose of the present paper is to introduce a method of measuring EFRP from many regions on the scalp by using DC amplifiers to investigate spatial variations in the EFR~ Perception and attention are very dynamic in real life. However, detection of temporally dynamic variations in ERPs is difficult, because repeated averaging of the EEG signals is required. A saccade occurs three or four times a second. Therefore, one averaged EFRP can be obtained in approximately eight seconds. A sliding average method makes it possible to obtain a series of EFRP signals changing over time. The second purpose of the present paper is to introduce a system that shows these dynamic changes in the EFR~
Illustrations of EEG recordings with an AC amplifier and a DC amplifier. (A) EOG and EEG recordings with an AC amplifier. (8) EOG and EEG recordings with DC amplifiers. The inset patterns indicate superimposed EEG epochs collected at the termination of saccades.
© Japanese Psychological Association 2000.
As mentioned above, EEGs must be amplified with DC amplifiers to enable multichannel measurement of the EFR~ This is a high-technology solution, because with multichannel measurements, in particular, there is drift in the DC amplifier recordings. However, the sudden shifts of the DC potential by saccades can be canceled by averaging across the termination of the saccades. If the beginning point of EEG epochs are adjusted to the onset of eye fixations and EEG epochs are averaged (Figure lB), the EFRP can be obtained from electrodes on the whole head, without distortion. Test of the system
A black-and-white (1 cd/m 2 and 20 cd/m 2 ) checkerboard pattern was presented on a cathode ray tube display (CRT) (28° x 28°; at a refresh rate of 100 Hz). The check size was 40/. The fixation targets were two green spots (13' in diameter, 12 cd/m2), which were placed at 3° to the right and to the left of the center of the checkerboard on the screen. The saccade size was therefore 6°. Fixation points were placed at the crossing points of four cells.
71
Spatial and temporal variations in eye-fixation-related potentials
The disposition of white and black cells surrounding each eye fixation differed between the left and the right fixation points. The subjects were asked to make saccades between the two targets on the checkerboard at the rate of 0.9 Hz. Before the trial, the subjects had a practice session, with the aid of the rhythm of a metronome. A black screen was placed in front of the left eye, so that subjects received the stimulus only through the right eye. After 33 s of trial, a period of rest followed. The trial was repeated four times. The EEGs were recorded from 21 electrodes (Fpl, Fpz, Fp2, F7, F3, Fz, F4, F8, T7, C3, Cz, C4, T8, P7, P3, Pz, P4, P8, 01, Oz, and 02). All were referenced to the left earlobe. A pair of electrodes were placed at the outer canthi of eyes for the horizontal electro-oculogram (EOG) and another pair of electrodes were placed above and below the left eye for the vertical EOG. All signals were amplified with DC amplifiers, and a high-pass cutoff filter was set at 200 Hz. All raw EEGs and EOGs were reviewed off-line before averaging. Averaged potentials were filtered at 50 Hz. The eye movements measured by the EOG were digitized using analog-digital converters. A large deflection in the data was recognized as a saccade except in the case of an eye blink, which was shown by a large pulse in the vertical record. The fundamental concept of detection of an eye fixation pause is as follows. The point at which a large deflection changed into a steady state in the EOG was defined as the onset of an eye fixation pause. The recorded EOG data, however, were contaminated by eye blinks and slow drift. A reduction system for eye blinks and drift was therefore implemented. Further, the effects of a correction saccade and a very brief eye fixation were also eliminated by the system. In the detection of the regular ERPs, EEG epochs time locked to the stimulus onset were averaged many times to increase the signalnoise ratio. In the present experiment, EEG epochs time locked to the onset of the eye fixation pause were averaged 90 times (45 right and 45 left eye movements) in order to detect the EFR~
5~~L
100 ms
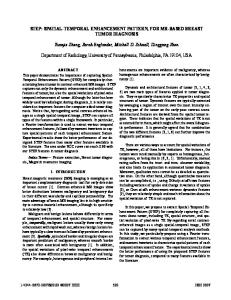
Figure 2.
Example of the distribution of EFRPs on the scalp (subject MN).
Two right-handed men, aged 21 and 26, participated in the experiment. They had normal vision and no history of neurological disorders. Results and discussion
When large drifts of the EEG recording occurred, the data were automatically eliminated. Further, since EEG epochs without drift were selected for averaging, the effect of the drift could be ignored. Figure 2 shows the EFRPs in subject MN recorded at the 21 electrode sites. A large positive component with a latency of about 89 ms was observed predominantly in occipital regions. This component is the lambda response. Figure 3 shows an example of the threedimensional topographies of the potentials with a latency of about 89 ms. The figure is viewed from a left-back position. Figure 4 shows a top view of the topography. The topography clearly indicates that the lambda response appeared predominantly in occipital regions. Similar results were obtained with the other subject (MM). The DC recording allowed dipole estimation of a specific component in the EFR~ In a recent © Japanese Psychological Association 2000.
A. Vagi, K. Kaxai. and Y. Takeda
72
EOG
r\ ~
,
EEG
~" Figure 5.
V' V'
EFRPs
'IV V
Method of sliding averages. Example shows fourfold averaging.
Temporal variations in the EFRp2
Figure 3.
Topography 01 EFRPs with a latency of 86 ms (subject MN) viewed from the left-back position. Red indicates positive potential and blue negative potential.
We can examine the dynamic variation in the lime course of the EFRP using a sliding average method. The lambda response. which is the most prominent positive component. appears predominantly in occipital regions. Since eye movement artifacts are much less salient at the occipital site than at the frontal, the lambda response at occipital regions is available for analysis. In this part of the paper, the method of detecting the dynamic variations in the EFRP is introduced. Sliding average Suppose EEGs are averaged 30 limes to obtain one ERP, Thirty EEG epochs for the first array are collected and averaged from the first epoch for Ihe first stimulus to the Ihirtielh. This is the usual method for obtaining the ERP. For Ihe second array. the data in the first epoch are deleted and the data in the thirty-first epoch are added. A series of EFRPs can be obtained successively by continuing the procedure (Figure 5). The sliding average is different from the so-called moving average for a highfrequency cutoff filter.
Figure 4.
Top view of the topography shown in Figure 3 (subject MN).
study. the authors found that the generation of the lambda response was very similar to that of the visual-evoked potential (Kazai & Vagi, 1998) by using a dipole estimation method. o Japanese f'sycllologlcal AssOOatLon 2000,
Display of the EFRPs When a series of EFRPs is continuously displayed in real time, dynamic changes can be , This seellOn was partially presented at the Sixth International Evoked Potentials Symposium (Yagi & Takeda, 1998!. The authors thank Elsevier Science BV for permission to use some 01 the material here.
Spatial and temporal variations in eye-fIxation-related potentials
observed as an animation. A display of the representative values of the EFRP (e.g., a peak amplitude) allows observation in real time of the temporal change related to psychological factors. The change in the amplitude in the most prominent component was used as the representative value of the EFRP in the present study. The amplitude of the other components, the peak latency of a component, the stability (variability) of the waveform and other indices could have been used alternatively. Test of the system
The system was used to detect the variation in the EFRP while subjects performed a variety of visual tasks: moving their eyes over a stripe pattern; and playing a computer game which required concentration. While the subject moved his eyes over the stimulus pattern, the room light was suddenly turned off. While the subject was playing the computer game, his name was suddenly called and he was asked to stop playing. The EEG was recorded from the occiput (Oz) referred to the left ear. The ground lead was attached to the midline forehead. Eye movements were recorded on the EOG. A pair of electrodes were placed at the outer canthi of the eyes for the horizontal EOG. Another pair of electrodes were placed above and below the left eye for the vertical EOG. The EEG and EOGs were amplified with AC differential amplifiers at a low-frequency time constant of 2 s and a high-frequency cutoff of 30 Hz. The data were digitized every 2 ms and analyzed using the system. EEGs were averaged 30 times to obtain one EFRP sample. A sequence of the representative values of EFRP was displayed in real time on a CRT, as mentioned below. Two right-handed men, aged 22 and 23, participated in the experiment. They were students with normal visual acuity.
73
monitored over 3 s. In parts A and B, the zero point on the horizontal scale indicates the onset of an eye fixation. Numbers on the horizontal axis indicate the sampling point (doubling this number gives the latency from the onset of eye fixation). The lambda response, which was the most prominent component with a latency of about 100 ms (50 samples), appeared very clearly (Figure 6A). In the present study, the amplitude of the lambda response was displayed as a representative value of the EFRP in real time. The representative value was the mean amplitude between 50 ms and 200 ms after the onset of eye fixation. This value was displayed continuously at every trigger point. Part C of Figure 6 shows the sequence of representative EFRP values. The display indicates the temporal variation of the amplitude under the condition in which the illumination level changed. The room light was turned off at 100 and turned on at 160. The white bar indicates the period of darkness, during which the lambda response in the EFRP is seen to disappear. The decrease in the representative value (i.e., amplitude) could be observed in real time. When the light was turned on again at 160, the amplitude is seen to increase again. Since the change in amplitude was displayed in real time, we could observe the temporal variation in the EFR~ The speed of the recovery was slower than that of decrease. When the name of the subject was called during the game, the amplitude also decreased. The decrement is thought to reflect distraction of attention. Similar results were obtained with the other subject (YS). In the present study, the value of each EEG epoch was equivalent. However, the weighted averaging method might allow a reduction in the amount of averaging required. A researcher might then be able to observe more dynamic variation of the EFRP over a shorter period.
Results and discussion
Figure 6 shows examples (from subject HO) of the results displayed on the CRT. Parts A and B show the EFRP and EOG, respectively. Part D shows the concurrent EOG and EEG
General discussion The authors have already applied the EFRP technology to studies of sensation (e.g., Kazai © Japanese Psychological Association 2000.
A. Yagi, K. Kazai, and Y. Takeda
74
x
CH.REW CH.FOW
EPOCH CHANGE
EXP TIMf: 582.8099975595 fJNA TIII£ 5795
Iqlxl
Figure 6.
An example (subject HO) screen shot from the system. (A) The EFHP. The horizontal number indicates a sampling point. Zero indicates the onset of eye fixation. Sampling time is 2 ms. A value of 40 on the yaxis is equivalent to 1 IJV. (B) The EOG. Zero indicates the onset of eye fixation. (C) A sequence of the representative values (amplitude) of EFRP. The data for 579 s are displayed. The room light was turned off at 98 (220 s after the beginning of the trial) and turned on at 160 (360 s after the beginning of the trial). A white bar indicates the period of darkness (140 s). (D) Concurrent EOG and EEG for 3 s. The vertical scales in parts B, C, D are in arbitrary units.
& Yagi, 1999), cognition (e.g., Yagi, 1981), and ergonomics (e.g., Yagi, Imanishi, Akashi, &
Kanaya, 1998). At present, separate systems are used to measure the spatial distribution and the temporal variation of EFRPs, because of the limitations in the speed and memory of the computer. However, the use of a high-powered computer would make it possible to display in real time the distribution of the EFRP on the scalp using the two systems in combination.
References Hillyard, S. A., & Picton, W. T. (1988). Endogenous event-related potentials. In T. W. Picton (Ed.), Handbook of electroencephalography © Japanese Psychological Association 2000.
and clinical neurophysiology (pp. 361-426). Amsterdam: Elsevier. Kazai, K., & Yagi, A. (1998). Location of electric current sources of lambda response estimated by the dipole tracing method. Proceedings of the Second International Conference on Psychophysiology in Ergonomics (pp. 88-89). Nishinomiya: Kwansei Gakuin, PIE '98. Kazai, K., & Yagi, A. (1999). Integrated effect of stimulation at fixation points on EFRP (eyefixation related brain potentials). International Journal of Psychophysiology, 32,193-203. Latour, P. L. (1962). Visual threshold during eye movements. Vision Research, 2, 261-262. Yagi, A. (1979). Saccade size and lambda complex in man. Physiological Psychology, 7, 370-376. Yagi, A. (1981). Visual signal detection and lambda responses. Electroencephalography and Clinical Neurophysiology, 52, 604-610.
Spatial and temporal variations in eye-fixation-related potentials Yagi, A. (1995). Eye fixation related potential as an index of visual function. In S. Tsutsui & K. Shirakura (Eds.), Biobehavioral self-regulation in the east and the west (pp. 177-181). Tokyo: Springer-Verlag. Yagi, A. (1996). Application of eye fixation related potentials in ergonomics. In C. Ogura, Y. Koga, & M. Shimokochi (Eds.), Recent advances in event-related brain potential research (pp. 586592). Tokyo: Elsevier.
75
Yagi, A., Imanishi, S., Akashi, Y., & Kanaya, S. (1998). Brain potentials associated with eye fixations during visual tasks under different lighting systems. Ergonomics, 41, 670-677. Yagi, A., & Takeda, Y. (1998). Variation in ERPs associated with eye fixation determined by sliding average method. In I. Hashimoto & R. Kakigi (Eds.), Recent advances in human neurophysiology (pp. 698-703). Amsterdam: Elsevier.
© Japanese Psychological Association 2000.