Sound insulation evaluation using transfer function measurements Rodolfo Venegasª, Marco Nabucob, Paulo Massaranic a
Departamento de Acústica, Universidad Pérez Rosales, Brown Norte 290, Santiago, Chile b,c Acoustic Testing Laboratory, Inmetro, D. de Caxias, 25 250-020, RJ, Brazil
a
[email protected],
[email protected],
[email protected]
Abstract The regular methods for sound insulation between rooms, audiometric cabins and other adjacent closed spaces deal with average sound pressure measurements and random sound excitation. The acoustic field can be as diffuse as found in reverberation chambers or the well-determined stationary waves filed of rectangular rooms. The use of random noise excitation requires averages in time to reduce the expected inherent uncertainties. The use of new deterministic techniques as MLS or the up graded old sweep sine excitation can avoid such time consuming averaging processes allowing lower measurements uncertainties inherent to deterministic excitation. With the new available front-end devices and signal analysers it is relatively easy to get acoustic transfer function between two points in space, which can be in different closed adjacent enclosures as rooms or cabins. With those transfer functions on the hand it is possible to obtain the level differences required by the international standard, as suggested in the draft document ISO/DIS 18233. This paper shows some results obtained in cabin insulation testing in a reverberation chamber using random noise and sweep sine excitation. Some data for repeatability testing using both methods are also presented. 1. INTRODUCTION Standards methods are being prepared to evaluate cabins performance for audiometric tests in Brazil. A first already document deals with background noise measurements which requires very sensitive equipment and transducers as a function of the expected very low noise levels inside those cabins. To avoid these special instrumentation requirements another technical document is being prepared to evaluate the audiometric cabins using outside/inside sound level differences. With those data it is possible to calculate the noise level inside the cabin if one knows the levels in the room where the cabin is installed.
The classical way to measure level differences uses random noise excitation and space-time average methods. It is expected that the use of random signal to perform those tests can lead to high standard deviation which requires more than one measurement [1] and a greater number of source/microphone positions combination [2]. During last ten years different deterministic methods have been improved to get impulse responses and/or acoustic transfer functions of rooms. A new international standard is being developed to standardise those methods for different room and building acoustics applications. Depending on the approach, or if it is desired to work in the time or frequency domain, it is better to use MLS or Sweep Sine technique respectively, to get the impulse or the frequency response in a specific position in the room. If in the time domain ISO/DIS 18233 [3] suggests to use the Schoroeder energy integration method to get the sound pressure difference level between two rooms. If in the frequency domain the direct transfer function is enough to get the same level differences. This paper describes a method to get those transfer functions from sweep sine technique and shows insulation data for a cabin measured in a reverberation chamber. A comparison with random noise excitation classical method is also presented.
2. GENERAL PRICIPLE In general, the basic principle for sound insulation determination is to identify the level differences that will be corrected for room characteristics represented by its room average reverberation time. As mentioned before, the level differences can be obtained by two different ways: The classical method, which uses random excitation and the transfer function method which uses MLS excitation and a decorrelation technique or sweep sine excitation and deconvolution technique. For all methods the general principle involves level differences, which can be represented by the expression: D = NPS R − NPS C
(1)
where D is the sound level difference between the room and the cabin in dB, NPS R is the space-time average sound pressure level, in dB, in the room where the cabin is and NPS C is the space-time average sound pressure level, in dB, inside the cabin under test. The most general and very simplified definition of a transfer function, H, is the relationship between the input and output of any linear system. For rooms, the input under a general point of view, is the sound source, which includes the signal generation system, power amplifier, loudspeaker and any other device behind the sound source acoustic centre [4]. Following the same understanding the room output includes the microphone, its associated pre-amplifier, its cable and conditioner amplifier and any other accessory which are necessary to the proper microphone operation.
Considering those simple definitions, the acoustic transfer function can be used for average sound pressure level determination in a room as follow. X S2 ( f ) NPS R ( f ) = 10 log[ H R ( f )] + 10 log p 02 2
(2)
where H ( f ) R is the spatial average acoustic transfer function in the room, dB, X S is the room acoustic input, N/m², p0 is the reference sound pressure, N/m² and f is the frequency in Hz.
For a neighbour room or a cabin inside a room, expression (2) can be re-written. NPS C ( f ) = 10 log[ H C ( f )] 2 + 10 log
X S2 ( f ) p 02
(3)
where H C ( f ) is the spatial average acoustic transfer function in the cabin, dB. Subtracting expression (3) from expression (2), the general expression for the sound pressure level difference as a function of acoustic transfer functions can be obtained:
D( f ) = 10 log[ H R ( f )]2 − 10 log[ H C ( f )]2
(4)
The same expression, defined and written much more rigorously in ISO/DIS 18233 [3], is: ⎡∞ 2 ⎢ ∫ H S ( f ) df D = LS − LR = 10 × lg ⎢ −∞ ⎢∞ 2 ⎢ ∫ H R ( f ) df ⎣ −∞
⎤ ⎥ ⎥ dB ⎥ ⎥ ⎦
(5)
where LS is the sound pressure level in the source room, dB, LR is the sound pressure level in the receiving room (cabin), dB, H S ( f ) is the acoustic transfer function between certain microphone and sound source position in the source room and H R ( f ) is the acoustic transfer function between certain microphone position in the receiving room (or cabin) and sound source position in the source room.
3. MEASUREMENT PROCEDURES
A regular audiometric cabin was installed inside a 196 m³ reverberation chamber. Six microphones were installed fixed at required ISO 11957 and ISO 3741 position with respect the sound source, chamber and cabin surfaces. Two microphones were installed inside the
cabin distant 60 cm each other and at 1,2 m from the cabin floor. Two different methods were used to determinate the cabin sound pressure level differences from 100 to 10000 Hz: The classical steady noise method and the transfer function method.
3.1 Classical Steady Noise Method
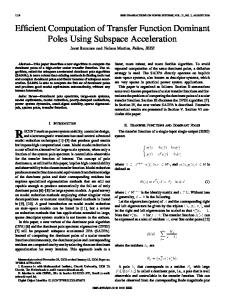
A reverberant sound field shall be generated in the chamber by a loudspeaker (dodecahedron) at least in two different positions. The generated sound level shall be steady and have a continuos spectrum as specified by ISO 11957 [1]. The space-time average room sound level was obtained averaging the sound pressure level during 1 minute and between six fixed microphones. The average cabin sound level was obtained averaging two microphones level during also 1 minute each. The complete measuring system (microphones, its associated pre-amplifier and frequency analyser) was calibrated with a 1000 Hz sound level calibrator every time at new measurement beginning (see Figure 1). The total time of a complete measurement was around 20 minutes. For each trial of three independent measurements, two sound source positions were used. The environmental conditions were measured and remained constant during each set of measurement. The sound level generated into the room was kept around 80 dB for all frequency range of interest to avoid heating the sound source and change its emission characteristics. 3.2 Transfer Function Method
The measuring system was calibrated using the 1000 Hz sound calibrator and the level differences for each microphone recorded and used offline for sound level adjustment. A sweep sine was generated in the room by a dodecahedron and the input signal analysed by Monkey Forest software. The computer controlled the set-up and recorded each microphone transfer functions directly and simultaneously. The total measurement time was around two minutes. The tests were repeated three independent times, always calibrating the equipments.
Figure 1: Classical steady noise method setup
Figure 2: Transfer function method setup
4. EXPERIMENTAL RESULTS
Figure 3 shows a comparison between the spatial sound pressure level standard deviation with the ISO 3741 [2] required values. From the data it is possible to assure that the measurements are valid from 160 Hz up to 10000 Hz.
Spatial Standard Deviation-dB
3,0
2,5
2,0
1,5
1,0
0,5
Classic ISO 11957
8000
10000
6300
5000
4000
3150
2500
2000
1600
1250
800
1000
630
500
400
315
250
200
160
125
100
0,0
1/3 Octave Centre Frequency-Hz
Transfer Function ISO/DIS 18233 ISO 3741
Figure 3: Spatial Standard Deviation: Reverberation chamber for both methods
Figure 4 shows the sound level difference obtained with both methods. The curves fit very well, and the differences between both methods (See Figure 5) are very small.
45 40
30 25 20 15 10 5
10000
8000
6300
5000
4000
3150
2500
2000
1600
1250
1000
800
630
500
400
315
250
200
160
125
0 100
Level Difference-dB
35
1/3 Octave Centre Frequency-Hz
Classic ISO 11957-Mic 60 cm Transfer Function ISO/DIS 18233-Mic 60 cm
Figure 4: Level differences for both methods
10000
8000
6300
5000
4000
3150
2500
2000
1600
1250
1000
800
630
500
400
315
250
200
160
125
100 1,0 0,8 0,6
Level Difference-dB
0,4 0,2 0,0 -0,2 -0,4 -0,6 -0,8 -1,0
1/3 Octave Centre Frequency-Hz
Difference between ISO 11957 and ISO 18233
Figure 5: Difference between the data obtained by the two methods
The tests were repeated three times for each method. Before each test the equipment claim was calibrated. For all tests the measured background noise levels remained below more than 40 dB the generated sound levels in full frequency range of test. Although the sweep sine technique have showed slightly higher values, the repetition standard deviation showed very low values for both methods. Of course it is necessary to test the same cabin in other laboratories and in field conditions to establish a first uncertainty interval.
1,6
Repetition Standard Deviation-dB
1,4
1,2
1,0
0,8
0,6
0,4
0,2
Thre e me asure me nts
Transfer Function ISO/DIS 18233
10000
8000
6300
5000
4000
3150
2500
2000
1600
1250
1000
800
630
500
400
315
250
200
160
125
100
0,0
1/3 Octave Centre Frequency-Hz
Classic ISO 11957
ISO 3741
Figure 6: Three times repetition deviation for both methods
A last test was performed just to check the feasibility to reduce the distance between microphones inside the cabin (See Figure 7). The curves fit very well and suggest that it can be adopted as minimum distance for microphones in the cabin.
45 40
Level Difference-dB
35 30 25 20 15 10 5
8000
10000
6300
5000
4000
3150
2500
2000
1600
1250
800
1000
630
500
400
315
250
200
160
125
100
0
1 /3 O c ta v e C e ntr e F r e q ue nc y- H z
C lassic ISO 1 1 9 5 7 -M ic 3 0 cm T ransfer F u nctio n ISO /D IS 1 8 2 3 3 -M ic 3 0 cm C lassic ISO 1 1 9 5 7 -M ic 6 0 cm T ransfer F u nctio n ISO /D IS 1 8 2 3 3 -M ic 6 0 cm
Figure 7:Sound Level difference for different microphone position inside the cabin
5. CONCLUSIONS
The sweep sine technique showed to be a powerful tool mainly if we consider the necessary time to perform one complete test. At the same time, as it was not performed any test in a regular room where the background noise levels are normally higher than in reverberation chambers, it was not tested the ability of this technique to improve the signal to noise ratio. Tests under filed conditions shall be performed to verify those capabilities. The calibration using the simplest sound calibrator showed to be enough for this investigation propose. Therefore problems at low frequencies [4] can be responsible for the differences verified at frequencies smaller than 160 Hz. To assure higher precision levels it could be necessary to correct the obtained data in all frequencies from the microphone calibration chart.
ACKNOWLEDGEMENTS
Special thanks to Vibranihil Amortecedores de Vibrações to enable the use of one its prototype of audiometric cabin for the tests. REFERENCES [1]
ISO 11957 – Acoustics – Determination of sound insulation performance of cabins – Laboratory and in situ measurements, 1996, 2004
[2]
ISO 3741-Acoustics-Determination of sound power levels of noise sources-Precision methods for broad band sources in reverberation rooms, 2003
[3]
ISO/DIS 18233 – Acoustics - Application of new measurement methods in building acoustics, 2004
[4]
Paulo Massarani, Marco Nabuco, Rodolfo Venegas, Level adjustment for multi-channel impulse response measurements in building acoustics, Proc.34rd Internoise, Rio de Janeiro, Brazil, 2005
[5]
Gilberto Fuchs de Jesus, Rodolfo Venegas, Marco Nabuco, Paulo Massarani, Sound power certification of a dodecahedron shaped sound source, Proc.34rd Internoise, Rio de Janeiro, Brazil, 2005