1
Small Test Systems for Power System Economic Studies Fangxing Li, Senior Member, IEEE and Rui Bo, Member, IEEE Abstract—This paper presents two small test systems for power system economic studies. The first system is based on the original PJM 5-bus system, which contains data related to real power only, because it demonstrates results based on the linearized DC optimal power flow (OPF) model. This paper suggests some modification to the original data, as well as new parameters related to reactive power such that AC-model-based simulation is possible. The second system is based on the original IEEE 30-bus system, which is an AC system, but it does not have economic data such as generation costs and transmission network limits. This paper suggests some reasonable values for generation costs and transmission limits. For both systems, economic studies based on LMP methodology are given for benchmark purposes. Index Terms—Power market, energy market, LMP, DCOPF, ACOPF.
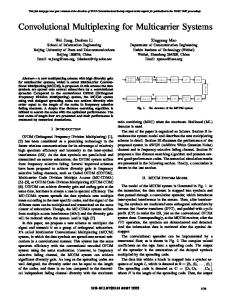
II. PJM 5-BUS SYSTEM A. Original Data from PJM Training Document The PJM 5-bus system [1] was originally published as early as 1999. Several updated versions have been applied in the following years. The basic system configuration and the suggested generation bids, generation MW limits, and MW loads are shown in Fig. 1. More details are presented next. Brighton
E
F. Li is with the Department of Electrical Engineering and Computer Science (EECS), The University of Tennessee, Knoxville, TN 37996, USA. R. Bo was with the Department of EECS, The University of Tennessee, Knoxville, TN, 37996, USA. Contact: F. Li, Email:
[email protected], Phone: 1-865-974-8401.
978-1-4244-6551-4/10/$26.00 ©2010 IEEE
Sundance $40 200MW
Limit = 240MW 400
Alta $14 40MW
C
B
$15 170MW
I. INTRODUCTION CONOMIC studies, especially based on the locational marginal price (LMP) methodology, has become a popular approach for market-based planning. Here, LMP has been implemented or is under consideration at a number of RTOs or ISOs such as PJM, New York ISO, ISO-New England, California ISO, ERCOT, and Midwest ISO. LMP at a given Bus B can be decomposed into three components: marginal energy price, marginal congestion price, and marginal loss price [1-6]. However, there is a lack of standard test systems for power system economic studies, in particular, for LMP-based markets. This paper will discuss two small test systems. The first system is based on the original PJM 5-bus system, which contains real power related data only, since it is based on the linearized DC power flow model. Some possible modifications are suggested as well as a few new parameters are added to address reactive power flow and voltage constraints. The second system is based on the original IEEE 30-bus system, which is an AC system, but lacks economic data and transmission limits. This paper suggests some reasonable values for generation costs and transmission limits. For both systems, economic studies based on LMP methodology are given for possible benchmark in the future.
D
E
$20 600MW
Park City
$30 520MW
Limit =400MW
A
300
Generation Center
300
Solitude
Load Center
Fig. 1. The PJM 5-bus system.
B. Suggested Modification Generation Costs: The PJM online training document series showed several modifications to the generation cost and output of the 5-bus system over the last decade. Mainly, the very original data shows the same generation cost at the Sundance and Solitude buses. This sometimes may be confusing and not straightforward when instructors or trainers need to explain the LMP concept. Although various versions of different values may be applied, here $30/MWh at Solitude and $40/MWh at Sundance are suggested as appropriate values to differentiate them. Generation MW limits: The output limit of the Alta unit is reduced from 110 MW to 40 MW, while the output limit of the Park City unit is increased from 100 MW to 170 MW to give sufficient difference when different loads levels are tested [3-6]. Generation MVAR limits: There is no reactive power limit in the original system. It is suggested that we may use 0.8 power factor from leading to lagging for all units. Line parameters: The PJM training document data include penalty factors at each bus under the base case to calculate LMP loss component. However, there is no description about how the penalty factors are calculated. For simulation studies, line resistances are necessary for researchers to “calculate” the penalty factors or delivery factors, especially for a case
2 modified from the base case. Previous works have assumed line resistance to be 10% of line reactance. Also, here each of the two shunt capacitances of a “pi”-model transmission line is assumed such that we have a reactance value of 104 times the line reactance, i.e., 1/(b/2)=104 x. Line flow limits: The original system shows that only the Line DE has a thermal limit of 240 MVA. Another line flow limit at Line AB is assumed to be 400 MVA. When only real power is concerned, we can simply take 240 and 400 as the MW limit, or take 228 and 380 as MW limit considering 0.95 power factor applied to all line flows. Load: The most recent versions of the PJM 5-bus system show 300 MW load at each of the three load buses, B, C, and D. It is suggested here to use 300 MW, 300 MW and 400 MW for the three loads to have different base-case loads at different busses. Also, a 0.95 lagging power factor is assumed for each bus load. Voltage limit: Each bus is assumed to have 1.1 per unit as the voltage upper limit and 0.9 as the lower limit. In summary, the complete parameters of the system are listed in Tables 1-3. Table 1. Generation Parameters
Gen. Name Bus Cost ($/MWh)
Alta A 14 40 ±30
MW Limit MVar Limit
Park City Solitude Sundance Brighton A C D E 15 30 40 10 170 520 200 600 ±127.5 ±390 ±150 ±450 Table 2. Load data
Bus MW MVar
A 0 0
B 300 98.61
C 300 98.61
D 400 131.47
E 0 0
Table 3. Line parameter and limits
Line R (%) X (%) B/2 (10-3) Limit (MVA)
AB 0.281 2.81 3.56 400
AD 0.304 3.04 3.29 --
AE 0.064 0.64 15.63 --
BC 0.108 1.08 9.26 --
CD 0.297 2.97 3.37 --
DE 0.297 2.97 3.37 240
C. Sample Results for Economic Study The generation dispatch, line flow, and LMP results based on the ACOPF model with the above modified base-case data are shown in Tables 4, 5, and 6, respectively. Table 4. Gen. Dispatch Results from ACOPF for the revised PJM 5-bus system Gen Alta Park City Solitude Sundance Brighton MW 40 170 324.50 0 470.69 MVar 30 127.5 390.00 -10.80 -165.04
Table 5. LMP ($/MWh) results from ACOPF for the revised PJM 5-bus system
Bus LMP
A
B
C
D
E
16.94
26.55
30.00
39.71
10. 00
Table 6. Line flows (MW) from ACOPF for the revised PJM 5-bus system
Line
AB
AD
AE
BC
CD
DE
Sending End Rcv . End
252.38 250.79
187.87 186.92
-230.25 -230.70
-49.21 -49.45
-24.95 -25.42
-238.50 -240.00
The generation dispatch, line flow, and LMP results based on the lossless DCOPF model [2, 6] with the above modified data are shown in Tables 7, 8, and 9, respectively. Here Bus D is selected as the reference bus. As shown in Table 7, there are two marginal units because there is one line (DE) congested as shown in Table 9. The reason is that the number of marginal units is equal to the number of binding transmission constraints plus 1 [3-4]. And, LMPs at these two busses (C and E) with local marginal units are the same as the costs of the corresponding local marginal units, respectively, as shown in Table 8. Similar results can be observed from the ACOPF model. The results from this base case show that the DCOPF and ACOPF may produce close results. However, considerable difference may be observed at some other system load levels due to different sets of marginal units produced by DCOPF and ACOPF, as shown in [2]. Table 7. Gen. Dispatch Results from the lossless DCOPF model for the revised PJM 5-bus system Gen Alta Park City Solitude Sundance Brighton MW
40.00
170.00
323.49
0.00
466.51
Table 8. LMP ($/MWh) results from the lossless DCOPF model for the revised PJM 5-bus system
Bus LMP LMP Energy LMP Cong.
A
B
C
D
E
16.98 39.94 -22.97
26.38 39.94 -13.56
30.00 39.94 -9.94
39.94 39.94 0.00
10.00 39.94 -29.94
Table 9. Line flows from the lossless DCOPF model for the revised PJM 5bus system
Line Flow (MW)
AB AD AE BC 249.72 186.79 -226.51 -50.28
CD DE -26.79 -240.00
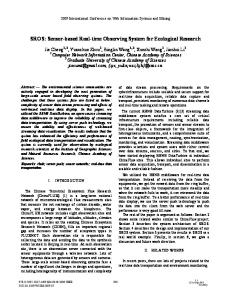
III. THE IEEE 30-BUS SYSTEM The second test system is the IEEE 30-bus test system with configuration shown in Fig. 2. The original data can be found in [7]. The system is revised in [8] to include branch ratings, as well as slight changes to bus shunts. For economic study purpose, the revised system is once again modified in [9] to define bus areas and generation costs, together with changes to generation location and limits.
3 Table 10. Generation dispatch results from ACOPF and Lossless DCOPF for the revised IEEE 30-bus system. Gen Bus Index
ACOPF Dispatch (MW)
DCOPF Dispatch (MW)
1
80.00
80.00
2
80.00
80.00
13
40.00
40.00
22
24.64
30.23
23
0.00
0.00
27
17.10
6.27
Table 11. The LMP results from ACOPF and Lossless DCOPF for the revised IEEE 30-bus system. Fig. 2. Configuration of the IEEE 30-bus system.
In addition to the changes introduced in [8-9], the following modifications are suggested. Generation Cost: The original generation cost curves defined in [9] in 1997 cannot reflect recent fuel costs. Therefore, the bidding prices of the 6 generators at buses 1, 2, 13, 22, 23, and 27 are assumed to be 10, 15, 30, 35, 40, and 45, respectively, all in $/MWh. Load power factor: Original power factor varies widely from bus to bus, in the range of 0.71~0.98. This creates scenarios where DCOPF and ACOPF will identify different marginal units and subsequently very different LMPs. In order to make fair comparison between DCOPF and ACOPF results, load power factor is set to 0.95 lagging in order to minimize the difference brought by reactive power profiles. Line flow limit: The branch rating of Line 6-8 is increased by 10% to make the ACOPF converge beyond the load level of 1.05 per unit of the base-case load, which will be beneficial for long-term studies. In general, the above settings will make area 1 be exporting power into area 2 and area 3 because it has the cheapest cost generation fleet and larger generation capacity. At 1.0 p.u. base case load level, there is no congestion and only generator at bus 13 is marginal. Therefore the LMPs at all buses are around $30. To make a more representative case study, simulation results at 1.25 p.u. load level are presented instead, where branch 6-8 is congested and generators at bus 22 and 27 are marginal units. Branch 6-8 is congested because it carries power from cheapest generators at bus 1 and 2 to the biggest load at bus 8 while it has one of the smallest reactance. The generators at bus 1, 2 and 13 are dispatched to their full capacity due to their cheapest price. The generator at bus 23 is not dispatched primarily because the generator at bus 22 is $5/MWh cheaper. The most expensive generator at bus 27 is dispatched because it can serve the adjacent loads at buses 29 and 30 causing counter-flow against congested branch 6-8. The generation dispatch and LMPs at all buses for both ACOPF and lossless DCOPF are listed in Table 10 and Table 11, respectively.
ACOPF LMP ($/MWh)
Bus Index
DCOPF LMP ($/MWh)
1
30.84
32.58
2
31.27
32.56
3
32.15
32.63
4
32.40
32.65
5
31.94
32.51
6
32.52
32.46
7
32.65
32.48
8
110.03
116.01
9
33.78
33.75
10
34.44
34.42
11
33.78
33.75
12
33.28
34.07
13
33.28
34.07
14
34.24
34.34
15
34.76
34.54
16
34.03
34.22
17
34.49
34.36
18
35.28
34.50
19
35.39
34.48
20
35.19
34.46
21
34.98
34.87
22
35.00
35.00
23
36.12
35.52
24
37.55
36.84
25
42.40
41.83
26
43.27
41.83
27
45.00
45.00
28
49.93
51.04
29
46.45
45.00
30
47.48
45.00
4 Tables 10 and 11 suggest the high accuracy of DCOPF dispatch and LMP calculation in comparison to their ACOPF counterparts in the revised IEEE 30-bus system. Again, it should be pointed out that it may not always be the case. The DCOPF results may vary significant with ACOPF results in some cases when different marginal units are identified [2]. It is interesting to observe in Table 11 that all LMPs in area 1 are below $35/MWh except LMPs at bus 8 and 28. In particular, LMP at bus 8 is extremely high and even higher than the most expensive generator bidding. It is due to the contribution of the loads to the congestion of branch 6-8. For example, any additional load consumption at bus 8 cannot be simply provided by the cheaper marginal generator at bus 22 because of the congestion on branch 6-8. Rather, it has to be served by simultaneously decreasing the output of marginal generator at bus 22 and increasing the output of marginal generator at bus 27 because the latter generator output will have less impact on the flow through 6-8, leading to replacing the cheaper generation with more expensive generation. It can be easily verified through Generation Shift Factor (GSF) in DCOPF framework without loss consideration. When bus 8 is the reference bus, the GSF of branch 6-8 with respect to bus 22 and 27 are GSF1=0.83911 and GSF2=0.73553, respectively. Assume the outputs of generator at bus 22 and 27 increase by x and y, then for one unit additional load consumption at bus 8, the following equations must be satisfied.
x + y =1 GSF1 × x + GSF2 × y = 0
The first equation represents the load balance constraint and the second equation maintains the congestion of branch 68. Solving these two equations gives x=-7.1013 and y=8.1013. It implies that one unit load consumption at bus 8 will lead to 7.1013 unit decrease in generation at bus 22 and 8.1013 unit increase in generation at bus 27. Therefore, the LMP at bus 8 will be x × 35 + y × 45 = 116.01$ / MWh , which matches the results shown in Table 11.
IV. CONCLUSIONS This paper presents two small systems for economic study. The first one is based on the PJM 5-bus system, which was originally provided in PJM’s training documents. Some modifications in generation data, load data and transmission data are suggested. Also, parameters related to line losses, voltage limits and reactive power are presented such that simulation based on a full AC model is possible. The second system is based on the IEEE 30-bus system, which was originally designed for technical studies. For economic study purpose, the revised system defines bus areas and generation costs, together with changes to generation locations and limits. This paper also shows a few sample test results for LMP studies. Future work may include other economic studies such as long-term and short-term planning, unit commitment, integrated economic-reliability study, and so on.
V. REFERENCES [1]
[2]
[3] [4]
[5]
[6]
[7] [8]
[9]
PJM Training Materials (LMP101), PJM, http://www.pjm.com/training/training-material.aspx, accessed on 03/27/2009. Fangxing Li and Rui Bo, “DCOPF-Based LMP Simulation: Algorithm, Comparison with ACOPF, and Sensitivity,” IEEE Trans. on Power Systems, vol. 22, no. 4, pp. 1475-1485, November 2007. Fangxing Li, “Continuous Locational Marginal Pricing (CLMP),” IEEE Trans. on Power Systems, vol. 22, no. 4, pp. 1638-1646, Nov. 2007. Fangxing Li and Rui Bo, “Congestion and Price Prediction under Load Variation,” IEEE Trans. on Power Systems, vol. 24, no. 2, pp. 911-922, May 2009. Rui Bo and Fangxing Li, “Probabilistic LMP Forecasting Considering Load Uncertainty,” IEEE Trans. on Power Systems, vol. 24, no. 3, pp. 1279-1289, August 2009. Rui Bo, “Congestion and Price Prediction in Locational Marginal Pricing Markets Considering Load Variation and Uncertainty,” Ph.D. Dissertation, University of Tennessee, Knoxville, TN, August 2009. Power System Test Case Archive, University of Washington, http://www.ee.washington.edu/research/pstca/. O. Alsac, B. Stott, "Optimal Load Flow with Steady State Security", IEEE Transactions on Power Apparatus and Systems, vol. 93, no. 3, pp. 745-751, May 1974. R. W. Ferrero, S. M. Shahidehpour, V. C. Ramesh, "Transaction Analysis in Deregulated Power Systems Using Game Theory", IEEE Trans. on Power Systems, vol. 12, no. 3, pp. 1340-1347, August 1997.
VI. BIOGRAPHIES Fangxing (Fran) Li (S’98, M’01, SM’05) received his BSEE and MSEE degrees both from Southeast University (China) in 1994 and 1997, respectively, and then his Ph.D. degree from Virginia Tech in 2001. He has been an Assistant Professor at The University of Tennessee (UT), Knoxville, TN, USA, since August 2005. Prior to joining UT, he worked at ABB, Raleigh, NC, as a senior engineer and then a principal engineer for four and a half years. At ABB, he was the lead developer of GridViewTM, ABB’s market simulation tool. His current research interests include power market, reactive power, renewable and distributed generation, distribution systems, and reliability. He is a registered Professional Engineer (P.E.) in the state of North Carolina. Rui Bo (S’02, M’09) received the B.S. and M.S. degrees in electric power engineering from Southeast University (China) in 2000 and 2003, respectively, and then his Ph.D. degree from University of Tennessee, Knoxville, TN in 2009. He worked at ZTE Corporation and Shenzhen Cermate Inc. from 2003 to 2005, respectively. He is presently working at an Indpendent System Operator in the US. He won the 2nd Place Prize Award at the Student Poster Contest at the IEEE PES 2009 Power Systems Conference and Exposition (PSCE), held in March 2009, Seattle, WA, USA.