J. Anat. (2008) 212, pp295–305
doi: 10.1111/j.1469-7580.2008.00860.x
Sleep deprivation predisposes liver to oxidative stress and phospholipid damage: a quantitative molecular imaging study Blackwell Publishing Ltd
Hung-Ming Chang,1 Fu-Der Mai,2 Bo-Jung Chen,3 Un-In Wu,4 Yi-Lun Huang,1 Chyn-Tair Lan1 and Yong-Chien Ling3 1
Department of Anatomy, Faculty of Medicine, Chung Shan Medical University, Taichung, Taiwan Department of Biochemistry, School of Medicine, Taipei Medical University, Taiwan 3 Department of Chemistry, National Tsing Hua University, Hsinchu, Taiwan 4 Department of Internal Medicine, National Taiwan University Hospital, Taipei, Taiwan 2
Abstract Sleep disorders are associated with an increased rate of various metabolic disturbances, which may be related to oxidative stress and consequent lipid peroxidation. Since hepatic phosphatidylcholine plays an important role in metabolic regulation, the aim of the present study was to determine phosphatidylcholine expression in the liver following total sleep deprivation. To determine the effects of total sleep deprivation, we used adult rats implanted for polygraphic recording. Phosphatidylcholine expression was examined molecularly by the use of time-of-flight secondary ion mass spectrometry, along with biochemical solid-phase extraction. The parameters of oxidative stress were investigated by evaluating the hepatic malondialdehyde levels as well as heat shock protein 25 immunoblotting and immunohistochemistry. In normal rats, the time-of-flight secondary ion mass spectrometry spectra revealed specific peaks (m/z 184 and 224) that could be identified as molecular ions for phosphatidylcholine. However, following total sleep deprivation, the signals for phosphatidylcholine were significantly reduced to nearly one-third of the normal values. The results of solid-phase extraction also revealed that the phosphatidylcholine concentration was noticeably decreased, from 15.7 μmol g–1 to 9.4 μmol g–1, after total sleep deprivation. By contrast, the biomarkers for oxidative stress were drastically up-regulated in the total sleep deprivation-treated rats as compared with the normal ones (4.03 vs. 1.58 nmol mg–1 for malondialdehyde levels, and 17.1 vs. 6.7 as well as 1.8 vs. 0.7 for heat shock protein 25 immunoblotting and immunoreactivity, respectively). Given that phosphatidylcholine is the most prominent component of all plasma lipoproteins, decreased expression of hepatic phosphatidylcholine following total sleep deprivation may be attributed to the enhanced oxidative stress and the subsequent lipid peroxidation, which would play an important role in the formation or progression of total sleep deprivationinduced metabolic diseases. Key words hepatic injury; lipid peroxidation; metabolic dysfunction; molecular image; quantitative image analysis; sleep disorder.
Introduction With the coming of industrialization, sleep disorders are increasingly becoming a major public health issue, affecting millions of people in many countries (Malik & Kaplan, 2005; Lenfent, 2006). In subjects suffering sleep deprivation there Correspondence Dr Hung-Ming Chang, Department of Anatomy, Faculty of Medicine, Chung Shan Medical University, 110, Sec. 1, Chien Kuo North Rd, Taichung 402, Taiwan. T: 886-4-24730022 ext. 11610; F: 886-4-24739030; E:
[email protected] The first two authors contributed equally to this study. Accepted for publication 20 December 2007
is a desynchronization of cellular function, which unavoidably leads to metabolic disturbances (McEwen, 2006; Chang et al. 2006). Recent biochemical and physiological studies have indicated that chronic sleep deprivation is an important factor in neurobehavioral, cardiovascular and metabolic morbidity in both developing and adult patients (Copinschi, 2005; Kheirandish & Gozal, 2006; Thase, 2006). A considerable body of clinical evidence also suggests that insufficient sleep increases the risk of hypertension, atherosclerosis and insulin resistance, as well as the stress-induced remodeling of the brain regions that participate in the regulation of memory, executive function and anxiety (Ogawa et al. 2003; Silva et al. 2004; Schultes et al. 2005; Wolk et al. 2005; Dang-Vu et al. 2006). However, although
© 2008 The Authors Journal compilation © 2008 Anatomical Society of Great Britain and Ireland
296 Effects of sleep deprivation on liver damage, H.-M. Chang et al.
the detailed mechanisms for these systemic abnormalities have not been clearly understood, it has been proposed that sleep restriction may increase energy expenditure and exacerbate metabolic activity (Rechtschaffen & Bergmann, 2002; Boethel, 2002). Enhanced cellular metabolism may disrupt the maintenance of homeostasis and result in larger amounts of reactive oxygen species (ROS) generation (McEwen, 2006; Frisard & Ravussin, 2006). It has been suggested that accumulated ROS production and the consequent allostatic overload may lead to oxidative stress and subsequent lipid peroxidation, which may be responsible for the pathophysiological progressions of sleep disorder-related metabolic diseases (Ramanathan et al. 2002; Lavie et al. 2004; Frisard & Ravussin, 2006; McEwen, 2006; Suzuki et al. 2006). Phosphatidylcholine is quantitatively the most important phospholipid in all mammalian tissues (Tijburg et al. 1989). The amphipathic lipid is the essential component of cellular membranes, and has played an important role in the regulation of cellular metabolism, signal transmission, and the maintenance of structural integrity (Tijburg et al. 1989). Previous studies have indicated that the polyunsaturated fatty acids of membrane phospholipids are particularly susceptible to peroxidation and undergo significant modifications, including the rearrangement or loss of double bonds and reductive degradation of lipid acyl side chains (Buege & Aust, 1978; Jacob & Mason, 2005). Recent biochemical reports have further demonstrated that lipid peroxidation would severely interrupt the basic physical properties and structural organization of the cell membranes, which is believed to be critically involved in several neuropathological, cardiovascular and metabolic disturbances (Kagan, 1988; Takayama et al. 1993; Keller & Mattson, 1998; Wright et al. 2004). It has long been suggested that the physiological and biochemical morbidity produced by sleep disorders is closely related to the initiation of oxidative stress and the consequence of lipid peroxidation (Ramanathan et al. 2002; Lavie et al. 2004; Copinschi, 2005; Suzuki et al. 2006). Our previous study also indicated that total sleep deprivation (TSD) depresses the intracellular metabolic pathway of nodose neurons, which can subsequently lead to clinical changes in autonomic and cardiovascular responses (Chang et al. 2006). Therefore assessment of the effect of sleep derivation on bio-membrane function, together with an examination of the concurrent variation of oxidative status, may be of considerable importance in the light of the potential clinical relevance for diagnosis and better understanding of metabolic diseases associated with sleep deprivation. As far as can be ascertained, however, no study concerning the effects of sleep deprivation on phosphatidylcholine expression has been reported. Furthermore, the corresponding changes in oxidative status and the consequent lipid peroxidation following sleep deprivation have never been adequately explored. Since the liver plays an important
role in the biosynthesis of phosphatidylcholine and is highly susceptible to the chain reaction of lipid peroxidation under conditions of stress (Tijburg et al. 1989; Takayama et al. 1993), the aim of the present study was to determine hepatic phosphatidylcholine expression in TSD rats using time-of-flight secondary ion mass spectrometry (TOF-SIMS) along with biochemical solid-phase extraction. In addition, to clarify the extent of lipid peroxidation and correlate the degree of oxidative stress with the possible alteration of phosphatidylcholine concentration, the hepatic malondialdehyde (MDA) level as well as the heat shock protein 25 (HSP-25) immunoblotting/immunohistochemistry were concomitantly processed in the present study. These measures were chosen because MDA is the most abundant product arising from lipid peroxidation (Kagan, 1988; Gluck et al. 2001) and HSP-25 is the ‘stress’ protein that has been documented to be induced in a variety of environmental stresses (Welch, 1990; Salminen et al. 1997; Terao et al. 2003).
Materials and methods Experimental animals and surgical procedure Adult male Wistar rats ( n = 45, weighing 200–250 g), obtained from the Laboratory Animal Center of the National Taiwan University, were used in this study. All surgical procedures for electroencephalogram (EEG) and electromyogram (EMG) recordings were performed using well-established methods as described previously (Tung et al. 2005). Briefly, under pentobarbital anaesthesia (55~75 mg kg–1, intraperitonal) all rats were restrained in a stereotaxic apparatus equipped with a heating pad. The cranium was exposed and five stainless steel screws (Small Parts Inc., Miami Lakes, FL, USA) were implanted through the skull to serve as dural electroencephalographic electrodes. The electrodes were soldered to connectors of a plug that was fixed to the skull with dental cement. For EMG recording, another four stainless steel wires were inserted into the nuchal musculature. Following this, the animals were allowed to recover for at least 10 days. The experimental animals were divided equally into three groups. Rats in the first group were subjected to total sleep deprivation for 5 days (TSD group), whereas their yoked controls in the second group were housed in the same TSD apparatus but were permitted to sleep (control for sleep deprivation, TSC group). Animals in the third group were kept in a plastic cage placed apart from the TSD apparatus and served as normal untreated controls (untreated group).
Sleep deprivation procedure and recordings TSD was performed by the disc-on-water (DOW) method as described in our previous study (Chang et al. 2006). This method was chosen because it had previously been
© 2008 The Authors Journal compilation © 2008 Anatomical Society of Great Britain and Ireland
Effects of sleep deprivation on liver damage, H.-M. Chang et al. 297
validated as able to produce effective TSD in one animal without excessive physical exertion, while its yoked control (TSC group) has an acceptable amount of sleep in spite of receiving the same stimulation (Bergmann et al. 1989). Briefly, the apparatus comprised two rectangular clear plastic chambers (60 × 20 × 60 cm each) placed side by side. A single plastic disc (40 cm in diameter), which could be rotated by a computerized monitoring system, serving as the rat-carrying platform, was built into the lower quarter of the two chambers. Beneath the disc, and extending to the chamber walls, was a rectangular tray filled with water to a depth of 5 cm. Before the experiment began, one of the rats scheduled to undergo sleep deprivation, together with its yoked control, were placed in the TSD apparatus for at least 7 days for environmental adaptation. During this period, the chambers were fitted with a solid mat in place of the water. Sleep deprivation depended on the rats’ aversion to water, as rats rarely enter water spontaneously. When sleep onset was detected in the sleep-deprived rat, the disc was rotated slowly by the computerized monitoring system at a moderate speed of 3.5 rpm, forcing both rats to keep awake and walk against the direction of disc rotation to avoid being forced into the water. When the sleep deprived rat was spontaneously awake, the disc was stationary and the yoked control rat was able to sleep. During the adaptive period and throughout the experiment, all animals were exposed to an automatically regulated light–dark cycle of 12 : 12 h at a constant temperature of 25 ± 1 °C and a relative humidity of 60%. Food and water were made available through grids placed on top of the chambers. In the care and handling of all experimental animals, we followed the Guide for the Care and Use of Laboratory Animals (1985) as stated in the US NIH guidelines (NIH publication no. 86-23). All the sleep deprivation procedures were also approved by the Laboratory Animal Center Authorities of the Chung Shan Medical University. Electroencephalographic and electromyographic data were recorded on a Grass model 78 polygraph (GrassTelefactor, West Warwick, RI, USA) and relayed to a computer for digital recording. Data were divided into 30s epochs and scored as waking, non-rapid eye movement, or rapid eye movement sleep using an automated scoring system previously validated against visual and behavioral methods (Bergmann et al. 1989).
Perfusion and tissue preparation For TOF-SIMS analysis and quantitative immunohistochemical study, rats of all experimental groups (n = 27) were deeply anaesthetized with 7% chloral hydrate (0.4 mL kg–1) and perfused transcardially with 100 mL Ringer’s solution, followed by 300 mL of 4% paraformaldehyde in 0.1 M phosphate buffer (PB), pH 7.4. After perfusion, the liver was quickly removed and kept in the same fixative for 2 h.
The tissue block was then transferred to graded concentrations of sucrose buffer (10~30%) for cryoprotection at 4 °C overnight. Serial 10-μm sections of the liver were cut transversely with a cryostat (Leica CM3050S, Leica Microsystems GmbH, Wetzlar, Germany) on the following day and were alternately placed into two wells of a cell culture plate. Sections collected in the first well were processed for TOFSIMS analysis, and those in the second well were processed for quantitative HSP-25 immunohistochemistry.
Solid-phase extraction of hepatic phosphatidylcholine The hepatic phosphatidylcholine extract was prepared using a modification of Burdge et al. (2000). Rats of all experimental groups (n = 9) were killed by deep anaesthesia with 7% chloral hydrate, and the liver was excised rapidly. The tissue was then homogenized in 0.8 mL 0.15 M sodium chloride. After that, dipentadecanoyl phosphatidylcholine was added to the tissue homogenates as recovery standards as appropriate. Total lipids were isolated by extraction with chloroform–methanol (2 : 1, v/v) containing butyrated hydroxytoluene, and the organic and aqueous phases were then separated by centrifugation at 1125 g for 10 min at 4 °C. The aqueous phase was removed and the organic phase collected was dried under N2 at 40 °C. The hepatic phosphatidylcholine was isolated by solid-phase extraction on aminopropyl silica column (100 mg packed silica per 1.0 mL cartridge) under gravity and then washed with chloroform–methanol (3 : 2, v/v) under vacuum to elute phosphatidylcholine.
TOF-SIMS analysis TOF-SIMS analysis was carried out on a TOF-SIMS IV instrument (ION-TOF GmbH, Münster, Germany). Tissue sections (30 sections per animal) cryostatted from each experimental rat (n = 27) and collected in the first well were attached to silica wafers (1 cm × 1 cm) and the temperature of the sample holder was adjusted to −60 °C. The gallium (Ga+) ion gun operated at 25 kV was used as the primary ion source (1 pA pulse current) for experiments conducted in this study. The Ga+ primary ion beam was scanned over an area of 100 μm2 which including 128 × 128 pixels. Four random areas were selected for scan in each section in which four spectra were acquired from each sample. Image data acquisition time was 200 s, and charge compensation was performed by a pulsed flood gun with low-energy electrons. The vacuum of the main chamber was kept between 10–7 and 10–8 Torr. The best resolution obtained was m/Δm = 7450. Positive secondary ions flying through a reflectron mass spectrometer were detected with a microchannel plate assembly operating at 10 kV post-acceleration. Since all examined tissue sections were fully fixed by lots amount of paraformaldehyde via vascular perfusion, the paraformaldehyde molecule may thus turn out to be the major
© 2008 The Authors Journal compilation © 2008 Anatomical Society of Great Britain and Ireland
298 Effects of sleep deprivation on liver damage, H.-M. Chang et al.
element in the tissue matrix. With regard to this viewpoint, it is proper to use paraformaldehyde together with a set + + + of standard peaks [like m/z 15 (CH3 ), 27 (C 2H3 ), 41 (C 3H5 ) + and 69 (Ga )] as mass calibration to ameliorate the potential matrix effect for ion spectra. The positive ion SIMS spectrum of the molecule is dominated by an intense fragment at m/z 184, which corresponds to the phosphatidylcholine head group, and m/z 224, which characterized the tail group of phosphatidylcholine.
Measurement of liver lipid peroxidation As the MDA is the most abundant product arising from lipid peroxidation (Kagan, 1988), measurement of MDA has been extensively used as an index of oxidative stress (Gluck et al. 2001). The MDA levels were measured by the method of Silva et al. (2004). Rats of all the experimental groups (n = 9) were killed by deep anaesthesia with 7% chloral hydrate, and the liver was excised immediately. After that, the liver was homogenized in ice-cold 0.1 M PB. The homogenates were centrifuged at 1300 g for 10 min at 4 °C, and the supernatants were then taken for detection of the MDA by measurement of fluorescence product formed from the reaction of this aldehyde with thiobarbituric acid. The results were determined spectrophotometrically at 532 nm to represent MDA levels using tetraethoxypropane as a standard, and expressed as nmol mg–1.
HSP-25 immunohistochemistry For HSP-25 immunohistochemistry, tissue sections collected in the second well were first placed in 0.01 M phosphate buffer saline (PBS), pH 7.4, containing 10% methanol and 3% hydrogen peroxide for 1 h to reduce endogenous peroxidase activity. Following this, sections were incubated in the blocking medium containing 0.1% Triton X-100, 3% normal goat serum and 2% bovine serum albumin (all from Sigma, St. Louis, MO, USA) for 1 h to block non-specific binding. After several washes in PBS, the sections were incubated in mouse monoclonal anti-HSP-25 antiserum (Chemicon, MAB3842, Temecula, CA, USA) at a dilution of 1 : 100 with the blocking medium for 48 h at 4 °C. After incubation in primary antibody, sections were further incubated with a goat-anti-mouse biotinylated secondary antibody (1 : 200; Vector Laboratories, Burlingame, CA, USA) at room temperature for 2 h. The immunoreaction product was revealed by the standard avidin–biotin complex (ABC) procedure (Vector Laboratories) with 3,3′diaminobenzidine as a substrate of peroxidase.
were frozen in liquid nitrogen and then homogenized with 100 μL lysis buffer using a grinder on ice. The Western blot procedure was processed by the methods described previously (Pieri et al. 2001). Briefly, 10 μg of solubilized proteins were separated on SDS-PAGE (12%) and electroblotted onto a polyvinylidene difluoride (PVDF) membrane (Bio-Rad Laboratories, Hercules, CA, USA). The membranes were blocked with 5% non-fat dry milk and probed sequentially with antibodies against β-actin (1 : 5000) and HSP-25 (1 : 1000). Following that, the PVDF sheets were incubated with HRP-conjugated secondary antibody at a dilution of 1 : 5000 for 1 h at room temperature. The immunoreaction was visualized with ECL solution (5 min) followed by 2 min of film exposure. Optical density (OD) was quantified with a computer-assisted software (SCIENCE LAB 2003, Fuji film, Tokyo, Japan). Densitometric results were normalized against β-actin and were presented as mean ± SD.
Quantitative image analysis The general approach for quantitative image analysis was similar to that used in our previous studies (Chang et al. 2001, 2005, 2006). Only cell profiles with a clear outline on the focal plane were included in the analysis. The HSP 25 staining intensity was quantified with a computer-based image analysis system (MGDS) and IMAGE-PRO PLUS software (Media Cybernetics, Silver Spring, MD, USA). A digital camera, mounted on the Zeiss microscope (Axioplane 2, Carl Zeiss MicroImaging GmbH, Hamburg, Germany), imaged sections at 50× magnification in bright field and displayed them on a high-resolution monitor. At this magnification, the optical density (OD) of the immunoreaction product in the hepatocyte was determined using a computer mouse to draw a line encircling the labeled liver cell on the digitized image. The recorded densitometric reading represents the OD of the pixels for that cell. All densitometric readings taken from all of the hepatocytes in each section were then combined and averaged to obtain the total OD (TOD) of each section. The background staining (BOD) of each section was measured by averaging 10 random rectangles (area of rectangle = 150 μm2) of the lumen space of vessels. True OD for each section was then expressed by subtracting the BOD from TOD, so that each measurement was made in an unbiased way to correct for background. All images were captured on the same day to maintain uniform settings adjusted at the beginning of capturing. All parameters were carefully controlled following the recommended procedures for grey level adjustment and minimal OD (Smolen, 1990).
Western blot analysis For Western blot analysis, animals from each experimental group were decapitated under deeply anaesthesia with 7% chloral hydrate. After removal of liver, the liver tissues
Statistical analysis For TOF-SIMS data analysis, spectral intensity detected from each section was normalized to the ion intensity
© 2008 The Authors Journal compilation © 2008 Anatomical Society of Great Britain and Ireland
Effects of sleep deprivation on liver damage, H.-M. Chang et al. 299
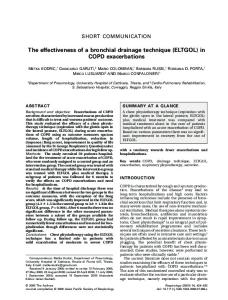
Fig. 1 TOF-SIMS spectra and molecular images of positively charged secondary ions of the phosphatidylcholine from the liver of untreated (A) and total sleep deprived (B) rats. The specific signals of the phosphatidylcholine (m/z = 184 and 224, phospholipid head and tail group, respectively) were markedly lower in the total sleep deprived rats (B) than in the normal untreated ones (A). The ion intensities in the molecular image are represented by a color scale, with dark colors representing low intensities and bright colors high intensities. Field of view: 100 × 100 μm2.
of paraformaldehyde (serving as baseline = 100%) and expressed as percentage above the baseline. All the normalized spectra collected from each animal (four spectra per section with 30 sections per animal) were then averaged to obtain representative data for that animal. The representative data acquired from animals belonging to the same experimental group were further averaged to gain a mean value for that corresponding group. Comparisons of the mean values obtained from different experimental groups as well as other data acquired from biochemical, biophysical and morphological methods for untreated, TSC and TSD rats were subjected to one-way ANOVA analysis. The effect of each challenge compared with the untreated group was further analyzed using the Bonferroni post hoc test. The statistical difference was considered significant if P < 0.05.
Results TOF-SIMS molecular analysis in the liver of untreated, TSC and TSD rats In the positive ion images of the liver of untreated and TSC rats, a relatively strong signal was observed at m/z 184 and 224 that reflects the intensity distribution of the phosphatidylcholine head and tail fragment, respectively (Fig. 1A). The averaged typical positive ion spectrums collected from all untreated animals revealed that the intensities for phosphatidylcholine were 5.0 × 10³ and 0.4 × 10³ for m/z 184 and 224, respectively (Fig. 1A). The mean values of the normalized spectra obtained from the untreated group were estimated to be 549 ± 45% for m/z 184 and 27.05 ± 3% for m/z 224 (Fig. 2A). However, in rats subjected to
© 2008 The Authors Journal compilation © 2008 Anatomical Society of Great Britain and Ireland
300 Effects of sleep deprivation on liver damage, H.-M. Chang et al.
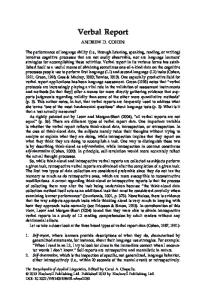
Fig. 2 Histograms showing the normalized spectral intensity (A) and solid-phase extraction study (B) of hepatic phosphatidylcholine (PC) in the liver of untreated, control for total sleep deprived (TSC) and total sleep deprived (TSD) rats. The hepatic phosphatidylcholine in the untreated rats was 549 ± 45% (A) and 15.7 ± 0.7 μmol g–1 (B) in the normalized spectral intensity and solid-phase extraction studies, respectively. However, following 5 days of TSD, the hepatic phosphatidylcholine concentration was significantly decreased in the spectral analysis (332 ± 59%) (A) or by the extraction assays (9.4 ± 1.7 μmol g–1) (B). It is also noteworthy that the reduction rate (TSD value/untreated value) of hepatic phosphatidylcholine was nearly identical (0.604 vs. 0.598) in data from TOF-SIMS analysis and data from solid-phase extraction.
TSD, the averaged spectral intensity for phosphatidylcholine peaks was significantly reduced to 3 × 10³ and 0.1 × 10³ for m/z 184 and 224, respectively (Fig. 1B). The normalized mean values of the spectra also showed a decreased expression; 332 ± 59% for m/z 184 and 18.74 ± 5% for m/z 224 in the TSD animals (Fig. 2A). With regard to the ion image, the phosphatidylcholine ions were homogeneously distributed in the liver parenchyma without any specific localization (Fig. 1A). However, following TSD, the ion image signals for phosphatidylcholine were significantly weakened either in the m/z 184 or in the m/z 224 fragment (Fig. 1B).
Hepatic phosphatidylcholine concentrations in the untreated, TSC and TSD rats The changes in hepatic phosphatidylcholine concentration of each experimental group are summarized in Fig. 2B. In the untreated and TSC groups, the hepatic phosphatidylcholine concentration was estimated to be 15.7 ± 0.7 and 14.9 ± 1.0 μmol g–1, respectively. However, in rats suffering from TSD, the hepatic phosphatidylcholine concentration was significantly reduced to nearly 9.4 ± 1.7 μmol g–1. These results indicate that TSD causes a clear decrease in hepatic phosphatidylcholine content.
Hepatic MDA levels in the untreated, TSC and TSD rats As shown in Fig. 3A, the hepatic MDA levels revealed no significant difference between the untreated and TSC
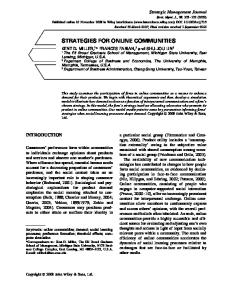
groups. However, following 5 days of TSD, a considerable increase in the hepatic MDA level was observed when compared to both untreated and TSC groups (Fig. 3A). The hepatic MDA level was significantly raised to 4.03 ± 0.33 nmol mg –1 in the TSD rats when compared to the untreated ones (1.58 ± 0.28 nmol mg–1) (Fig. 3A).
HSP-25 immuno-expression in the liver of untreated, TSC and TSD rats In the untreated and TSC rats, only mild levels of HSP-25 immunoreactivity were detected in the hepatocytes of portal triad region (Fig. 4A) and the region surrounding the central venule (Fig. 4C). The HSP-25 positive staining was distributed diffusely throughout the parenchyma without any regional enrichment (Fig. 4A,C). Some moderate staining was observed in the blood vessels (i.e. portal vein, hepatic artery and central venule) and bile ductules (Fig. 4A,C). No obvious difference in the HSP-25 immunostaining pattern was detected between the untreated and TSC groups. However, following 5 days of TSD, the HSP-25 immunoreactivity was drastically increased in both the portal triad region (Fig. 4B) and the region surrounding the central venule (Fig. 4D). The HSP-25 immunostaining was homogeneously labeled in the cytoplasm of hepatocytes with no preferential localization (Fig. 4B,D). The up-regulation extent of HSP-25 immunostaining appeared to be relatively uniform among different hepatic lobes. No significant swelling or any pathological manifestation of
© 2008 The Authors Journal compilation © 2008 Anatomical Society of Great Britain and Ireland
Effects of sleep deprivation on liver damage, H.-M. Chang et al. 301
Fig. 3 Histograms showing the MDA level (A) and the true optical density (true OD) of heat shock protein 25 (HSP-25) immunoreactivity (B) in the hepatocytes of untreated, control for total sleep deprived (TSC) and total sleep deprived (TSD) rats. In untreated and TSC rats, the hepatic MDA levels were 1.58 ± 0.28 nmol mg–1 and 1.6 ± 0.2 nmol mg–1, respectively (A). However, following 5 days of TSD, the MDA level had drastically increased to 4.03 ± 0.33 nmol mg–1 as compared to the untreated or TSC values (A). Similar findings were observed in HSP-25 immuno-staining intensities (B) in which the true OD of TSD rats was noticeably increased (1.8 ± 0.18) in the liver as compared to untreated rats (0.7 ± 0.23).
the hepatocytes was observed. On the other hand, numerous sinusoid lining cells (e.g. endothelial and Kupffer cells) were positively stained for HSP-25 immunoreactivity in the untreated group or in the TSD-treated group (Fig. 4E,F).
Table 1 Whole body weights (g) of the untreated, control for total sleep deprived (TSC), and total sleep deprived (TSD) rats
Quantitative image analysis of HSP-25 immunoexpression in the liver of untreated, TSC and TSD rats
At start of experiment At end of experiment
The quantitative image analysis revealed that the optical density of the HSP-25 immunoreactive hepatocytes was estimated to be 0.7 ± 0.23 and 0.9 ± 0.08 in the untreated and TSC rats, respectively (Fig. 3B). Conversely, following 5 days of TSD, the optical density of the hepatic HSP-25 immunostaining was remarkably increased to nearly 2.5-fold (1.8 ± 0.18) the values obtained from untreated and TSC groups (Fig. 3B).
Data are expressed as mean ± SD.
HSP-25 protein level in the liver of untreated, TSC and TSD rats Western blot analysis revealed that total HSP-25 protein levels in the liver of untreated rats were 6.75 ± 2.7. However, these levels were drastically increased to 17.1 ± 4.6 for those animals subjected to 5 days of TSD (Fig. 5). Quantitative analysis showed that the relative increment of HSP-25 protein levels (17.1/6.75 = 2.53) was nearly identical to the MDA result (4.03/1.58 = 2.55). These findings confirm the detrimental effects of TSD of inducing oxidative stress on hepatic tissues.
Untreated (n = 12)
TSC (n = 12)
TSD (n = 12)
236 ± 18 243 ± 22
230 ± 15 239 ± 25
232 ± 21 233 ± 17
Whole body weight measurement of the untreated, TSC and TSD rats At the beginning of the experiment, the body weights of all animals did not show any significant differences (Table 1). Following 5 days of TSD, there was no obvious weight change in the sleep-deprived rats (233 ± 17 g) as compared with the value obtained at the beginning of the experiment (232 ± 21 g) or with the value assessed in both the untreated or TSC groups (243 ± 22 g and 239 ± 25 g, respectively) (Table 1).
Discussion The present study is the first report employing quantitative molecular, biochemical and morphological methods to provide functional anatomical evidence that TSD will
© 2008 The Authors Journal compilation © 2008 Anatomical Society of Great Britain and Ireland
302 Effects of sleep deprivation on liver damage, H.-M. Chang et al.
Fig. 4 Photomicrographs showing heat shock protein 25 (HSP-25) immunoreactivity in the liver of untreated (A,C,E) and total sleep deprived (B,D,F) rats. In untreated rats, the hepatocytes were lightly stained for HSP-25 immunoreactivity either in the portal triad region (A) or in the area surrounding the central venule (C). However, following TSD, the staining intensity of HSP-25 immuno-expression was drastically up-regulated in the hepatocytes of both the portal triad region (B) and the region near the central venule (D). Higher magnification [(E,F), the red panel in (A) and corresponding region in (B), respectively] also revealed that some flattened endothelial cells (E) and round Kupffer cells (K) were positively stained for HSP-25 immunoreactivity either in control (E) or in experimental groups (F). PV, portal vein; A, hepatic artery; B, bile ductules; V, central venule; E, endothelial cells; K, Kupffer cells. Scale bar = 100 μm in (A~D) and 50 μm in (E~F).
significantly decrease the hepatic phosphatidylcholine expression and sharply increase the oxidative stress in the hepatocytes. The attenuated effect of TSD on hepatic phosphatidylcholine concentration was demonstrated by both TOF-SIMS analysis (Figs 1 and 2A) and solid-phase extraction study (Fig. 2B). It is well documented that phosphatidylcholine is the most important functional phospholipid in mammalian cells (Tijburg et al. 1989). This amphipathic lipid is an essential component of cellular membranes and participates in the regulation of a variety of biological functions such as apoptosis, blood coagulation, synaptic transmission and cellular metabolic activity (Tijburg et al. 1989; Wright et al. 2004; Omoi et al. 2006;
Tsuda et al. 2006). Previous studies have indicated that phosphatidylcholine concentration would be drastically reduced in many experimental pathologies where oxidative stress is a contributing factor (Takayama et al. 1993; Guan et al. 1999; Mulder et al. 2003; Drgova et al. 2004; Omoi et al. 2006; Petursdottir et al. 2006; Tsuda et al. 2006). Biochemical reports also demonstrated that the content and the structural modification of phosphatidylcholine would gradually decrease in several neuronal diseases such as Alzheimer’s disease and senescent dementia (Guan et al. 1999; Mulder et al. 2003; Petursdottir et al. 2006). It is proposed that depressed phosphatidylcholine expression following various experimental paradigms may be an
© 2008 The Authors Journal compilation © 2008 Anatomical Society of Great Britain and Ireland
Effects of sleep deprivation on liver damage, H.-M. Chang et al. 303
Fig. 5 Immunoblots (A) and histograms (B) showing the HSP-25 protein expression in the liver of untreated and total sleep deprived (TSD) rats. The densitometric intensity of HSP-25 protein level in untreated rats was estimated to be 6.75 ± 2.7 (B). However, following 5 days of TSD, the level of HSP-25 protein expression had drastically increased to 17.1 ± 4.6 (B). Also note the results of anti-β-actin (A), which demonstrates equal loading of proteins.
indication of bio-membrane dysfunction or metabolic impairment in the affected cells (Guan et al. 1999; Drgova et al. 2004; Omoi et al. 2006; Petursdottir et al. 2006; Ossani et al. 2007). With regard to the potential importance of phosphatidylcholine in the maintenance of cellular metabolic function, a detailed investigation of phosphatidylcholine expression, either morphologically or biochemically, would be of great clinical significance in the prediction of metabolic activity. Since TOF-SIMS has become one of the most sensitive analytical techniques in current molecular biology (Sjövall et al. 2003; Nygren et al. 2004), the present study was designed to use this equipment to shed light on the spatial distribution of phosphatidylcholine in hepatocytes following TSD. In line with these earlier findings, our molecular imaging results also revealed reduced phosphatidylcholine expression in the hepatocytes following TSD (Figs 1 and 2A). This new finding was strictly consistent with the results obtained using biochemical approaches
(Fig. 2B). Based on these significant observations, it is reasonable to suggest that TSD-induced hepatic phosphatidylcholine reduction may contribute to the disruption of bio-membrane integrity, as well as having a detrimental effect on cellular metabolic activity. On the other hand, to clarify the relationship between phosphatidylcholine reduction and the possible changes in cellular oxidative status, the parameters for oxidative stress [i.e. MDA level as well as the stress protein (HSP-25) immunoblotting and immunoreactivity] were further examined in the present study. The results indicated that after TSD, both MDA and HSP-25 protein expression were drastically up-regulated in the hepatocytes of adult rats (Figs 3–5). The enhanced oxidative biomarkers suggest that TSD would actually contribute to oxidative stress (and the resulting lipid peroxidation) in the affected hepatocytes. Considering that phosphatidylcholine is the most essential phospholipid in hepatocytic membranes (Tijburg et al. 1989), a diminution in phosphatidylcholine level, as arises from the augmented oxidative stress and lipid peroxidation, might serve as a potential pathogenic mechanism for TSD-relevant metabolic diseases. However, in addition to attributing the hepatic phosphatidylcholine reduction to TSD-induced oxidative stress and subsequent lipid peroxidation, it is noteworthy that TSD itself may exert some other prospective effects on the phosphatidylcholine levels. It has been reported that sleep deprivation may cause weight loss in experimental animals (Rechtschaffen & Bergmann, 2002). One might therefore hypothesize that the decrease in phosphatidylcholine concentration after TSD may occur as a result of lower food intake instead of oxidative overload. In attempt to solve this problem, we measured the whole body weight of all experimental animals at the beginning and the end of the experiment. We found no significant body weight loss (Table 1). Although the detailed mechanism for potential body weight change after TSD is not fully understood, this result indicates that the reduction of hepatic phosphatidylcholine expression following TSD, at least in the current study, was a specific effect of the lack of sleep and was not due to the restrictive diets or other nutritional factors. Another point to be considered in this context is that there are no obvious pathological features in hepatocytes at the light microscopic level after TSD (Fig. 4). This seems to contradict the view that up-regulation of oxidative stress may cause morphological alterations in the affected tissues. Since the morphological changes following oxidative stress may be influenced by a variety of factors, one possible explanation for this phenomenon is that the 5 days of TSD was not intense enough to cause profound morphological changes that could be clearly detected at the light microscopic level. Therefore care must be taken in extrapolating these data to ‘long-term sleep deprivation’, as it remains unclear whether or not the morphological profile is still intact after the prolongation of TSD.
© 2008 The Authors Journal compilation © 2008 Anatomical Society of Great Britain and Ireland
304 Effects of sleep deprivation on liver damage, H.-M. Chang et al.
It is also noteworthy that although TSD is a wellestablished model in clinical research, it remains debatable whether any results obtained from this regime were directly attributable to TSD. As our TSD paradigm is based on the DOW method, any possible effect (e.g. increasing physical activity) on oxidative stress or metabolic activity should not have been overlooked. Because of this, we used the yoked control (TSC group) to serve as the internal control for TSD to evaluate the possible changes of these parameters. The results obtained from the present study revealed that data collected from TSC group were very similar to those observed in the untreated group, both in hepatic phosphatidylcholine content (Figs 1 and 2) and in hepatic MDA/ HSP-25 levels (Figs 3–5). Given that the TSC rats had the same level of physical activity and were simultaneously treated in the same experimental equipment as the TSD ones, the marked discrepancy detected between TSC and TSD suggests that these alterations were due specifically to a lack of sleep and not to the minor influence of physical debilitation produced by the current experimental paradigm. In summary, the present study provides the first functional anatomical evidence that sleep deprivation may predispose the liver to significant oxidative injury and subsequently phosphatidylcholine damage. Reduced phosphatidylcholine expression is closely associated with the TSD-induced oxidative stress and lipid peroxidation. Although the detailed mechanisms concerning the formation of TSD-relevant metabolic dysfunction are not fully understood, the current findings present important insights into the potential detrimental effect of oxidative stress on biomembrane function, which may play a critical role in the initiation or development of TSD-related metabolic diseases.
Acknowledgements We are grateful to Professor Bang H. Hwang, Department of Anatomy and Cell Biology, School of Medicine, Indiana University, Indianapolis, IN, USA, for his critical evaluation and linguistic revision of the manuscript. The authors also thank Professor T. B. Lin and Dr H. Y. Peng, Department of Physiology, Chung Shan Medical University, for their expert technical assistance. This study was supported by the research grants NSC 95-2320-B-040-012/NSC 96-2320-B-040-015 to Dr Chang and NSC 96-2113-M-038-003-MY2 to Dr Mai from the National Science Council, Taiwan.
References Bergmann BM, Kushida CA, Everson CA, Gilliland MA, Obermeyer W, Rechtschaffen A (1989) Sleep deprivation in the rat: II. Methodology. Sleep 12, 5–12. Boethel CD (2002) Sleep and the endocrine system: new associations to old diseases. Curr Opin Pulm Med 8, 502–505. Buege JA, Aust SD (1978) Microsomal lipid peroxidation. Methods Enzymol 52, 302–310. Burdge GC, Wright P, Jones AE, Wootton SA (2000) A method for separation of phosphatidylcholine, triacylglycerol, non-esterified fatty acids and cholesterol esters from plasma by solid-phase extraction. Br J Nutr 84, 781–787.
Chang HM, Lue JH, Wen CY, Shieh JY (2001) Axotomy along with hypoxia enhances the neuronal NADPH-d/NOS expression in lower brain stem motor neurons of adult rats. Exp Neurol 171, 116–126. Chang HM, Tseng CY, Wei IH, Lue JH, Wen CY, Shieh JY (2005) Melatonin restores the cytochrome oxidase reactivity in the nodose ganglia of acute hypoxic rats. J Pineal Res 39, 206–214. Chang HM, Wu UI, Lin TB, Lan CT, Chien WC, Huang WL, et al. (2006) Total sleep deprivation inhibits the neuronal nitric oxide synthase and cytochrome oxidase reactivities in the nodose ganglion of adult rats. J Anat 209, 239–250. Copinschi G (2005) Metabolic and endocrine effects of sleep deprivation. Essent Psychopharmacol 6, 341–347. Dang-Vu TT, Desseilles M, Peigneux P, Maquet P (2006) A role for sleep in brain plasticity. Pediatr Rehabil 9, 98–118. Drgova A, Likavcanova K, Dobrota D (2004) Changes of phospholipid composition and superoxide dismutase activity during global brain ischemia and reperfusion in rats. Gen Physiol Biophys 23, 337–346. Frisard M, Ravussin E (2006) Energy metabolism and oxidative stress: impact on the metabolic syndrome and the aging process. Endocrine 29, 27–32. Gluck MR, Moy LY, Jayatilleke E, Hogan KA, Manzino L, Sonsalla PK (2001) Parallel increases in lipid and protein oxidative markers in several mouse brain regions after methamphetamine treatment. J Neurochem 79, 152–160. Guan Z, Wang Y, Cairns NJ, Lantos PL, Dallner G, Sindelar PJ (1999) Decrease and structural modifications of phosphatidylethanolamine plasmalogen in the brain with Alzheimer disease. J Neuropathol Exp Neurol 58, 740–747. Jacob RF, Mason RP (2005) Lipid peroxidation induces cholesterol domain formation in model membranes. J Biol Chem 280, 39380– 39387. Kagan VE (1988) Lipid Peroxidation in Biomembranes. Boca Raton: CRC Press. Keller JN, Mattson MP (1998) Roles of lipid peroxidation in modulation of cellular signaling pathways, cell dysfunction, and death in the nervous system. Rev Neurosci 9, 105–116. Kheirandish L, Gozal D (2006) Neurocognitive dysfunction in children with sleep disorders. Dev Sci 9, 388–399. Lavie L, Vishnevsky A, Lavie P (2004) Evidence for lipid peroxidation in obstructive sleep apnea. Sleep 27, 123–128. Lenfent C (2006) The interdependence of sleep and health – a commentary. Metabolism 55, S50–S53. Malik SW, Kaplan J (2005) Sleep deprivation. Prim Care 32, 475– 490. McEwen BS (2006) Sleep deprivation as a neurobiologic and physiologic stressor: Allostasis and allostatic load. Metabolism 55, S20–S23. Mulder C, Wahlund LO, Teerlink T, Blomberg M, Veerhuis R, van Kamp GJ, et al. (2003) Decreased lysophosphatidylcholine/ phosphatidylcholine ratio in cerebrospinal fluid in Alzheimer’s disease. J Neural Transm 110, 949–955. Nygren H, Malmberg P, Kriegeskotte C, Arlinghaus HF (2004) Bioimaging TOF-SIMS: localization of cholesterol in rat kidney sections. FEBS Lett 566, 291–293. Ogawa Y, Kanbayashi T, Saito Y, Takahashi Y, Kitajima T, Takahashi K, et al. (2003) Total sleep deprivation elevates blood pressure through arterial baroreflex resetting: a study with microneurographic technique. Sleep 26, 986–989. Omoi NO, Arai M, Saito M, Takatsu H, Shibata A, Fukuzawa K, et al. (2006) Influence of oxidative stress on fusion of pre-synaptic plasma membranes of the rat brain with phosphatidylcholine
© 2008 The Authors Journal compilation © 2008 Anatomical Society of Great Britain and Ireland
Effects of sleep deprivation on liver damage, H.-M. Chang et al. 305
liposomes, and protective effect of vitamin E. J Nutr Sci Vitaminol 52, 248–255. Ossani G, Dalghi M, Repetto M (2007) Oxidative damage lipid peroxidation in the kidney of choline-deficient rats. Front Biosci 12, 1174–1183. Petursdottir AL, Farr SA, Morley JE, Banks W, Skuladottir G (2006) Lipid peroxidation in brain during aging in the senescenceaccelerated mouse (SAM). Neurobiol Aging 28, 1170–1178. Pieri I, Cifuentes-Diaz C, Oudinet JP, Blondet B, Rieger F, Gonin S, et al. (2001) Modulation of HSP25 expression during anterior horn motor neuron degeneration in the paralysé mouse mutant. J Neurosci Res 65, 247–253. Ramanathan L, Gulyani S, Nienhuis R, Siegel JM (2002) Sleep deprivation decreases superoxide dismutase activity in rat hippocampus and brainstem. Neuroreport 13, 1387–1390. Rechtschaffen A, Bergmann BM (2002) Sleep deprivation in the rat: an update of the 1989 paper. Sleep 25, 18–24. Salminen WF Jr, Roberts SM, Fenna M, Voellmy R (1997) Heat shock protein induction in murine liver after acute treatment with cocaine. Hepatology 25, 1147–1153. Schultes B, Schmid S, Peters A, Born J, Fehm HL (2005) Sleep loss and the development of diabetes: a review of current evidence. Exp Clin Endocrinol Diabetes 113, 563–567. Silva RH, Abilio VC, Takatsu AL, Kameda SR, Grassl C, Chehin AB, et al. (2004) Role of hippocampal oxidative stress in memory deficits induced by sleep deprivation in mice. Neuropharmacology 46, 895–903. Sjövall P, Lausmaa J, Nygren H, Carlsson L, Malmberg P (2003) Imaging of membrane lipids in single cells by imprint-imaging time-of-flight secondary ion mass spectrometry. Anal Chem 75, 3429–3434. Smolen AJ (1990) Image analysis techniques for quantification of immunohistochemical staining in the nervous system. In: Methods in Neuroscience: Quantitative and Qualitative Microscopy (ed. Conn PM), pp. 208–229. San Diego: Academic Press.
Suzuki YJ, Jain V, Park AM, Day RM (2006) Oxidative stress and oxidant signaling in obstructive sleep apnea and associated cardiovascular diseases. Free Radic Biol Med 40, 1683–1692. Takayama F, Egashira T, Kudo Y, Yamanaka Y (1993) Effects of anti-free radical interventions on phosphatidylcholine hydroperoxide in plasma after ischemia-reperfusion in the liver of rats. Biochem Pharmacol 46, 1749–1757. Terao A, Steininger TL, Hyder K, Apte-Deshpande A, Ding J, Rishipathak D, et al. (2003) Differential increase in the expression of heat shock protein family members during sleep deprivation and during sleep. Neuroscience 116, 187–200. Thase ME (2006) Depression and sleep: pathophysiology and treatment. Dialogues Clin Neurosci 8, 217–226. Tijburg LB, Geelen MJ, van Golde LM (1989) Regulation of the biosynthesis of triacylglycerol, phosphatidylcholine and phosphatidylethanolamine in the liver. Biochim Biophys Acta 1004, 1–19. Tsuda T, Yoshimura H, Hamasaki N (2006) Effect of phosphatidylcholine, phosphatidylethanolamine and lysophosphatidylcholine on the activated factor X-prothrombin system. Blood Coagul Fibrinolysis 17, 465–469. Tung A, Herrera S, Szafran MJ, Kasza K, Mendelson WB, et al. (2005) Effect of sleep deprivation on righting reflex in the rat is partially reversed by administration of adenosine A1 and A2 receptor antagonists. Anesthesiology 102, 1158–1164. Welch WJ (1990) The mammalian stress response: cell physiology and biochemistry of stress proteins. In Stress Proteins in Biology and Medicine (eds Morimoto RI, Tissieres A, Georgopoulos C), pp. 223–278. New York: Cold Spring Harbor Laboratory Press. Wolk R, Gami AS, Garcia-Touchard A, Somers VK (2005) Sleep and cardiovascular disease. Curr Probl Cardiol 30, 625–662. Wright MM, Howe AG., Zaremberg V (2004) Cell membranes and apoptosis: role of cardiolipin, phosphatidylcholine, and anticancer lipid analogues. Biochem Cell Biol 82, 18–26.
© 2008 The Authors Journal compilation © 2008 Anatomical Society of Great Britain and Ireland