Simulation and experimental study of spray pyrolysis of polydispersed droplets W. Widiyastuti and Wei-Ning Wang Department of Chemical Engineering, Graduate School of Engineering, Hiroshima University, Higashi-Hiroshima 739-8527, Japan
I. Wuled Lenggoro Institute of Symbiotic Science and Technology, Tokyo University of Agriculture and Technology, Koganei, Tokyo 184-8588, Japan
Ferry Iskandar and Kikuo Okuyamaa) Department of Chemical Engineering, Graduate School of Engineering, Hiroshima University, Higashi-Hiroshima 739-8527, Japan (Received 10 January 2007; accepted 21 March 2007)
The size distribution and morphology of particles (dense or hollow) produced from polydispersed droplets in spray pyrolysis were studied both experimentally and theoretically. Zirconia, generated from a zirconyl hydroxychloride precursor, was selected as a model material. The simulation method that was previously developed by our group [J. Mater. Res., 15, 733 (2000)], in which droplets were assumed to be uniform, was improved to evaluate the effect of polydispersity in droplets on the size and morphology of the resulting particles. Simultaneous equations for heat and mass transfer of solvent evaporation and solute mass transfer inside droplets were solved numerically for a number of discrete classes of droplet size distribution. The role of the decomposition reaction was also included after the evaporation stage of polydispersed droplets in an attempt to explain the densification of particles. In hollow particle generation, this simulation was used to evaluate the thickness of a particle shell. The experimental results were in good agreement with the simulation data, suggesting that the model provides a more realistic prediction.
I. INTRODUCTION
Spray pyrolysis is widely used for particle synthesis. It provides the ability to control and maintain uniform chemical composition from droplet to particle for single and multicomponent materials and to produce submicron and micron size, high-purity, and unagglomerated particles.1 The limited industrial application of spray pyrolysis is frequently attributed to inadequacies associated with the control of particle morphology.2 It has been shown that the morphology of particles generated from droplets that are sprayed by an ultrasonic nebulizer are not uniform in a single operation.3 They can be hollow, dense, or a mixture of dense and hollow particles. Attempts have been made to control and predict particle morphology both experimentally and numerically. In particular, the modeling of droplet to particle conversion in spray pyrolysis process was attempted by a few
a)
Address all correspondence to this author. e-mail:
[email protected] DOI: 10.1557/JMR.2007.0235 1888
J. Mater. Res., Vol. 22, No. 7, Jul 2007
groups. Many parameters have been considered in these investigations, such as droplet size, droplet size distribution, droplet number concentration, precursor concentration, physical and chemical properties of droplets, and operation conditions.4,5 These parameters influence the rates of evaporation and solute diffusion inside a droplet, which, in turn, determines the morphology of the generated particles. Jayanthi et al. numerically solved the mass and heat transport equations for the evaporation stage of particle formation including mass diffusion inside the droplet.6 Nesic and Vodnic and Elperin and Krasovitos took into account evaporation through the porous shell after the evaporation stage.7,8 Their simulation was used to evaluate the solute concentration distribution inside a droplet. However, droplet number concentration and size distribution were neglected. Xiong and Kodas modeled particle formation by considering the droplet number concentration assuming a uniform droplet size and simplified the solute mass transfer equation to determine solute concentration within a droplet.1 Our group modeled both droplet number concentration and solute concentration distribution inside a droplet by simultaneously © 2007 Materials Research Society
W. Widiyastuti et al.: Simulation and experimental study of spray pyrolysis of polydispersed droplets
solving the heat and mass transfer equations of vapor and solute diffusion.3 This modeling was validated by experimental work. However, in all of these studies, the homogenous droplet size, taken from the average value of droplet size distribution measurements, was assumed to be constant. In fact, the droplet size distribution is an important factor in predicting the final particle size distribution. This work attempted to predict the particle size distribution for droplets with a polydispersed size distribution sprayed in a laminar flow by a spray pyrolysis process. Further, in the spray pyrolysis process, the shrinkage of droplets to final particles is not only due to evaporation, but to a decomposition reaction different from that in a spray drying process. Decomposition reaction has not been considered in previous modeling studies. In this study, morphology as a function of each class of particle size distribution considering evaporation and decomposition reaction stages was investigated. The break-up of particles is also a subject of interest. Previous investigations revealed that the break-up of particles was caused by the evaporation of solvent trapped in the hollow crust of particles.3,9 Che et al. qualitatively clarified that particle structure was controlled by intraparticle reaction during the formation process.10 An analysis of such reaction, in addition to a heating rate analysis in particle breaking phenomena should be considered because thermal decomposition reaction usually produces a gas as a byproduct, thus increasing the pressure inside hollow particles. By considering these parameters, the influence of droplet size distribution on the morphology of final particle size distribution can be predicted more reliably. To validate our simulation results, an experimental study was also conducted, and the results are reported in this paper. II. EXPERIMENTAL PROCEDURES
The experimental work was performed as described in our previous paper.3 A zirconyl hydroxychloride solution (equal with 20 wt% of zirconia, Nippon Light Metal Co., Shizuoka, Japan) was used as the precursor for generating zirconia (ZrO2) particles. The solution was atomized using an ultrasonic nebulizer (1.7 MHz, NE-U17, Omron Healthcare Co., Ltd., Tokyo, Japan). Droplet size distribution was measured using laser diffraction technology (Spraytec, Malvern Instruments, Ltd., Worcestershire, UK). Using 2 l min−1 nitrogen as the carrier gas, the droplet number concentration was 8.2 × 10¹² m−3 or 3.9 × 10⁻² vol%, calculated from the amount of precursor required to generate droplets. The droplets, carried by a stream of nitrogen, passed through a tubular alumina furnace with an inner diameter of 13 mm and a length of 1000 mm. The furnace was equipped with five independently controlled heating zones, each 200 mm in length.
The flow was laminar with a calculated Reynolds number of 310. Kinetic information was obtained by thermogravimetric–differential thermal analysis (TG-DTA). A 20 mg sample of original zirconyl hydroxychloride precursor solution was decomposed at several heating rates using nitrogen at 200 ml min−1 in a TG-DTA apparatus (TG/ DTA6200, Exstar 6000-Seiko, Tokyo, Japan). The first peak in the DTA thermograph is due to the evaporation of water as solvent in the precursor. The second peaks, representing the decomposition temperatures of zirconyl hydroxychloride to zirconium oxide were 332.2, 339.5, 344.1, 355.7, 358.4, and 361.9 °C for heating rates of 3, 4.5, 6, 10, 12.5, and 15 °C min−1, respectively. The TG analysis also characterized the mass reduction to form zirconium oxide at those temperatures. The crystal characteristics of particles was analyzed by an x-ray diffractometer (XRD; RINT 2200V, Rigaku-Denki Corp., Tokyo, Japan) using Cu K␣ radiation (wavelength ⳱ 1.54 Å) operated at 40 kV and 30 mA. The morphology was examined using a field-emission scanning electron microscope (FE-SEM; S-5000, Hitachi Corp., Tokyo, Japan) operated at 20 kV, and high magnification of the generated particles was obtained using transmission electron microscopy (TEM; JEM-3000F, JEOL, Tokyo, Japan) operated at 300 kV. The selected-area electron diffraction (SAED) coupled in TEM was also used to analyze the crystallinity of the particles. The particle size distribution was determined by randomly sampling more than 400 particles from FE-SEM photographs. III. MODEL DEVELOPMENT A. Evaporation stage
The droplet assumptions applied to the model are as follows: (i) The total volume of droplets is very small compared to the system volume. Therefore, particle– particle interactions and the effects of the particle volume fraction of the dispersed phase on the continuous phase are negligible. (ii) The droplets are randomly distributed in the domain system. (iii) The droplets are spherical. (iv) The total number of droplets in the system is constant during the entire process of synthesis. (v) The continuum regime is applicable, since the average distance between two droplets is large compared to the droplet radius (i.e., the Knudsen number Ⰶ 1). The flow and temperature fields inside the furnace were calculated using a commercial computational fluid dynamics (CFD) code, FLUENT 6.2. To validate the CFD result, the temperature distribution along the axis of the furnace was measured by a thermocouple. Nitrogen, at room temperature, was allowed to flow into the furnace at a rate of 2 l min−1, isothermally heated through the wall, e.g., 500 °C in this case. The simulation of temperature distribution agreed well with the measured
J. Mater. Res., Vol. 22, No. 7, Jul 2007
1889
W. Widiyastuti et al.: Simulation and experimental study of spray pyrolysis of polydispersed droplets
temperature, as shown in Fig. 1. The result was used to simultaneously calculate solvent evaporation and solute diffusion, which are dependent on the local temperature of the continuous phase on j size classes. j is the number of size classes. The size classes for calculation are similar to size classes for droplet measurement. The results of the droplet size distribution measurements are shown in Fig. 2. For the calculation, the size distribution was divided into 18 size classes, which increased consecutively with droplet size. It was assumed that there was neither droplet disruption nor coagulation during the process. Therefore, the final particle size distribution is directly correlated with the droplet size distribution. The equations for evaporation rate, water vapor balance, and droplet surface temperature were adopted from previous papers.1,3,6 However, the equations were modified in this work by including different size classes of particle distribution. To solve the evaporation process for polydisperse aerosol droplets, the polydisperse distribution was divided into monodisperse size fractions.11 Therefore, the solvent evaporation rate can be determined by the change in droplet mass of size i (mi) because the decrease in droplet mass is caused only by solvent evaporation: dmi 2ddiDvM = 共ng − nsat,i兲 for dt NA dd ⬎ and i = 1, 2, . . . , j
,
(1)
where Dv is the diffusion coefficient of solvent vapor in the carrier gas (water vapor-N2 system), NA is Avogadro’s constant, M is the molecular weight of water as solvent, and nsat and ng are the vapor concentrations at the droplet surface and in the surrounding carrier gas, respectively. The Kelvin effect can be neglected when the droplet diameter (dd) is much greater than the mean
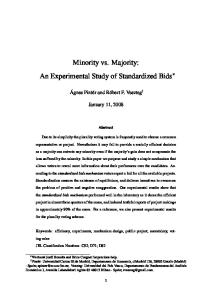
FIG. 2. Shrinkage of droplets to particles due to evaporation and the decomposition reaction at different wall furnace temperatures.
free path for molecules in a gas () or larger than 100 nm (dd Ⰷ or dd Ⰷ 100 nm). is the Fuchs correction factor or a Knudsen correction to account for the effect of transport that is controlled not only by diffusion, but also by kinetic processes. The correction factor is as follows12: =
2 + dd dd + 5.33共2 Ⲑ dd兲 + 3.42
1890
(2)
The vapor concentration at the droplet surface can be calculated using the equation below: nsat,i =
xw,i psat,i , kBTsat,i
(3)
where psat,i is the vapor pressure at the droplet surface and xw is the mol fraction of solvent in the droplet surface, assuming an ideal solution. The diffusion coefficient for the water–nitrogen correlation is taken from Luijtcen et al.13: 1.13 ⳯ 10−5 T2.159 . Dv = P
FIG. 1. Measurement and simulation of temperature distribution along the center of the furnace axis using 2 l min−1 of nitrogen as carrier gas flow with a constant wall temperature of 500 °C.
.
(4)
Other physical properties, also considered as a function of temperature, such as heat capacity and viscosity, were taken from Poling et al.14 When the solute begins to precipitate at the droplet surface, characterized by the solute concentration reaching equilibrium saturation (ES), vapor diffusion through the precipitated solute should be included in the determination of the solvent evaporation rate at this stage, i.e., the second evaporation.7 The second evaporation rate of the remaining solvent can be expressed by the change in droplet mass of size i (mi) as the following equation:
J. Mater. Res., Vol. 22, No. 7, Jul 2007
W. Widiyastuti et al.: Simulation and experimental study of spray pyrolysis of polydispersed droplets
dmi ddiDvSh共ng − nsat,i兲 = ShDv dt ␦ 1+ 2Dc 0.5ddi − ␦
(5)
,
where Dc is the crust diffusion coefficient and ␦ is the thickness of the formed crust. The value for vapor diffusion through the precipitated zirconia solution is considered to be similar to the value for the precipitated sodium sulphate solution, assuming that the precipitation mechanism of both materials is similar. They became impermeable and rigid when precipitated. The crust diffusion coefficient value was 1.5 × 10⁻⁷ m2 s−1, assuming no influence of temperature.7 A balance of the water vapor concentration in the surrounding carrier gas ng due to solvent evaporation was similar to the equation applied by Xiong and Kodas1:
Cp is droplet heat capacity, and ⌬Hv is latent heat of evaporation. Tg is the temperature of carrier gas as a continuous phase in the surrounding droplets. The temperature distribution along the radius of a droplet or particle was ignored because the Biot number (Bi ⳱ hddd/2kd) was much less than 0.1. When the temperature distribution inside a droplet/particle is ignored, an error of less than 5% is found when Bi < 0.1. The solute diffusion rate inside the droplet was calculated based on Fick’s law. The resulting solute concentration profile Cj,r as a function of droplet radius and time can be expressed as follows:
冉
n
2Kv共ng − nw兲 dng = −2Dv 关ddiNi共ng − nsat,i兲兴 − . dt Rt i=1 (6)
冱
Ni is the droplet number concentration of size class i, Kv is the vapor mass transfer coefficient, and Rt is the radius of the tubular reactor. Vapor mass transfer coefficient Kv was obtained from the Sherwood number, Sh. The Sherwood number correlations for a laminar flow in a tube are as follows: Sh = 3.66 Sh = 1.86
冉
2Rt ReSc L
冊
1Ⲑ3
冉 冉
2Rt ReSc L 2Rt ReSc if L
if
冊 冊
1Ⲑ3
1Ⲑ3
⬍2
,
艌2
,
where the Sherwood number Sh ⳱ 2RtKv/Dv, the Reynolds number Re ⳱ 2Rtv/, and the Schmidt number Sc ⳱ /(Dv). Because the droplet velocity is assumed to be similar to that of the carrier gas, the heat-transfer coefficient (hd) around a droplet submerged in a no flow fluid can be determined using the following equation: Nu =
hd dd =2 kg
,
where kg is the thermal conductivity of the carrier gas. Under slow growth conditions, the droplet temperature will be approximately the same as the ambient temperature (Ts ≅ T⬁).12 However, in this work, a change in droplet temperature Ts,i, which occurs due to the evaporation of water and droplet heating from the surrounding gas to the droplet surface, should be considered and calculated using the following equation:
冋 冉 冊
1 dmi dTs,i = ⌬Hv + dp,iNuikg共Tg − Ts,i兲 dt miCp dt
册
. (7)
冊
⭸Cj,r 1 ⭸ 2 ⭸Cj,r = 2 r Ds ⭸t ⭸r r ⭸r 0艋t⬍⬁ , dpi , 0艋r艋 2 j = 1, 2, . . . , l ,
,
(8)
where Ds is diffusion coefficient of solute-solvent system (1 × 10⁻⁹ m2/s).6 The initial condition for solute concentration Co along droplet radius r is uniform. The boundary condition on the droplet surface is based on the water vapor equilibrium calculated by Eqs. (1) and (5), corresponding to before and after crust formation, respectively. The partial differential equation (PDE) was solved simultaneously with previous ordinary differential system equations (ODEs) since the droplet size decreases in the evaporation process. The Runge Kutta and finite difference methods were used to numerically solve these ODEs and PDE, respectively. The numerical calculation was performed using MATLAB (MathWorks, Inc., Natick, MA). To solve Eq. (8), the moving boundary problem caused by droplet shrinkage due to solvent evaporation was solved by the dimensionless transformation [Xj(t)] using the following equation: 2rj in which Xj = 0, 1, 2, . . . , l . Xj共t兲 = dpi共t兲 (9) This method was also applied by Sloth et al. to solve a moving boundary problem.15 The information that can be obtained by solving the previous equations is the size of droplet shrinkage and the solute concentration profile as a function of the path length from the furnace entrance. A hollow particle will be generated if the solute concentration in the droplet center is less than equilibrium saturation (ES) when the solute concentration in the droplet surface has reached critical supersaturation (CSS). The values of ES and CSS are 5.7 and 8 mol l−1, respectively, based on the results of Zhang et al.2
J. Mater. Res., Vol. 22, No. 7, Jul 2007
1891
W. Widiyastuti et al.: Simulation and experimental study of spray pyrolysis of polydispersed droplets
B. Decomposition/reaction stage
Apart from physical processes such as evaporation and second evaporation (drying), a chemical reaction referred to as thermal decomposition occurs in spray pyrolysis. Thermal analysis data for a zirconyl hydroxychloride precursor has been reported by Zhang et al.2 They concluded that oxide formation occurred at 350 °C, as determined by TG-TDA analysis using a heating rate of 10 °C min−1 in an air flow. However, as is well known, decomposition temperature is influenced by the heating rate and the residence time used in the process. It would be better to analyze the decomposition reaction using several sets of thermal analysis data at different heating rates to obtain a kinetic reaction equation determined by activation energy, as described in the Appendix. The general kinetic equation representing the decomposition reaction can be stated as follows:
冉 冊
Ea dxR = k 共T兲 f 共xR兲 = A exp − f 共xR兲 , dt RT
(10)
where dxR/dt is the reaction rate, x is the fraction reacted, k(T) is the Arrhenius equation, and f(xR) is the function of fraction reacted. The function f(xR) depends on the mechanism of the decomposition reaction. The rate of decomposition of precipitated zirconyl hydroxychloride to form zirconia follows the normal grain growth mechanism with the detailed kinetic reaction equation: dxR = k 共T兲 f 共xR兲 = dt
冉
9.67 ⳯ 1012 exp −
冊
159.77 ⳯ 103 共1 − xR兲9 Ⲑ 4 . RT (11)
The selection of an appropriate model for the decomposition reaction is described in the Appendix. Equation (11) was simultaneously used with equations in the evaporation and drying step to calculate the densification of particles by considering the density of the fraction reacted. To determine the final size as the result of oxide formation, a correction for the particle size due to evaporation is necessary. The correction was only for the outer diameter of a particle assuming that the inner diameter of a hollow particle is not changed during oxide formation. The final diameter is expressed as follows:
冉
冋
3 3 dp(final) = d3in + C共dout(evaporation stage) − din 兲
+
MWp x p R
册冊
1Ⲑ3
.
IV. RESULTS AND DISCUSSION
Figure 2 shows the shift in the distribution of droplet size to particle size based on the simulation results. Particle size shrinkage was observed by increasing the temperature. Further shrinkage or smaller generated particles were found for temperatures of 500 and 700 °C, indicating that a decomposition reaction had occurred. This shrinkage can be explained as having occurred after the evaporation stage, during which the particle underwent densification due to decomposition reaction. Decomposition reaction occurs when its activation energy is surpassed. An experimental study concerning the change in particle size distribution in a spray pyrolysis process for TiO2 synthesis was reported by Deguchi et al.16 Similar results to our simulation data were also obtained in the case where the particle size became smaller when particles evolved via a thermal decomposition reaction compared to particles that evolved only via an evaporation process. To evaluate the fraction that reacted at different synthesis temperatures, Eq. (11) was solved using the fourth order Runge Kutta method, as shown in Fig. 3. It shows that the decomposition reaction can be completed rapidly at high temperatures. For example, the reactions were almost complete within 60 and 20 cm in a furnace at 500 and 700 °C, respectively. However, a complete decomposition reaction cannot be achieved at a low temperature. Only 8.5% and almost none of the precipitated solute were decomposed to the oxide form at furnace wall temperatures of 300 and 150 °C. This is because the energy supplied from the furnace wall can not exceed the activation energy. In addition, the fraction reacted tends
1 共1 − xR兲 C (12)
This equation was adopted from the one-droplet to one-particle principle in spray pyrolysis process and 1892
modified for application to hollow particles and the decomposition reaction fraction.
FIG. 3. Precursor decomposition reaction along 1 m furnace length as a function of the wall furnace temperature.
J. Mater. Res., Vol. 22, No. 7, Jul 2007
W. Widiyastuti et al.: Simulation and experimental study of spray pyrolysis of polydispersed droplets
FIG. 4. Droplet shrinkage along the furnace length due to evaporation: (a) 150 °C, (b) 300 °C, (c) 500 °C, and (d) 700 °C, Co ⳱ 2 mol l−1 and Q ⳱ 2 l min−1.
to increase with residence time. The residence time of the pyrolysis process was determined by the rate of carrier gas and the temperature of the process, which follows an ideal gas calculation resulting in a shorter residence time
() with increasing temperature, as stated in the Fig. 3. It can be seen that a temperature generating energy greater than its activation energy leads to a faster reaction. This is necessary for further particle densification.
FIG. 5. FE-SEM images showing the effect of wall furnace temperature on zirconia particle morphology: (a) 150 °C, (b) 300 °C, (c) 500 °C, and (d) 700 °C, Co ⳱ 2 mol l−1 and Q ⳱ 2 l min−1. J. Mater. Res., Vol. 22, No. 7, Jul 2007
1893
W. Widiyastuti et al.: Simulation and experimental study of spray pyrolysis of polydispersed droplets
FIG. 6. TEM and SAED images showing the effect of wall furnace temperature on the morphology zirconia particles: (a) 150, (b) 300, (c) 500 and (d) 700 °C, Co⳱2 mol l−1 and Q ⳱ 2 l min−1.
The prediction of droplet shrinkage for each class of size distribution due to evaporation at (a) 150 °C, (b) 300 °C, (c) 500 °C, and (d) 700 °C, is shown in Fig. 4. The evaporation time is expressed as the length from the furnace inlet necessary for complete evaporation. From the figure, it can be seen that the furnace temperature and droplet size class are the two main parameters in controlling the evaporation rate. The evaporation rate increases with increasing furnace temperature, which decreases the length furnace required for complete evaporation. Lower size classes evaporate faster than higher size classes. It can be seen that the furnace length necessary for complete evaporation increases with size class. Figure 5 shows the effect of temperature on the final particle morphology, as evidenced by FE-SEM analysis. For low temperatures of 150 and 300 °C, as shown in Figs. 5(a) and 5(b), spherical particles can be seen in FE-SEM images. However, in the cases of high temperatures such as 500 and 700 °C, most of the particles are broken, as shown in Figs. 5(c) and 5(d). It can be seen that most of the particles are originally hollow and then 1894
become broken. For confirmation of the particle inner structure, TEM pictures are depicted in Fig. 6. From Figs. 6(a) and 6(b), the TEM images show that dense particles were generated at temperatures of 150 and 300 °C. On the other hand, broken particles can clearly be seen for temperatures of 500 and 700 °C in Figs. 6(c) and 6(d). Most previous investigations of particle generation by the spray pyrolysis method have proposed mechanisms that are similar to the spray drying method.3,6,17 No clear explanation for particle break-up, except solvent boiling, has been given. If hollow particles were generated, the precipitated droplets would be shell-like with liquid solvent trapped in the inner part. If the solvent boiled, it would be possible to break up the shell. In addition, crystallization due to the high temperature would generate an impermeable crust that would be broken, not only by the boiling solvent but also by gases that are produced as by-products in the decomposition reaction. The decomposition reaction depends on the kinetics of oxide formation. A decomposed or oxide crust is less permeable than a crust formed of only precipitated
J. Mater. Res., Vol. 22, No. 7, Jul 2007
W. Widiyastuti et al.: Simulation and experimental study of spray pyrolysis of polydispersed droplets
FIG. 7. Comparison of simulation, dense particle assumption and particle sizes measured from SEM images at: (a) 150, (b) 300, (c) 500 and (d) 700 °C of wall furnace temperature.
precursor. It leads to the breakage of hollow particles generated by furnace wall temperatures of 500 and 700 °C. Previous investigations revealed definite criteria for the determination of hollow particle generation, which depends on equilibrium saturation and supercritical saturation values in solving solute diffusion in a droplet.3,6 A numerical simulation resulted in the prediction of dense particles for all classes of size distribution for furnace wall temperatures of 150 and 300 °C. The result corresponds to a simple calculation involving one droplet to one dense particle (dense assumption) applied to each class of size distribution, as shown in Figs. 7(a) and 7(b). The equation can be described as follows: dp = dd
冉 冊 CMp p
1Ⲑ3
,
(13)
where dp, dd, C, Mp, and p are the final particle diameter, initial droplet diameter, concentration of initial precursor, molecular weight of the generated particle, and density of the generated particle, respectively. The molecular weight and density applied to this equation should take into account the fraction that decomposes to oxide particles. In the case of high temperatures such as 500 and 700 °C, as shown in Figs. 7(c) and 7(d), the numerical simulation resulted in final particle prediction greater than the value calculated using Eq. (13). This leads to the conclusion that the generated particles were hollow. The numerical simulation was in better agreement with experimentally measured values from FE-SEM images.
FIG. 8. XRD analysis at different wall furnace temperatures, Co ⳱ 2 mol l−1 and Q ⳱ 2 l min−1.
Equation (13), derived from the case in which one droplet generates one dense particle, cannot be applied to the case of hollow particle formation. To investigate the temperature effect on particle crystallization, XRD analysis results are shown in Fig. 8. The
J. Mater. Res., Vol. 22, No. 7, Jul 2007
1895
W. Widiyastuti et al.: Simulation and experimental study of spray pyrolysis of polydispersed droplets
form by dividing the inner diameter by the outer diameter of the hollow particles (di /do). The value for di /do increased with increasing the initial diameter of droplet size distribution. The simulation results for shell thickness at temperatures of 500 and 700 °C were in good agreement with the experimentally determined shell thickness, as shown in Figs. 9(a) and 9(b). Smaller droplets lead to complete solute precipitation due to shorter evaporation times in lower temperature region than those for larger droplets (Fig. 4). In contrast, larger particles tend to generate hollow particles. The difference in precipitation conditions can lead to differences in morphology of the generated particles.19 Therefore, the droplet size distribution spreading plays a role in determining the evolution of particle morphology.
V. CONCLUSIONS
FIG. 9. Prediction of shell thickness at: (a) 500 and (b) 700 °C of wall furnace temperatures, Co ⳱ 2 mol l−1 and Q ⳱ 2 l min−1.
crystallinity increased with an increase in temperature. At furnace wall temperatures of 150 and 300 °C, no crystalline zirconia was observed while good crystallinity was obtained for temperatures of 500 and 700 °C. The XRD patterns were in good agreement with SAED images, as shown in Figs. 6(a)–6(d, inset), in which the sharpness of diffraction rings increases with increasing furnace temperature.18 The synthesis of particles at temperatures lower than their decomposition reaction temperature involve complete solute precipitation in a droplet, which results in the production of dense particles. On the contrary, the synthesis of particles at temperatures higher than the decomposition reaction temperature results in surface precipitation, which leads to the production of hollow particles. Hollow particles were generated when a high evaporation rate was used, which leads to a drastic increase in droplet surface concentration. Meanwhile, the solute diffusion rate was not sufficiently high to achieve the equilibrium saturation necessary for precipitation in the center of a droplet. An expression for predicting the shell thickness of hollow particles can be stated in dimension 1896
The criteria for predicting particle morphology, i.e., dense or hollow, including shell thickness as a function of size distribution in the spray pyrolysis process, were studied both numerically and experimentally. In the case of zirconia synthesis, our simulation results were in good agreement with experimental findings. Evaporation and decomposition reaction stages were considered in the prediction. For temperatures of 150 and 300 °C, the simulation results show that the decrease in each class of size distribution was influenced only by the evaporation stage. For temperatures of 500 and 700 °C, the decrease was due not only to evaporation, but also to a decomposition reaction. The decomposition reaction, as well as evaporation, played a role in determining the final size, morphology, and break-up of particles in each class of size distribution. The particle size synthesized by temperatures exceeding its decomposition reaction temperature was smaller than that for temperatures lower than its decomposition reaction temperature. The prediction regarding size distribution is more reliable in applications due to a droplet generator, which cannot produce a uniform droplet size.
ACKNOWLEDGMENTS
The authors wish to thank Shunsuke Kinouchi for droplet size distribution measurement, Takashi Ogi for TEM analysis, and Nippon Light Metal, Shizuoka, Japan, for providing zirconyl hydroxychloride solution. The Ministry of Education, Culture, Sports, Science and Technology (MEXT) of Japan and the Japan Society for the Promotion of Science (JSPS) are acknowledged for providing a doctoral scholarship (W. Widiyastuti) and a postdoctoral fellowship (W.N. Wang), respectively. Grants-in-aid sponsored by MEXT and JSPS are acknowledged (K. Okuyama, I.W. Lenggoro).
J. Mater. Res., Vol. 22, No. 7, Jul 2007
W. Widiyastuti et al.: Simulation and experimental study of spray pyrolysis of polydispersed droplets
Notation A Bi C Cp D Ea K M N NA Nu P Q R Rt Re S Sc Sh T X d h k kB l m n n p t X
pre-exponential factor, min−1 Biot number, dimensionless solute concentration, kmol m−3 heat capacity, J kg−1 K−1 diffusion coefficient, m2 s−1 activation energy, kJ mol−1 mass transfer coefficient, m s−1 molecular weight, kg kmol−1 droplet number concentration, m−3 Avogadro constant, 6.022 × 1026 molecules kmol−1 Nusselt number, dimensionless pressure, Pa flow rate of carrier gas, l min−1 gas constant, 8.31451 J K−1 mol−1 tube radius, m Reynolds number, dimensionless Kissinger’s analytical parameter, dimensionless Schmidt number, dimensionless Sherwood number, dimensionless temperature, K radius position transformation, dimensionless diameter, m heat-transfer coefficient, J s−1 m−2 K−1 thermal conductivity, W m−1 K−1 Boltzmann’s constant, J K−1 grid number (dimensionless) mass, kg molecule number concentration, m−3 reaction order (dimensionless) partial pressure, N m−2 time, s velocity, m s−1 mol fraction, dimensionless
Abbreviations CSS ES ODE PDE
critical supersaturation equilibrium saturation ordinary differential equation partial differential equation
Greek Letters ⌬Hv ␣  ␦
latent heat of evaporation first Kissinger’s analytical parameter second Kissinger’s analytical parameter crust thickness, m mean free path for molecules in a gas, m viscosity, kg m−1 s−1 Fuchs correction factor (dimensionless) heating rate, K min−1 density, kg m−3 residence time, s
Subscripts c d g i in j o out p R r s sat v
crust droplet gas index for the size class inner part grid index initial condition outer part particle reaction or decomposition radius coordinate solute saturated (for droplet surface assumption) vapor
w ⬁
water ambient/surrounding
REFERENCES 1. Y. Xiong and T.T. Kodas: Droplet evaporation and solute precipitation during spray pyrolysis. J. Aerosol Sci. 24, 893 (1993). 2. S.C. Zhang, G.L. Messing, and M. Borden: Synthesis of solid, spherical zirconia particles by spray pyrolysis. J. Am. Ceram. Soc. 73, 61 (1990). 3. I.W. Lenggoro, T. Hata, F. Iskandar, M.M. Lunden, and K. Okuyama: An experimental and modeling investigation of particle production by spray pyrolysis using a laminar flow aerosol reactor. J. Mater. Res. 15, 733 (2000). 4. K. Okuyama and I.W. Lenggoro: Preparation of nanoparticles via spray route. Chem. Eng. Sci. 58, 537 (2003). 5. V. Jokanovic, B. Jokanovic, J. Nedeljkovic, and O. Milosevic: Modeling of nanostructured TiO2 spheres obtained by ultrasonic spray pyrolysis. Colloid Surf. A 249, 111 (2004). 6. G.V. Jayanthi, S.C. Zhang, and G.L. Messing: Modeling of solid particle formation during solution aerosol thermolysis: The evaporation stage. Aerosol Sci. Technol. 19, 478 (1993). 7. S. Nesic and J. Vodnik: Kinetics of droplet evaporation. Chem. Eng. Sci. 46, 527 (1991). 8. T. Elperin and B. Krasovitos: Evaporation of liquid droplets containing small solid particles. Int. J. Heat Mass Tran. 38, 2259 (1995). 9. G.L. Messing, S.C. Zhang, and G.V. Jayanthi: Ceramic powder synthesis by spray pyrolysis. J. Am. Ceram. Soc. 76, 2707 (1993). 10. S. Che, O. Sakurai, K. Shinozaki, and N. Mizutani: Particle structure control through intraparticle reactions by spray pyrolysis. J. Aerosol Sci. 29, 271 (1998). 11. G.A. Ferron, C. Roth, B. Busch, and E. Karg: Estimation of the size distribution of aerosols produced by jet nebulizers as a function of time. J. Aerosol Sci. 28, 805 (1997). 12. W.C. Hinds: Aerosol Technology: Properties, Behavior, and Measurement of Airborne Particles, 2nd ed. (John Wiley & Sons, New York, 1999), pp. 288, 286. 13. C.C.M. Luijten, K.J. Bosschaart, and M.E.H. van Dongen: A new method for determining binary diffusion coefficients in dilute condensable vapors. Int. J. Heat Mass Tran. 40, 3497 (1997). 14. B.E. Poling, J.M. Prausnitz, and J.P. O’Connell: The Properties of Gases and Liquids, 5th ed. (Mc. Graw-Hill Inc., New York, 2001), pp. A.45, 9.75. 15. J. Sloth, S. Kiil, A.D. Jensen, S.K. Andersen, K. Jorgensen, H. Schiffter, and G. Lee: Model based analysis of the drying of a single solution droplet in an ultrasonic levitator. Chem. Eng. Sci. 61, 2701 (2006). 16. S. Deguchi, H. Matsuda, M. Hasatani, and N. Kobayashi: Formation mechanism of TiO2 fine particles prepared by the spray pyrolysis method. Dry. Technol. 12, 577 (1994). 17. H-F. Yu: Simulation of spray pyrolysis for ceramic powder preparation. Particul. Sci. Technol. 13, 149 (1995). 18. D.B. Williams and C.B. Carter: Transmission Electron Microscopy: A Textbook for Materials Science (Springer Science Business Media, New York, 1996), p. 30. 19. T.T. Kodas and M.J. Hampden-Smith: Aerosol Processing of Materials (Wiley-VCH., Canada, 1999), p. 387. 20. Z.Z. Yuan, X.D. Chen, B.X. Wang, and Y.J. Wang: Kinetics study on non-isothermal crystallization of the metallic Co43Fe20Ta5.5B31.5 glass. J. Alloy Compd. 407, 163 (2006). 21. M.N. Rahaman: Ceramic Processing and Sintering, 2nd ed. (Marcel Dekker, New York, 2003), p. 68.
J. Mater. Res., Vol. 22, No. 7, Jul 2007
1897
W. Widiyastuti et al.: Simulation and experimental study of spray pyrolysis of polydispersed droplets
22. H.E. Kissinger: Reaction kinetics in differential thermal analysis. Anal. Chem. 29, 1702 (1957).
APPENDIX
The activation energy for decomposition reaction can be calculated from the Arrhenius kinetic reaction equation: ln
冉 冊
2 TR
=−
冉 冊
AR Ea + ln RTR Ea
,
(A1)
where is the heating rate, TR is the decomposition temperature, Ea is the activation energy for the decomposition reaction, A is the pre-exponential factor, and R is the gas constant. By using the least-squares statistical method, the activation energy can be obtained. By plot2 ting − ln共 Ⲑ TR 兲 versus 1/TR for six selected heating rates it is possible to ascertain the values of Ea and A from the gradient and intercept, respectively, as shown in Fig. A1. The values from this correlation were 159.77 kJ mol−1 and 9.67 × 10¹² min−1, respectively. Three theoretical kinetic equations describing decomposition/crystallization mechanisms were examined. The models correspond to the ordinary kinetics of chemical reactions reflecting different assumptions for nucleation and crystal growth.20,21 Normal grain growth, Johnson– Mehl–Avrami, and three-dimensional diffusion models tend to be influenced by the reaction order, nucleation controlling reaction, and a diffusion controlling reaction, respectively.
FIG. A2. Kinetic model for describing the decomposition of the zirconyl hydroxychloride precursor.
f共xR兲 = 共1 − xR兲n+1
Normal grain growth (NGG)
f共xR兲 = n共1 − xR兲关− ln共1 − xR兲兴共n−1兲 Ⲑ n Johnson-Mehl-Avrami (JMA) f共xR兲 = 关共1 − xR兲−1 Ⲑ 3 − 1兴−1 Three-dimensional diffusion (3D−D)
The reaction order (n) determined by Kissinger, was solved by the nonlinear equation in Eq. (A3) using Microsoft Excel. The value of the reaction order was calculated to be 1.25, not influenced significantly by the decomposition temperature of the selected heating rate.
␣=
冑 冉 冊冉 9−4 2−
冉 冊
=2 2−
1898
(A2)
22
n = 1.26S1 Ⲑ 2 共3 − ␣兲关 − 共3 − ␣兲兴 S= 共3 + ␣兲关 − 共3 + ␣兲兴
FIG. A1. Activation energy for the decomposition reaction of zirconyl hydroxychloride to zirconium oxide determined by using TG-DTA analysis.
.
1 n
.
1 n
1−
2RTR Ea
冊 (A3)
S, ␣, and  are the analytical parameters derived by Kissinger, which are only a function of the reaction order. ln[k(T)f(xR)] versus −ln(1 − xR) for each model was compared with experimental data taken from TG-DTA. Of the three models, the normal grain growth (NGG) showed the best fit, indicating that the NGG reaction mechanism adequately describes the formation of zirconia from the zirconyl hydroxychloride precursor, as shown in Fig. A2.
J. Mater. Res., Vol. 22, No. 7, Jul 2007