D. Ververidis and C. Kotropoulos, "Sequential forward feature selection with low computational cost," in Proc. European Signal Processing Conference (EUSIPCO), Antalya, Turkey, 2005.
SEQUENTIAL FORWARD FEATURE SELECTION WITH LOW COMPUTATIONAL COST Dimitrios Ververidis and Constantine Kotropoulos Department of Informatics, Aristotle University of Thessaloniki Box 451, Thessaloniki 541 24, Greece E-mail: {jimver, costas}@zeus.csd.auth.gr ABSTRACT This paper presents a novel method to control the number of crossvalidation repetitions in sequential forward feature selection algorithms. The criterion for selecting a feature is the probability of correct classification achieved by the Bayes classifier when the class feature probability density function is modeled by a single multivariate Gaussian density. Let the probability of correct classification achieved by the Bayes classifier be a random variable. We demonstrate by experiments that the probability density function of the latter random variable can be modeled by a Gaussian density. Based on this observation, a method for reducing the computational burden in sequential forward selection algorithms is proposed. The method predicts the number of crossvalidation repetitions by employing a t-test to guarantee that a statistically significant improvement in the probability of correct classification is obtained by increasing the number of selected features. The proposed method is twice feaster than the sequential forward selection algorithm that uses a fixed number of crossvalidation repetitions and it maintains the performance of the sequential floating forward selection algorithm. 1. INTRODUCTION To estimate the probability of correct classification achieved by the Bayes classifier one usually divides the available data-set into a set used for designing the classifier (i.e. the training set) and a set used for testing the classifier (i.e. the test set). There are methods frequently employed to estimate the probability of correct classification, namely the resubstitution method [1], the leaveone-out method (or Jacknife test) [2], and the crossvalidation method [3, 4]. The resubstitution method uses the whole data-set for training and testing the classifier resulting in a biased estimate of the probability of correct classification. The leave-one-out method alleviates the lack of independence between the training set and the test set in the resubstitution method, because the training is performed using all the samples of the data-set but one. The latter is used for testing. The procedure is repeated for all the samples of the data-set resulting in a long execution time. The crossvalidation method reduces the high computational burden of the leave-one-out method, as it chooses randomly a number of samples greater than one from the data-set to construct the test set and uses the remaining samples for training the classifier. This procedure is repeated for several times This work has been supported by the FP6 European Union Network of Excellence MUSCLE “Multimedia Understanding through Semantics, Computation and LEarning” (FP6-507752).
defined by the user and the estimated probability of correct classification is the average correct classification rate for all repetitions. The number of crossvalidation repetitions is usually set between 10 and 100. In this paper, the number of crossvalidation repetitions in sequential forward selection algorithms is controlled through a t-test that guarantees statistically significant improvements in the probability of correct classification for the Bayes classifier, when new features are added. The method results in low computational demands while maintains the same high accuracy achieved by the sequential floating forward selection algorithm for a fixed number of crossvalidation repetitions. The outline of the paper is as follows. In Section 2, the data extracted from the Danish Emotional Speech (DES) database [5] are briefly described. The prosody features extracted from the speech utterances are presented in Section 3. Section 4 treats the probability of correct classification achieved by the Bayes classifier as a random variable and studies its distribution with respect to the number of crossvalidation repetitions and the selection of the feature set. Based on the observations of Section 4, a mechanism that controls the number of crossvalidation repetitions is developed in the next section. The mechanism is incorporated into the sequential floating forward selection (SFFS) algorithm and the sequential forward selection (SFS) algorithm to speed up their execution. A comparison of the time savings between the proposed variant of SFS algorithm and the SFS for a fixed number of crossvalidation repetitions is reported in Section 6. We also demonstrate that the proposed SFFS variant maintains the performance achieved by the SFFS algorithm for a fixed number of crossvalidation repetitions. Finally,conclusions are drawn in Section 7. 2. DATA The audio data used in the experiments consist of 1300 utterances, 800 more than those used in [6], that are manually extracted from DES. Each utterance is a speech segment between two silence pauses. The 800 utterances, that are now included, are detached from paragraphs, whereas the old 500 utterances corresponded to isolated words and sentences. The utterances are expressed by four professional actors, two males and two females, in 5 emotional styles such as anger, happiness, sadness, surprise, and neutral. 3. FEATURE EXTRACTION AND PREPROCESSING Pitch estimates are obtained from the peaks of the short-term autocorrelation function of the speech amplitude. The short-term analysis is performed using windows of duration 15 msec. We assume that pitch frequencies are limited to the range 60-320 Hz. For esti-
mating the 4 formants, we use a method based on linear prediction analysis. The method finds the angle of the poles in the Z plane for an all-pole model and considers the poles that are further from zero as indicators of the formant frequencies. To estimate the energy, a simple short-term energy function has been used. After the evaluation of the primary raw features, secondary statistical features were extracted from the primary ones. The statistical features employed in our study are grouped in several classes. The speech features computed and their corresponding indices can be found in [6]. Let X denote the feature set. Each feature Xk ∈ X , k = 1, . . . , 87 has its own dynamic range. Features with variance of order 106 such as the fourth formant, have greater influence in the classifier design than features with a variance of order 102 such as the mean value of pitch. Thus, a linear transformation is applied to each one of the 87 features. Let ak = mini {Xki } and bk = maxi {Xki } for i = 1, . . . , NS , where NS equals to the total number of utterances. A linear transformation from [ak , bk ] to [0, 1] is applied for each Xk . The exponentially distributed features may lead to an increased computational time and underflow warnings, as they become too dense near the lower bound which in our case is 0+ . Accordingly, after the linear transformation, we apply a logarithmic transformation to the exponentially distributed features.
complement of Lm as Lcm = L − Lm . The probability of error for the Bayes classifier is given by ε=
c X
P (Ωm )
m=1
Z
(4)
pr (x|Ωm ) dx. Lc m
Let the pdf pr (x|Ωm ) be modeled by a single multivariate Gaussian density � � exp − 12 (x − µr;m )T Σ−1 r;m (x − µr;m ) pr (x|Ωm ) = (5) (2π)d/2 |Σr;m |1/2 where µr;m is the mean vector and Σr;m is the covariance matrix of the feature vectors. Let us treat the probability of correct classification achieved by the Bayes classifier Jnrep (Z) as a random variable. Its pdf f (Jnrep (Z)) for a particular feature set Z and several choices of nrep is plotted in Figure 1 when the class pdfs pr (x|Ωm ) are modeled as Gaussian distributions (5). It is seen that Jnrep (Z) follows a Gaussian distribution. 0.4
Sample mean
0.2
4. VARIATION OF THE MEAN PROBABILITY OF CORRECT CLASSIFICATION DURING CROSSVALIDATION PROCEDURE
Jnrep (Z) = 1 − E[{ε(Z, Tr ; Dr )}nrep r=1 ]
(1)
where ε(Z, Tr ; Dr ) is the probability of error for the Bayes classifier designed using Dr during training when it is applied to Tr . In (1) the expectation is applied over the sequence of error probabilities measured over Tr , r = 1, 2, . . . , nrep and the dependence of Jnrep on the feature set Z is explicitly stated. 90% of the available utterances are used to build Dr and the remaining 10% create Tr . The training and the test sets are complementary. Let the features Xk be treated as elements of a d-dimensional random vector x (e.g. a pattern). Let Ωm denote the mth class, P (Ωm ) be the a priori probability of class Ωm , and pr (x|Ωm ) be the class conditional probability density function (pdf). At each crossvalidation repetition r, we assume that the labels of the training set are known, whereas the labels of the test set are unknown. If the number of classes is c, the samples in the training set Dr can be divided into c subsets Dr;m with cardinalities NDr;m , m = 1, 2, . . . , c, such that ND r =
c X
m=1
NDr;m .
(2)
Since the labels of the training set are known the pdf pr (x|Ωm ) of each class Ωm , m = 1, 2, . . . , c, can be estimated. The Bayes classifier assigns the pattern x ∈ Tr to Ωm if P (Ωm ) pr (x|Ωm ) > P (Ωj ) pr (x|Ωj )
(3)
j = 1, . . . , m − 1, m + 1, . . . , c. Let Lm be the region where x is classified to Ωm and L = ∪cm=1 Lm . We also define the
nrep
f(J
The probability of correct classification achieved by the Bayes classifier that uses the feature set Z ⊆ X can be estimated by crossvalidation for nrep repetitions using
(Z))
0 0.35 0.2
0.4
0.45
0.5
0.55
0.6
(b)
0.1 0
0.35
(a)
0.4
0.45
0.5
0.55
0.6
0.2
(c) 0
0.35 0.1
0.4
0.45
0.5
0.55
0.6
(d) 0
0.35
0.4
0.45
0.5
Jnrep(Z)
0.55
0.6
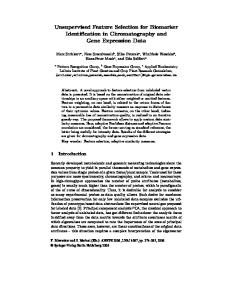
Fig. 1. Probability density function of Jnrep (Z) for several choices of nrep: (a) nrep=10; (b) nrep=50; (c) nrep=300; (d) nrep=1000. The pdf of Jnrep (Zi ) for several feature sets Zi is plotted in Figure 2 when nrep=1000. The pdfs marked by A, B, C correspond to three emotional speech feature sets. For several other pdfs that correspond to real feature sets, the peak at the mode of each pdf is marked with ∗. Moreover, pdfs for artificially created feature sets whose class pdfs are modeled by (5) for five classes have been created. For each pdf, the peak at its mode is marked with ◦. It can be seen that the variance σ 2 (J1000 (Zi )) = var{J1000 (Zi )} depends on the level of J1000 (Zi )} as is quantified by its mean value (i.e. the mode of the pdf) µ(J1000 (Zi )) = 1 − E[{ε(Zi , Tr ; Dr )}1000 r=1 ] = J1000 (Zi ). (6) Let g(J1000 (Zi )) be a polynomial of degree 3 fitted to the peaks of f (J1000 (Zi )) in mean squared error (MSE) sense. The variance of J1000 (Z) can be estimated by σ 2 (J1000 (Zi )) =
1 2πg 2 (J1000 (Zi ))
(7)
14
which is distributed approximately as Student’s t-statistic with a number of degrees of freedom equal to h i2 1 1 + nrep1 nrep2 . (14) κ= 1 1 + 2 nrep1 (nrep1−1) nrep22 (nrep2−1)
pdfs of J1000 for three real data sets A, B, C
pdf peaks for several emotional speech feature sets pdf peaks for artificially generated feature sets polynomial fitted to the pdf peaks
12
(Z))
6
1000
8
f(J
10
The hypothesis (12) is accepted when q > t1−a (κ) where a equals 0.05. The test-statistic depends only on the distance between the corresponding probabilities of correct classification and it is greater when γ becomes smaller. The user selects γ with respect to the computation speed, as it can be inferred from (11). When γ becomes smaller the number of crossvalidation repetitions nrep becomes greater and accordingly the computational time increases.
A B
C
4 2 0 0
0.2
0.4
J
(Z)
0.6
0.8
5. APPLICATION TO SEQUENTIAL FEATURE SELECTION ALGORITHMS
1
1000
Fig. 2. Probability density function of J1000 (Zi ) for several feature set selections Zi . Let us assume that f (J) for infinite crossvalidation repetitions fol2 lows a Gaussian distribution with mean µ∞ and variance σ∞ . If the number of crossvalidation repetitions is set to nrep then f (Jnrep (Z)) follows a Gaussian distribution with the same mean µ∞ and variance σ 2 (Jnrep (Z)) =
2 σ∞ . nrep
(8)
2 Let us estimate σ∞ by σ 2 (J1000 (Z)). Then f (Jnrep (Z)) is a Gaussian pdf with mean µ(J1000 (Z)) and variance
σ 2 (Jnrep (Z)) =
1 . 2π nrep g 2 (J1000 (Z))
(9)
If our aim is to keep the variance σ 2 (Jnrep (Z)) constant, i.e. σ 2 (Jnrep (Z)) = γ
(10)
the number of crossvalidation repetitions should be set equal to nrep =
1 . 2π γ g 2 (J1000 (Z))
(11)
For example, by inspecting Figure 2, it can be seen that the number of crossvalidation repetitions estimated by (11) for the feature set B, that gives a mean probability of correct classification equal to 0.38 when employed in the Bayes classifier, is smaller than that for the feature set C for which the Bayes classifier attains a mean probability of correct classification equal to 0.64. In the following, we are interested in testing the hypothesis Jnrep1 (Z1 ) > Jnrep2 (Z2 ).
(12)
This is accomplished by using the test statistic Jnrep1 (Z1 ) − Jnrep2 (Z2 ) q= r 2 σJ
nrep1 (Z1 )
nrep1
+
2 σJ
nrep2 (Z2 )
nrep2
=
Jnrep1 (Z1 ) − Jnrep2 (Z2 ) √ 2·γ (13)
In this section, we will augment the sequential forward feature selection algorithms, either the standard SFS or its floating variant SFFS, by a mechanism that controls the number of crossvalidation repetitions based on the analysis of Section 4. The SFS consists of a forward step which is as follows: starting from an initially empty set of features Z0 , at each forward (inclusion) step at the level l we seek the feature X + ∈ (X − Zl−1 ) such that for Zl = Zl−1 ∪ {X + } the probability of correct classification achieved by the Bayes classifier J(Zl ) is maximized. In addition to the aforementioned inclusion step the SFFS algorithm [7] applies a number of backward steps (exclusions) as long as the resulting subsets are better than the previously derived ones at this level. Consequently, there are no backward steps at all when the performance cannot be improved. The exclusion step is as follows. We exclude at level l those Z − ∈ Zl as long as the correct classification of the Bayes classifier for the feature set Zl− = Zl −{Z − }, J(Zl− ), is greater than J(Zl ). The goal at level l is to find which non-selected feature X ∈ (X − (Zl−1 )) yields the greatest improvement in the probability of correct classification for the Bayes classifier among the nonselected features. That is, the feature that yields Jmax =
max
X∈(X −Zl−1 )
Jnrep (Zl−1 + {X}).
(15)
If nrep is a large number, then Jnrep (Zl−1 + {X}) is an accurate estimate of the maximum probability of correct classification one might expect from the Bayes classifier. But the computation is time consuming. If nrep is small, Jnrep (Zl−1 + {X}) is computed faster, but it is not accurate. In the proposed method, the number of crossvalidation repetitions nrep in (15) is predicted by (11) from the first 10 crossvalidation repetitions for the feature set (Zl−1 + {X}) and it is denoted as nrep. d µ(J1000 (Zl−1 + {X})) can be replaced with µ(J10 (Zl−1 + {X})), because the sample mean does not change dramatically by varying the number of crossvalidation repetitions as can be seen in Figure 1. Let us separate the features X ∈ (X − Zl−1 ) in potentially expressive features and potentially bad features. The former features yield Jnrep1 (Zl−1 + {X}) ≥ Jnrep d (Zl−1 ), while the latter ones consistently yield Jnrep2 (Zl−1 + {X}) < Jnrep d (Zl−1 ) where 10 < nrep1, nrep2 < nrep. d We propose to formulate a t-test in order to test the hypothesis H0A : Jnrep2 (Zl−1 + {X}) < Jnrep d (Zl−1 ) at 95% significance level for a small number of repetitions (e.g. nrep2=10). If the hypothesis is accepted, we discard
the feature X. Otherwise, we perform more repetitions checking each time the validity of the hypothesis H0A . If nrep2 has reached nrep d then we perform another t-test to check whether the hypothesis H0B : Jnrep d (Zl−1 + {X}) ≥ Jnrep d 0 (Zl−1 ) can be accepted. If H0B is accepted then the feature X is added to Zl−1 . Figure 3 explains in detail the proposed mechanism to be incorporated in SFS or SFFS algorithms. Initialize Set J max = JnrepA (Zl−1 + {X1 }) where X1 ∈ (X − Zl−1 ), X opt = X1 . nrepA is calculated from (11): nrepA = [2π · g 2 (J10 (Zl−1 + {X1 })) · γ]−1 Loop 1: For all X ∈ (X − Zl−1 − {X1 }), nrepA = [2π · g 2 (J10 (Zl−1 + {X})) · γ]−1 nrep = 10 Loop 2: while nrep ≤ nrepA Test H0A : Jnrep (Zl−1 + X) < J max at 95% significance level. if H0 is accepted, no further crossvalidation repetitions are required so we proceed to the next non-selected feature. go to Loop 1 end if if H0 is rejected then the feature X might improve J. More repetitions are need to validate its usefulness. nrep = nrep + 1 end if end for Loop 2 So, feature X with JnrepA (Zl−1 + {X}) was never rejected for nrepA crossvalidation repetitions, but is it actually better than the best feature found up to now X opt that achieves J max ? max Test H0B : JnrepA (Zl−1 + X) > JnrepB with a two sided t-test at 95% significance level using the test statistic (13). if H0B is accepted then, J max = JnrepA (Zl−1 + {X}) X opt := {X} end if end for Loop 1 X + := X opt // This feature must be included
accuracy comparison, because the former is not sensitive to nesting problems. As can be seen from Table 2 there is no performance deterioration. Table 1. Time lapsed in secs for SFS. Data set SFS SFS with t-test 500 utterances 2547 1231 1300 utterances 2710 1159 Table 2. Probability of correct classification for SFFS. Data set 500 utterances 1300 utterances
SFFS 0.563 0.485
SFFS with t-test 0.558 0.487
7. CONCLUSIONS In this paper, we studied the distribution properties of the probability of correct classification achieved by the Bayes classifier and demonstrated by experiments that it follows a Gaussian distribution. We have proposed a t-test that can be incorporated within the SFFS or SFS algorithms to control the number of crossvalidation repetitions. The proposed SFS variant is twice faster than the SFS algorithm for a fixed number of crossvalidation repetitions. Moreover, the proposed SFFS variant maintains the same accuracy with the SFFS for a fixed number of crossvalidation repetitions. In all the cases, the class pdfs are modeled by a single multivariate Gaussian density. The proposed method can be applied to other sequential forward or backward feature selection algorithms as well. 8. REFERENCES [1] D. Foley, “Consideration of sample and feature size,” Trans. Information Theory, vol. 18, no. 5, pp. 618–626, 1972.
Fig. 3. Algorithm to determine the best feature among the nonselected ones with low computational cost while maintaining high accuracy.
[2] P. A. Lachenbruch and R. M. Mickey, “Estimation of error rates in discriminant analysis,” Technometrics, vol. 10, pp. 1–11, 1968.
6. RESULTS
[3] M. Stone, “Cross-validatory choice and assesment of statistical predictions,” J. Roy. Statist. Soc. B, vol. 36, no. 2, pp. 111–147, 1974.
To demonstrate the usefulness of the proposed method we compare the SFS and SFFS for fixed number of 70 crossvalidation repetitions against our variants of SFS and SFFS with variable number of crossvalidation repetitions up to 70. To evaluate the speed of the proposed method, we compare the execution time needed for our variant of SFS against the execution time needed for the SFS with a fixed number of crossvalidation repetitions. SFS is more suitable for speed evaluation than SFFS, because the former employs a fixed number of forward steps. The results are shown in Table 1. The proposed method is twice faster than the ordinary SFS. In order to determine the accuracy of the proposed method, we compare the probability of correct classification achieved by the Bayes classifier when the ordinary SFFS algorithm with a fixed number of crossvalidation repetitions is employed with that when the proposed variant of SFFS is used. SFFS is preferred than SFS for
[4] B. Efron and R. E. Tibshirani, An Introduction to the Bootstrap., N.Y.: Chapman & HALL/CRC, 1993. [5] I. S. Engberg and A. V. Hansen, Documentation of the Danish Emotional Speech Database,, Internal report, Center for Person Kommunikation, 1996. [6] D. Ververidis and C. Kotropoulos, “Automatic speech classification to five emotional states based on gender information,” in Proc. 2004 European Signal Processing Conf., Sep. 2004, pp. 341–344. [7] P. Pudil, F. J. Ferri, J. Novovicova, and J. Kittler, “Floating search methods for feature selection with nonmonotonic criterion functions,” in Proc. Int. Conf. Pattern Recognition, 1994, vol. 1, pp. 279–283.