470
J . C H E M . SOC., C H E M . C O M M U N . ,
1992
Sequence Dependent Energy Transfer from DNA to a Simple Aromatic Chromophore C. V. Kumar* and Emma H. Asuncion Department of Chemistry, University of Connecticut, Storrs, Connecticut 06269-3060, USA Sequence selective energy transfer f r o m adenine-thymine bases of DNA t o the anthracene chromophore has been observed.
The binding of small molecules to deoxyribonucleic acid (DNA) is useful in deciphering the structure and function of nucleic acids, protein-nucleic acid interactions, drug-DNA interactions and in rational drug design.' Numerous heterocyclic cations, metal complexes and natural antibiotics have been used for D N A binding studies.* We report the D N A binding properties of 9-anthracenemethylamine hydrochloride [AMAC, 1, Fig. l(a)] featuring a large hydrophobic aromatic residue. The anthryl probe, 1, binds t o the D N A double helix with a high affinity for alternating adeninethymine (AT) sequences. Fluorescence sensitization experiments show that excitation into the D N A absorption bands results in energy transfer to the anthryl chromophore with a high selectivity involving A T sequences. No energy transfer was observed with guanine-cytosine (GC) sequences. To our knowledge no such selectivity for energy transfer from the D N A bases to the anthryl chromophore has been observed before. Site specific energy transfer from D N A can be used to photoactivate D N A cleavage at the binding site. Absorption spectra of 1 in the presence of increasing amounts of calf thymus D N A (55% AT content) from 0 to
\ N H ~ + CI1
Fig. 1 ( a ) Structure of AMAC; ( b )intercalative and groove binding of the probe into the D N A helix
370 pmol dm-3 in base pairs, are shown in Fig. 2. At the highest concentration of the DNA, the absorbance at the various peaks decreased by -45% (strong hypochromism) and the vibrational bands were broadened extensively. A small red shift and an isosbestic point at 388 nm can also be observed in the spectra. In these experiments, small volumes of the D N A stock solution (1 mmol dm-3 in DNA base pairs) were added to the probe solution (1 ml, 10 pmol dm-3). Concentration of the probe was kept constant throughout the titration by adding an appropriate amount of the probe to the D N A stock solution. Absorption spectra were recorded from 450 to 300 nm after each addition of the D N A polymer. Strong hypochromism and the small red shift observed in the absorption spectra are consistent with the intercalation model where the chromophore buries itself in the stack of DNA bases. According to this model, a strong interaction of the
300
350
400
450
h/nm Fig. 2 Absorption spectra of 9-anthracenemethylaminc hydrochloride, in the absence (1) and presence (2)-(7)of calf thymus DNA. Concentrations increase from 37 to 370 pmol dm-3.
J . C H F M . SOC., C'HEM. C O M M U N . ,
250
1992
300
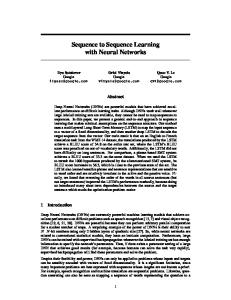
' 350 400 Llnrn Fig. 3 Excitation spectra of 9-anthracenemethylamine hydrochloride (5.0 pmol dm--'), free (1). with poly(dA-dT) (2), with calf thymus DNA ( 3 ) mid with poly(dG-dC) (4)
electronic states of the probe with the electronic states of the DNA bases? causes the observed changes in the absorption spectra. Since the strength of the electronic interaction between the probe and the DNA bases is expected to decrease as the cube of the distance of separation between the chromophore and the D N A bases,"4 observation of strong hypochromism was considered as a definitive indication of intercalation [Fig. l(h)]. Thus, aromatic n-nc' states of the anthryl moiety of 1 seem to interact strongly with the electronic states of the D N A bases, causing the extensive hypochromicity and the red shift i n the absorption spectra.3 Similar changes were not observed when the absorption titrations were conducted with a polyanion such as poly(sodium 4-styrenesulfonate). This indicates that mere electrostatic binding to the polyanion does not result in the observed absorption spectral changes. The hypochromicity accompanying the binding of 1, varies with the sequence of DNA and the observed values are: poly(dA).poly(dT) 17, calf thymus 52, poly(dGdC) 48 and poly(dAdT) 46%. DNA binding affinity of A M A C was further established by iodide quenching experiments. Iodide anion quenches the AMAC fluorescence at near diffusion controlled rate and provides a sensitive method to determine if the probe is indeed bound to the anionic D N A polymer. Binding of A M A C to the helix should protect the fluorophore from quenching by the negatively charged iodide due to the electrostatic field surrounding the helix. High binding constants will result in better protection by the D N A and will inhibit quenching by anionic species. Stern-Volmer quenching plots as described by eqn. (1) were constructed from the quenching data, where I0 and I are the fluorescence intensities in the absence and in the presence of iodide, respectively, K,, is the Stern-Volmer quenching constant and [I-] is the concentration of iodide in mol dm-3.
I(,/I = 1 + K,,[I--] Plots of Z o / l vs. iodide concentration for AMAC with various D N A samples indicated that the data follow eqn. (1) and the K5\ values were estimated from these linear plots.5 The magnitude of K,, should be highest for the free probe and decrease with increasing binding affinity. K,, values for the free probe and poly(dA),poly(dT) are identical (117 dm-?mol-1) indicating a very low binding affinity of AMAC for this homopolymer. K,, values for calf thymus D N A and poly(dG-dC) are 90 and 96 dm3 mol-1, respectively. K,\ was lowest (52 dm3 mol-1) with the heteropolymer poly(dA-dT), indicating highest binding affinity for these sequences. While GC sequences provide less protection from the quencher when compared to alternating A T sequences, homo A T sequences provide no protection and hence little or no binding was detected at these sites. Such strong sequence dependent DNA binding affinity (K5\ values change by more than a factor of two) for a hydrophobic chromophore such as anthryl is very interesting and indicates that binding of 1 to
47 1 D N A is sequence dependent .h High specificites were observed with heterocyclic drugs such as netropsin and Hoechst 33258, due to their specific and strong hydrogen bonding abilities with the helix, in contrast to our studies.7 The binding of 1 to the helix was exploited to study energy transfer from the D N A bases to the anthryl chromophore. Energy transfer was studied by recording the excitation spectra of 1 in the presence of various DNA samples. Fluorescence emission from AMAC was monitored at a constant wavelength (438 nm) and the excitation wavelength was varied from 250 to 420 nm. Fluorescence intensity was plotted as a function of the excitation wavelength. The excitation spectrum of the free probe thus obtained (Fig. 3) should match with its absorption spectrum, as it does, indicating that energy is absorbed and emitted by the same chromophore. If energy is initially absorbed by DNA, transferred to the anthryl chromophore and then the emission occurs from the anthryl moiety, then the excitation spectra should have additional peaks corresponding to the DNA absorption bands. Since DNA absorbs in the 250-280 nm region, distinct peaks should be observed in this region of the excitation spectrum, if energy is transferred from the polymer to the chromophore. The excitation spectra in the 300-400 nm region, where only the anthryl chromophore absorbs (Fig. 3), are very similar to the corresponding absorption spectra. Broadening of the vibrational bands and the red shift were reproduced in the excitation spectra. However, very significant differences were observed in the 250-300 nm region of the excitation spectra when A T containing polymers were used in the experiment. A new band at 285 nm, not present in the absorption spectrum of the free chromophore, was observed in the presence of all A T containing DNA samples. This observation can be explained only if energy is absorbed by D N A in this wavelength range and transferred to that of the anthryl chromophore. The excitation spectra of DNA alone, monitored at 438 nm, show no bands in the 250-300 nm region, consistent with the interpretation that energy is transferred from D N A to the anthryl chromophore and the emission occurs from the anthryl moiety. The sensitized emission was demonstrated to be from the anthryl chromophore by comparing the direct and sensitized spectra. Excitation of a mixture of 1 and calf thymus DNA [ 1 : 40, probe to DNA-phosphates (DNA-P) concentration], at 260 nm (into the DNA absorption bands) results in the emission spectrum with maxima at 411, 428 and 457 nm (shoulder). The direct excitation spectrum (at 388 nm) has maxima at 392, 414 and 436 nm and resembles the 5ensitized spectrum. A small red shift (-19 nm) and broadening of the vibrational bands was observed with the sensitized emission and it indicates that excitation at 260 nm leads to fluorescence from the bound chromophore. The differences in the two spectra are consistent with changes observed in the absorption spectra of 1 when the chromophore binds to DNA and establish that the bound and free probes are spectroscopically distinguishable. Sensitization is very efficient if the chromophore is bound to the helix. Energy transfer from the DNA bases to the anthryl chromophore depends upon the DNA sequence as evident from the relative intensities of the 285 nm band in the excitation spectra (Fig. 3). All the spectra were recorded at a concentration ratio 1 : 40 of AMAC to DNA-P. The intensity of the 285 nm band increases with increasing A T content. The heteropolymer poly(dA-dT) is more efficient in sensitization than the homopolymer poly(dA).poly(dT). While sensitization was observed with calf thymus D N A ( 5 8 % AT content), no sensitization was observed with poly(dG-dC). These observations clearly indicate that A T sequences can transfer energy efficiently to the anthryl chromophore, whereas the G C sequences do not! The absence of energy transfer from GC sequences firmly establishes the sequence specificity of the energy transfer process.
472 Sequence dependence of energy transfer could be due to several reasons. The overall binding constant is the highest for alternating A T sequences. This alone cannot account for the strong sequence dependence because GC sequences bind 1 but do not sensitize the emission. Binding mode can also play a very important role in the energy transfer process by altering the proximity and orientation of the chromophore with respect to the D N A bases. Intercalative and surface binding modes differ substantially in this respect [Fig. l(b)]. The nonpolar anthryl chromophore may prefer intercalation into the less polar AT sequences when compared to the more polar GC sites.8 Intercalation may provide a better environment for the energy transfer when compared to the groove or electrostatic binding to the helix. High specificity associated with the energy transfer, observed in the current studies, indicates that planar aromatics such as anthracene can be exploited for site specific photoactivation of small molecules t o induce photochemical D N A cleavage.
Received, 3rd December 1991; Corn. 1l06126G
J . C H E M . SOC., C H E M . C O M M U N . ,
1992
References C . V. Kumar, A . L. Raphael and J. K. Barton, J. Riomol. Striict. Dyn., 1986, 3, 85; P. B. Dervan, Riotechnology a d Material5 Science: Chemiytry for the Future, ed. M. L. Good. ACS. Washington, D . C . , 1988, p. 21. J . K . Barton, J. Biomol. Strucf. Dyn., 1983, 1, 621; C. V. Kumar. J . K. Barton and N . J . Turro, J . A m . Chem. SOC.. 1985. 107,5518: J . K . Barton, Chem. Eng News, 1988, 66. 30: J. K . Barton. Comment5 Inorg. Chem. , 1985, 3, 321. C. Cantor and P. R . Schimmel, Biophysical Chemiptry, W. H. Freeman, San Francisco, 1980, vol. 2, p. 398. J . K. Barton, Commenrs Znorg. Chern.. 1985, 3. 321; C . L. Duveneck, C . V. Kumar, N. J. Turro and J . K. Barton, .I. P h y ~ . Chem., 1988, 92, 8020; N. J. Turro, Modern Moleculur- Photochemistry. Benjamin-Cummings: Menlo Park. 1978. G. L. Duveneck, C. V. Kumar, N. J. Turro and J. K. Barton. J . Phys Chem., 1988, 92, 8020. L. S. Lerman, Proc. Nut/. Acad. Sci. U S A . 1963, 49, 94; L. S. Lerman, J . Mol. Biol., 1964, 10,367; L. S. Lerman. J. Cell. Comp. Plzysiol., 1964,64, 1 ; C. C. Tsai,. S. C. Jain and H. M. Sobell, Proc. Nutl. Acad. Sci. U S A , 1975, 72, 628; C. C. Tsai, S. C. Jain and H. M. Sobell, J . Mol. Biol., 1977, 114, 301. M. K . Teng, C. A . Fredrick, N. Usmann and A . H. Wang, Nucleic Acids Res., 1988, 16, 2671. W. Muller and D. M. Crothers, Eur. J . Biochern., 1975, 54, 267.