GEOPHYSICAL RESEARCH LETTERS, VOL. 32, L10501, doi:10.1029/2005GL023039, 2005
Separation of melting and environmental signals in an ice core with seasonal melt John C. Moore,1 Aslak Grinsted,1,2 Teija Kekonen,1,3 and Veijo Pohjola4 Received 1 March 2005; revised 21 March 2005; accepted 21 April 2005; published 19 May 2005.
[1] We examine the impact of melt water percolation on the soluble ion chemical record from the Lomonosovfonna ice core. Principle component analysis shows that melting produces only simple changes between bubbly and clear ice facies, due to elution of ions. The data can be naturally split into four groups: pre-industrial, immediately before, and after the end of the Little Ice Age, and anthropogenic impact eras. The 2nd, 3rd and 4th principle components for these periods all differ significantly, reflecting complex changes in environmental conditions. Thus the core preserves a rich record of environmental history, and simple one of melting. We construct a model of percolation effects to reconstruct ‘‘pristine’’ ice chemical composition, finding that even with melt percentages as high as 80%, there is little disturbance to the chemical stratigraphy. This suggests that ionic records from Arctic ice cap cores are nearly as reliable as those from Greenland or Antarctica. Citation: Moore, J. C., A. Grinsted, T. Kekonen, and V. Pohjola (2005), Separation of melting and environmental signals in an ice core with seasonal melt, Geophys. Res. Lett., 32, L10501, doi:10.1029/2005GL023039.
1. Introduction [2] Chemical records from ice cores that suffer seasonal melting have a reputation of being poor sources of information for paleoclimate reconstructions, [Koerner, 1997]. However, advances in both analytical and mathematical techniques suggests that certain ice cores preserve reliable records, that can be extracted with confidence, at least on decadal scales [Goto-Azuma et al., 2002; Kekonen et al., 2005; Pohjola et al., 2002a] – but doubts remain in their interpretation at higher resolution. The small ice caps of the Arctic mostly contain only Holocene ice and typically records span a millennia or so [Koerner, 1997]. However, they are situated relatively close to large sources of anthropogenic pollution than the large ice sheet interiors. When melting occurs most ions are easily removed from the ice [Davies et al., 1982] and carried downward by percolating meltwater. When the underlying layers are saturated runoff occurs and ions are lost. In this paper we seek to examine the changes in the ice core chemical record caused by periodic melting, with the aim of quantifying the reliability of the ion record as an indicator of regional climate and environmental conditions.
1
Arctic Centre, University of Lapland, Rovaniemi, Finland. Department of Geophysics, University of Oulu, Oulu, Finland. Department of Chemistry, University of Oulu, Oulu, Finland. 4 Department of Earth Sciences, Uppsala University, Uppsala, Sweden. 2 3
Copyright 2005 by the American Geophysical Union. 0094-8276/05/2005GL023039$05.00
2. Data [3] In 1997 we drilled a 121 m long ice core (spanning about the 800 years) on Lomonosovfonna, the highest ice field in Svalbard (78� 510 5300N, 17� 250 3000E, 1255 m a.s.l.). Total ice depth from radar sounding was 123 m, and the site is close to the highest point of the ice cap with roughly radial ice flow. The dating of the core was based on a layer thinning model tied with the known dates of prominent reference horizons, (see Kekonen et al. [2005] for details). Dating reliability is estimated to be about 3-5 years over the last 300 years by comparison of the model timescale with independent annual cycle counting, [Pohjola et al., 2002b]. The accumulation rate for the second half of the 20th century was 0.41 m water equivalent per year (mwe. a�1) with a somewhat lower value of 0.31 mwe. a�1 in the 18th and 19th centuries. The current annual temperature range is from 0 �C to about �40�C, and temperatures within the firn pack approach �3�C at 15 m depth [van de Wal et al., 2002]. Extensive shallow coring and snow pits indicate that any summer melt water is refrozen mostly within the previous winter’s snow, and the remainder within the next two or three lower annual layers [Samuelson, 2001], though runoff and loss of ions may now occur [Virkkunen, 2004]. Although percolation can be up to 8 years in the warmest years in the 20th century, it was probably much reduced during the Little Ice Age [Kekonen et al., 2005]. Melt percentages are typically between 30 to 50% (Figure 1), but higher in some periods.
3. Methods [ 4 ] Sample recovery and analysis is discussed by Kekonen et al. [2005, and references therein]. A sample 5 cm in length taken every 10 cm down the core and analyzed by ion chromatography. The ion species concentration probability density functions are log normal [Kekonen et al., 2004], so a log transformation was applied to all species and the series then standardized to zero mean and unit variance before Principal Component Analysis (PCA). [5] The 5 cm sampling interval spans 1/8 of a year near the surface, but a whole year at 90 m depth. Therefore, the ion profiles become smoother with depth. To limit these problems and make use of available stratigraphic analysis, we restrict our analyses in this paper to the data above 80 m depth (Figure 1). [6] We want to explore how relationships between different ion species reflect changes in atmospheric transport and climate over time and we do this using PCA. Changes over time can be seen in the ion profiles (Figure 1), that are correlated with instrumental records and physical changes in Svalbard [Isaksson et al., 2003]. The end of the
L10501
1 of 4
L10501
MOORE ET AL.: MELTING AND IONIC SIGNALS IN AN ICE CORE
L10501
with high porosity that was fully wetted by infiltrating water. The bubbly layers probably correspond to spring and summer snow, and the clear ice layers to autumn and winter snow, being more likely to contain low density depth hoar layers above an impermeable ice layer from late summer.
4. Post-Depositional Versus Ion Source Effects
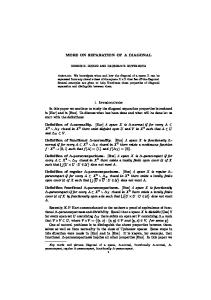
Figure 1. 5 cm resolution ionic concentrations (in mgL�1) for the upper 80 m of core, where there are stratigraphic melt indices (SMI, %), 30 year running means of d18O [Isaksson et al., 2003] and model years (AD), (dotted lines) are also shown.
Little Ice Age (LIA) occurred about 1920 on Svalbard when there was a significant retreat of the sea ice edge in the Western Barents Sea [Vinje, 2001], the largest jump in temperatures in the Longyearbyen temperature record [Nordli et al., 1996], and the time of maximum extent of Svalbard glaciers [Svendsen and Mangerud, 1997]. Kekonen et al. [2005] discuss the ion records in detail, examples of features seen include the approximate halving in concentrations of methane sulfonate (MSA) around the end of the LIA, and increases in concentrations of NO� 3 and due to anthropogenic pollution in the 20th century. SO2� 4 We can present the data in four subsets spanning different periods, with approximately the same number of samples in each period: Period I, 1705 – 1850, which is in the middle of the LIA, and is also clearly before any anthropogenic pollution is detectable in the ice core, so can be called pre-industrial; period II, 1866– 1920, immediately before the end of the LIA and period III, 1920 – 1972, immediately after the end of the LIA; period IV, 1950 – 1997, which is dominated by anthropogenic input. [7] Association between ionic species in the ice core maybe due to two different processes: co-variation of ions in the precipitation, or post-depositional movement and preferential relocation of ions in different ice faces. The whole ice core above 80 m depth, corresponding to a date of 1705 was visually divided into various ice facies at the cm-scale (Figure 1), using the methods of Pohjola et al. [2002a]. The two main units being bubbly ice derived from firn in the usual firnification way with little or no melt water infiltration, and clear ice formed as a result of a firn layer
[8] We did PCA for each of the time periods (I – IV), each involving 9 variables representing the standardized concentrations of each log ion concentration. The first component (PC1) accounts for most of the variation in the data set (�60%). The second component (PC2) accounts for �10– 15%, PC3 and 4 contribute about 8% each and the others less than 5% each. The first 4 PCs account for about 85% of the variance, and the top 8 PCs are all highly significant against red noise models, consistent with the 5% errors in our chemical analyses and small scale variability across the core [Kekonen et al., 2004]. The first component is loaded by all ions except ammonium in all time periods. This suggests that most of the major ions have a common source and/or co-location in the ice core due to postdepositional movement. Figure 2 shows that PC1 is the only one to show significant differences between ice facies. This is most easily explained by the difference in mean concentrations between clear and bubbly ice, as a result of elution from the bubbly ice to the clear ice facies, and perhaps seasonal differences in initial ion load. In contrast, there are significant distinctions between groups of data ordered by time period in PCs 2, 3 and 4. This indicates that changes in relations between ions are affected by climate in a complex and interesting way. Therefore it is clear that post
Figure 2. Box plot of PC 1– 4, of the standardized log ionic composition for bubbly ice, clear ice facies (divided at a melt index of 50%), and for the time periods I– IV. The median value is the horizontal line in the middle of the box, the notches mark 95% robust confidence limits on the median, the box limits are upper and lower quartiles and the whiskers show the data extent. The only differences between the two ice facies are in PC1 indicating a difference in mean concentrations. There are significant differences between the periods I – IV in PC2-4.
2 of 4
L10501
MOORE ET AL.: MELTING AND IONIC SIGNALS IN AN ICE CORE
Figure 3. (a) The eigenvectors of PC2 and 3 for period I (1705 – 1850, 298 samples, x) and period IV (1950 – 97, 160 samples, o). (b) The eigenvectors of PC2 and 4 for period II (1866 – 1920, 164 samples, x) and period III (1920 – 72, 161 samples, o). See color version of this figure in the HTML. depositional effects do not destroy information on changes in precipitation chemistry for this ice core. [9] To illustrate some of these differences we plot the eigenvectors of PC2 against those for PC3 for period I and IV, and PC2 against PC4 for periods II and II in Figure 3. We select this particular combination because it highlights some relatively easily explainable changes in ion association. Other PC combinations also reveal interesting relationships that space limitation prevents discussion of here. The simplest way to read Figure 3 is to note how closely ions are grouped in a particular period, with how their grouping and relative separations change in the following period. This then indicates that something different has happened to the sources or transport factors that bring the ion species to the ice cap. Different PCs capture different, independent aspects of source and transport variability. Most obviously, NH+4 is positioned away from the other ions, this indicates a quite different source or post-depositional process for this ion than the others, which is likely due to it being easily incorporated within the ice lattice, and its high solid-phase mobility within the ice lattice. Figure 3a shows that Na+ and Cl� are clearly from the same oceanic source but in period IV they are more separated, probably due to an additional 2� Cl� source or volatilization of HCl. NO� 3 and SO4 , are closer associated with each other in period IV than in period I, likely by association with anthropogenic pollution during Period IV. [10] Figure 3b illustrates how PC4 captures the dramatic changes in SO2� 4 and MSA that occurred at the end of the LIA. The pair are located much closer in period III than in period II, probably because of a stronger local source of marine biogenic H2SO4 and MSA (and change in their branching ratio from dimethyl sulfate) from increased production in warmer post LIA Barents Sea [Isaksson et al., 2005].
5. Reconstruction of Chemical Profiles [11] Having established that percolation effects do not destroy chemical signals in this core, we propose a simple
L10501
model to assess their impact. In the warmest years (such as post 1990), percolation lengths appear to be up to 8 annual layers. The analysis in Figure 2 shows that facies type is only reflected in PC1, suggesting that a simple linear model of percolation with just a single parameter in combination with melt will be sufficient. A physically plausible representation of this is use the elution rate found for each species (Table 1) multiplied by the SMI, envisaging a mechanism whereby melt infiltrates the layer beneath in a exponentially decaying fashion. We define elution rate, e = 1 � exp ((ln Cb � ln Cs )), where Cb and Cs are the concentrations of a species in bubbly ice (melt < 30%) and clear ice (melt > 70%). The limited re-distribution of ions acts a low-pass filter on the concentration data enhancing ion autocorrelation functions. We want to produce a record that is rather more like the original atmospheric composition than we now have measured in the postdepositionally altered ice layers, effectively deconvoluting the signal with a filter representing post depositional effects. We do this assuming that the measured concentration Ci in each annual layer i, is a result of some loss of ions to the i + jth layer below, so that a smooth approximation to the ionic concentration D i+j for a particular species in the original precipitation may be given as: Ci ¼ ð1 � mÞ
1 X
mij Diþj :
j¼0
However this is not possible to solve for variable mi. So we use a local inverse filter to extract the Di = (1 + x)Ci � xCi�1 where x = (m�1 � 1)�1 and mi is the product of the elution i factor for each species (Table 1) and the local SMI taken from the detailed stratigraphic analyses of the ice core. The model uses variable melt index, but it is held constant within each short (8 year) convolution window. The local distribution of melt layers changes over short horizontal distances [Samuelson, 2001] even though the upper parts of the firn pack must be isothermal in summer, and experience the same climate conditions. Thus the model allows melt index to change over a 8 year window, but not for each thin
Figure 4. Measured SO2� concentration data (mgL�1, 4 dashed curve) re-sampled and plotted on a linear time scale, and reconstructed deposited signal (solid line), using with the elution factor the percolation model for SO2� 4 (Table 1) and the SMI. The large peak is the 1783 Laki volcanic event.
3 of 4
MOORE ET AL.: MELTING AND IONIC SIGNALS IN AN ICE CORE
L10501
Table 1. Elution Factors for Ion Species Ion
�
Cl
NO� 3
SO2� 4
e
0.31
0.47
0.43
+
MSA
NH+4
K
0.36
0.28
0.35
2+
2+
Ca
Mg
0.37
0.27
+
Na
0.28
melt layer. Figure 4 shows an example of the deconvoluted ion profile, and even for a heavily eluted ion such as SO2� 4 there is very little difference between the measured concentration profile and the recovered signal, even when melt ratios approached 80%, and the exponential nature of the percolation model tends to quickly damp out effects below only a few annual layers. Although we could then do a PCA on the deconvoluted ions, the deconvolution process tends to magnify measurement errors, and as the profiles themselves appear relatively unchanged by the process, we prefer to trust the PCA in Figure 3 on the raw data.
6. Conclusions [12] Despite a melt percentage of 30 to as much as 80% in an ice core, redistribution by melt water percolation plays a relatively minor role in the ice core stratigraphic record compared with climate variability. Clearly if melt ratios exceed 100% runoff occurs and some ions are not simply redistributed, but lost from the record. Dividing the core into sections based on the two largest changes visible in the ionic profiles: the sudden termination of the LIA, and the anthropogenic changes in the 20th century and performing PCA on each section brings out the nature of relationships between ions. This is a combination of both atmospheric transport of species, and limited post-depositional re-location of ions in the snow-pack and firn column. A simple percolation model shows that the redistribution of ions within the core does create a diffusion-like effect, smoothing the record and blurring the temporal resolution. This blurring, however introduces inaccuracies only about the same as the error in the dating model based on layer thinning between marker horizons. Percolation through sub-vertical pipes transferring material through several annual layers must sometimes occur, but Figure 3 shows that subtle variations in ion relationships remain, suggesting that the core stratigraphy is not very disturbed. Goto-Azuma et al. [2002] performed an analysis of variability between two core 2.5 m apart on Penny Ice Cap, Canada and concluded that low correlations at high resolution meant that about 50% of the ionic variability is simply noise. However, all cores, even those from dry snow zones, contain accurate (to within measurement errors) records only of what has happened at that site. Although no location can capture the full variability of climate on regional scales, the whole record at any site contains additional regionalscale information when site-specific effects are deconvoluted. This implies that for many Arctic ice cores, despite percolation and ‘‘worryingly’’ high melt ratios, much of ion
L10501
chemical stratigraphy is retained and we argue these records are almost as reliable as those from dry snow sites. [13] Acknowledgments. The Finnish Forest Research Institute Research Station, Rovaniemi provided cold and clean room facilities. The drilling of the Lomonosovfonna 1997 ice core was financed by the Norwegian Polar Institute and IMAU, Utrecht University. The Finnish Academy, Thule Institute, NARP (Nordic Arctic Research Programme) and Stiftelsen Ymer-80, Swedish Science Council financed the ice core and mathematical analysis. We also thank the field participants, and 2 anonymous reviewers.
References Davies, T. D., C. E. Vincent, and P. Brimblecombe (1982), Preferential elution of strong acids from a Norwegian ice cap, Nature, 300, 161 – 163. Goto-Azuma, K., R. M. Koerner, and D. A. Fisher (2002), An ice-core record over the last two centuries from Penny Ice Cap, Baffin Island, Canada, Ann. Glaciol., 35, 29 – 35. Isaksson, E., et al. (2003), Ice cores from Svalbard: Useful archives of past climate and pollution history, Phys. Chem. Earth, 28, 1217 – 1228. Isaksson, E., T. Kekonen, J. C. Moore, and R. Mulvaney (2005), The methanesulphonic acid (MSA) record in a Svalbard ice core, Ann. Glaciol., in press. Kekonen, T., P. Pera¨ma¨ki, and J. C. Moore (2004), Comparison of analytical results for chloride, sulfate and nitrate obtained from adjacent ice core samples by two ion chromatographic methods, J. Environ. Mon., 6, 147 – 152, doi:10.1039/B306621E. Kekonen, T., J. Moore, P. Pera¨ma¨ki, R. Mulvaney, E. Isaksson, V. Pohjola, and R. S. W. van de Wal (2005), The 800 year long ion record from the Lomonosovfonna (Svalbard) ice core, J. Geophys. Res., 110, D07304, doi:10.1029/2004JD005223. Koerner, R. M. (1997), Some comments on climatic reconstructions from ice cores drilled in areas of high melt, J. Glaciol., 43(143), 90 – 97. Nordli, P. Ø., I. Hanssen-Bauer, and E. J. Førland (1996), Homogeneity analyses of temperature and precipitation series from Svalbard and Jan Mayen, Rep. 16/96 KLIMA, 41 pp., Norw. Meteorol. Inst., Oslo. Pohjola, V. A., J. C. Moore, E. Isaksson, T. Jauhiainen, R. S. W. van de Wal, T. Martma, H. A. J. Meijer, and R. Vaikma¨e (2002a), Effect of periodic melting on geochemical and isotopic signals in an ice core from Lomonosovfonna, Svalbard, J. Geophys. Res., 107(D4), 4036, doi:10.1029/2000JD000149. Pohjola, V. A., T. Martma, H. A. J. Meijer, J. C. Moore, E. Isaksson, R. Vaikma¨e, and R. S. W. van de Wal (2002b), Reconstruction of 300 years annual accumulation rates based on the record of stable isotopes of water from Lomonosovfonna, Svalbard, Ann. Glaciol., 35, 57 – 62. Samuelson, H. (2001), Distribution of melt layers on the ice field Lomonosovfonna, Spitzbergen, M.S. thesis, 31 pp., Dep. of Earth Sci., Uppsala Univ., Uppsala, Sweden. Svendsen, J. I., and J. Mangerud (1997), Holocene glacial and climatic variations on Spitsbergen, Svalbard, Holocene, 7, 45 – 57. van de Wal, R. S. W., R. Mulvaney, E. Isaksson, J. C. Moore, J.-F. Pinglot, V. Pohjola, and M. P. A. Thomassen (2002), Reconstruction of the historical temperature trend from measurements in a medium-length bore hole on the Lonomosovfonna Plateau, Svalbard, Ann. Glaciol., 35, 371 – 378. Vinje, T. (2001), Anomalies and trends of sea ice extent and atmospheric circulation in the Nordic Seas during the period 1864 – 1998, J. Clim., 14(2), 255 – 267. Virkkunen, K. (2004), Snowpit studies in 2001 – 2002 in Lomonosovfonna, Svalbard, M.S. thesis, Dep. of Chem., Oulu Univ., Oulu, Finland. ����������������������
A. Grinsted, T. Kekonen, and J. C. Moore, Arctic Centre, University of Lapland, Box 122, FIN-96106 Rovaniemi, Finland. (john.moore@ ulapland.fi) V. Pohjola, Department of Earth Sciences, Uppsala University, Villavagen 16, Uppsala SE-75236, Sweden.
4 of 4