SEMI-AUTOMATED EXTRACTION AND VALIDATION OF CHANNEL MORPHOLOGY FROM LIDAR AND IFSAR TERRAIN DATA Scott N. Miller, Assistant Professor Sudhir Raj Shrestha, Research Assistant Department of Renewable Resources University of Wyoming 1000 E. University Avenue Laramie, WY 82071
[email protected] [email protected] Darius Semmens, Senior Research Specialist USDA ARS Southwest Watershed Research Center 2000 E. Allen Rd. Tucson, AZ 85719
[email protected]
ABSTRACT Channel morphology characteristics play a crucial role in the understanding and interpretation of a region’s geomorphic and hydrologic processes and are important inputs to physically-based distributed runoff and erosion models. Conventional survey techniques for determining channel width, depth and cross-section area are time consuming and may not adequately represent the spatial variability inherent in the system. This paper presents a semi-automated method for extracting average channel morphology characteristics on a channelreach basis from a high resolution digital elevation model (DEM). Light Detection and Ranging (LIDAR) and Interferometric Synthetic Aperture Radar (IFSAR) data were used to build two high resolution models (1m and 2.5m respectively) for the 150 km2 USDA-ARS Walnut Gulch Experimental Watershed. Results from both the LIDAR and IFSAR data were highly correlated with field observations, although the LIDAR data performed significantly better in terms of the ability to determine channel depth. These results illustrate the benefits of using high resolution data in hydrologic and geomorphic study, and show promise towards the development of a fully automated system for extracting channel morphology from surface terrain models.
INTRODUCTION This paper presents the preliminary results of an investigation into semi-automated extraction of channel morphologic properties from high resolution digital elevation models (DEMs) created from Light Detection and Ranging (LIDAR) and Interferometric Synthetic Aperture Radar (IFSAR). An approach was developed in a geographic information system (GIS) to extract cross-section profiles on a stream system derived from the topographic models. Simultaneous to the acquisition of LIDAR data a field campaign was undertaken to evaluate the accuracy of the LIDAR DEM; a total station was used to evaluate cross sections at 22 sites within the study area. Manual interpretation was required to identify the bank location from the profiles extracted from the GIS, after which average channel morphologic properties of width, depth and cross-section area were determined. The primary objective of this project was to evaluate the accuracy of the LIDAR and IFSAR data in estimating channel morphology. A GIS-based alternative to conventional field surveys for the estimation of channel morphology is presented. Two high resolution digital elevation models were acquired by technicians from the University of Florida using low-flying aircraft using Light Detection and Ranging (LIDAR) to capture returns at approximately a one meter spatial resolution. Another high resolution DEM was constructed using Interferometric Synthetic Aperture Radar (IFSAR) collected at a 2.5 m spatial resolution. The IFSAR data was collected using low-flying aircraft in 1999 by Intermap under a NASA data buy program. A field campaign was undertaken commensurate with the LIDAR data acquisition in June, 20003. Field surveys of the crosssection points of channel were taken using a Sokkia total station, and their end points georeferenced using a commercial grade GPS. Channel profiles were extracted from both DEMs at the same location and compared to
ASPRS Annual Conference Proceedings May 23-28, 2004. Denver Colorado
the field observations for validation. It was hypothesized that the estimation of channel width would be relatively close to the observed values, while the estimation of depth would be less reliable, and that LIDAR would prove to be a superior technology relative to IFSAR, especially in areas of dense vegetation and narrow or steep-walled channels. This approach is intended to provide a basis for a fully automated GIS-based technique for generating spatially distributed estimates of channel width and depth for support of hydrologic and geomorphic modeling. The accurate estimation of channel morphology is a critical element in many hydrologic and geomorphic investigations (Miller, 2003). Detachment and transport of sediment within a stream channel is a function of the energy associated with water moving through the channel and any modifications to the channel width may change the prediction. Similarly, the geomorphic studies that try to determine the short and long term fluxes in sediment and potential for bank failure by alteration in channel planform, requires inputs related to channel width and depth. Process-based hydrologic models that simulate the various components of processes controlling run-off, such as transmission losses, may require that the channel width and depth be known in order to accurately simulate runoff. For example, the Kinematic Runoff and Erosion Model (KINEROS; Smith et al., 1995) requires that the channel width, depth, and side slopes be known. As reported by Miller (2003), KINEROS is sensitive to these parameters, and even moderate errors in the estimation of channel shape will propagate through the simulation process. The impact of channel width on runoff and sediment yield in KINEROS illustrated in the table 1. Table 1: Sensitivity of KINEROS to channel width. Channel width is systematically changed using a multiplier that represents over- and under-estimation error. Results are given in percent change of surface runoff. Multiplier of channel width 0.7
0.8
0.9
1
1.1
1.2
1.3
Runoff
12.76
8.41
4.07
0.00
-3.85
-7.31
-10.52
Sediment yield
3.88
2.60
1.30
0.00
-1.30
-2.38
-3.37
Peak Runoff
11.90
8.13
4.12
0.00
-4.12
-8.01
-11.97
Transmission Losses
-10.82
-7.13
-3.46
0.00
3.19
6.06
8.70
The scientific literature of surface water hydrology has clearly demonstrated the importance of accurately representing channel shape properties. Hydraulic relationships between channel morphology and runoff were first explored by Leopold and Maddock (1953) in which exponential equations were developed that explained the influence of channel morphologic properties on runoff. Channel geometry has been used for indirectly estimating stream flow. Hedman and Osterkamp (1982) focused on the relationship between stream flow and channel width and reported relationships between stream flow and channel width for areas of similar climates within the Western United States due to variability in recording and the possibility of measurement errors in channel depth determination. Osterkamp et al (1983) further explored the relationships governing stream flow and channel geometry and derived the exponents for the width, depth, and velocity factors as used in hydraulic geometry by taking into account the shear stress distribution within the channel. Miller et al (1996) have reported that some researchers have found the variable of width and depth to display a large variance, whereas the cross-sectional area displays a strong relationship to flow distance. LIDAR is an active remote sensing technology used on a satellite or airborne platform. By the use of laser light for reflection, high precision kinematic DGPS (differential global positioning systems) for position information, and an IMU (intertial measuring unit, also know as inertial navigation system, INS) for altitude calculations, this system can collect high density, highly accurate topographic and bathymetric data. Digital products delivered to the end user include a grid or irregular network of XYZ data points with maximum vertical accuracy on the order of 15 cm and horizontal spacing on the order of 1m, but under some circumstances as fine as 30-60 cm. This technology holds the promise of producing fine resolution digital elevation model (DEM) for use in soil survey, subaqueous soil survey, and other related pedologic and geomorphological work (Rubinstein et al, 2004). Large areas can be covered quickly and the active LIDAR signal yields multiple returns from each individual pulse, allowing the use of filtering algorithms that can strip away vegetation and buildings to reveal the underlying surface with extraordinary detail (Miller, 2003); we can
ASPRS Annual Conference Proceedings May 23-28, 2004. Denver Colorado
reasonably get the elevation value at that point which represents the point ground elevation (Harding, 2000). Bowen (2002) used LIDAR for the measurement of river corridor topography and found that it provides better data density and accuracy than other survey technologies. Jarnagin (2004) have used LIDAR to monitor stream morphology due to urbanization. IFSAR is an active remote sensing technology used on satellite or aircrafts. It combines complex images recorded by antennas at different locations or at different times. It is an alternative to conventional stereo photographic techniques for generating high resolution topographic maps. Single pass interferometric system can be implemented in aircraft where two antennas are mounted at the same along-track- position but displaced such that, seen from the target, one antenna is mounted above the other (Madsen, 1998). Synthetic Aperture Radar (SAR) has been widely used in the sector of topographic measurements. For example, Gabriel (1989) has used SAR in the mapping of elevation changes over large areas, and Mrstik (1996) used it in terrain height measurement. Sties (2000) performed a comparison of DEM data from SAR and IFSAR and found that both elevation datasets are in good agreement for bare soil or areas of low vegetation coverage and larger elevation differences were found in the area with substantial vegetation coverage and settlement areas. Significant advances in hydrologic model development have been made with respect to developing linkages between geospatial data and the parameterization of geomorphic and hydrologic models using geographic information systems, or GIS (Arnold et al., 1994; Miller et al., 2002). In general, these GIS-based linkages depend heavily upon users for the estimation of channel morphologic and hydraulic properties; several do not attempt to utilize channel morphology in the simulation of runoff and avoid the difficulties associated with acquiring intensive field-based data. For this investigation, a field campaign was undertaken in which channel cross-sections was surveyed using a Sokkia total station, a sophisticated and highly accurate system suitable for accuracy assessment. It has been reported (Miller, 2003; Gordon et al, 1992) that such field techniques are relatively robust, although a degree of subjectivity and error are embedded in the estimation of bank height and location of break points along a given profile. Ephemeral streams are relatively easy to survey when dry, but the nature of runoff in such areas often leads to uneven or indistinct channel forms. Perennial streams may provide a more stable and uniform profile, but are challenging to survey as the surveyor must navigate through inundated areas. The main drawback of field investigation of channel morphology is that it is time consuming and costly in terms of manpower and equipment.
DESCRIPTION OF THE STUDY AREA The USDA-Agricultural Research Service Southwest Watershed Research Center administers the Walnut Gulch Experimental Watershed (Figure 1). Located in southeastern Arizona, Walnut Gulch encompasses the city of Tombstone and contributes runoff to the San Pedro River. Approximately 148 km2 in size, the watershed is
Figure 1: Location of the study area, Walnut Gulch, in SE Arizona. Courtesy: USDA.
ASPRS Annual Conference Proceedings May 23-28, 2004. Denver Colorado
located on the pediment between the Dragoon mountains and the San Pedro River. Climate in this region is semi-arid, with the majority of the rainfall occurring during summer monsoon rainfall, primarily as a result of high-intensity localized convective events. The average annual precipitation is 32 cm, 60-70% of which falls in summer monsoon rainstorms (Renard et al., 1993). Walnut Gulch is within the transition zone between Chihuahuan and Sonoran deserts. Vegetation is a mixture of grasslands (in the upper, eastern portion of the watershed) and shrub-steppe (dominant in the lower, western section). Soils in the watershed are primarily sandy loams, and the stream beds are a mixture of sands and gravels with high infiltration capacities. The terrain is primarily composed of rolling topography with a dendritic stream network. The elevation ranges from 1190m to 2150m. High resolution topographic maps for the watershed were constructed for this project (Figures 2 and 3). In some areas relatively shallow depth to bedrock and small-scale faulting exert geologic control over the channel pattern and morphology. A majority of the watershed overlies deep alluvial outwash from the Dragoon mountains. However, igneous and exposed sedimentary rocks form the Tombstone Hills and form much of the southern boundary of the watershed. Surface soil textures are typically very gravelly sandy loams and loamy sands, which together comprise over 60 % of the surface. The remainders are gravelly sandy loams to clay loams.
Figure 2: LIDAR DEM of 1m resolution
Figure 3: IFSAR DEM of 2.5m resolution
METHODS A semi-automated methodology was used to estimate the channel morphologic properties from a high resolution LIDAR and IFSAR DEM. The general approach used in this research is presented as Figure 4. The IFSAR and LIDAR model were built by using data collected from missions flown in September 2000 and June 2003 respectively. LIDAR returns and Radar backscatter were acquired using low-flying aircraft and a terrain model was generated with a 1m and 2.5m resolution. Since no averaging or smoothing was performed on the raw DEM, occasional errors in elevation are present, including some gaps in the surface models. At a larger scale, the cumulative errors may cause problems for continuity in the terrain surface and make hydrologic modeling difficult, but at the cross-section scale these data are appropriate, since spurious elevation may be readily identified and excluded from the analysis. Cross-section profile locations from the field observations were input into a GIS. These cross-sections were located by using georeferenced monument points from the field campaign. The sections were taken perpendicular to the monuments which are located at the edges of the bank. In the current effort, these section locations were transformed into linear (arc) features using ArcInfo. High resolution (0.5m) digital orthophotographs were input as grid features into the GIS and served as background imagery to ensure the correct placement of the profiles. A series of Arc Macro Language (AML; ESRI, 1998) were written to automate the extraction of cross-section profiles from the GIS into a spreadsheet-ready format.
ASPRS Annual Conference Proceedings May 23-28, 2004. Denver Colorado
Field data were collected with notation as to the field estimates for bank and channel locations. Monuments were fixed in concrete in order to mark the end points of the cross sections for future study. To prevent loss of the monuments to future erosion events, these monuments were placed well above the estimated channel bank. Thus, the surveyed cross sections extend well beyond the actual channel boundaries. A line coverage was built in ArcMap (ESRI, 2004) in which an ard was drawn for each cross section surveyed in the field campaign that extended through the locations of the monuments. Each of these arcs was intersected with the LIDAR and IFSAR DEMs, after which user intervention was required to identify bank tops. A spreadsheet operation was used to determine the channel width, depth, and cross-section area after the user identified the channel banks. Build high resolution DEM
Locate field sites for total station cross section evaluation
Extract elevation data at 0.5m interval for the profile [Programmed in AML for ArcInfo]
Visually identify break points for channel tops
Extract cross-section data from profile [Programmed in AML for ArcInfo]
Average channel width, depth, area
Figure 4: Methodology for extracting channel dimensions using GIS technique The programs determined elevation at 0.5m intervals along the profiles from both the DEMs. In this way, a three-dimensional representation of the profiles was built. Figure 4 shows the generalized approach used to create the cross-sections. A long-term goal of this ongoing research is to automate the determination of the channel banks for the purpose of isolating the exact channel width and depth and input into the soil heuristic modeling. However, in this effort an interactive approach was taken to demonstrate the feasibility of using DEM data for channel morphologic investigations. Data exported from the GIS were imported into a spreadsheet and used to create cross-section profile in graphical format. Field investigations typically rely on indicators such as slope breaks, changes in bed or bank materials, a shift in vegetative type, debris lines, and bank staining may be used to determine bankfull depth (Osterkamp et al., 1983; Gordon et al., 1992). Evidence indicative of a constructive, rather than destructive process is preferable in the determination of bank height; in the southwestern United States channel processes are governed by rapid and violent runoff events, and many of the channels on Walnut Gulch are actively degrading and therefore not in equilibrium. An important drawback of using a GIS is the inability to estimate whether a channel is stable or to accurately depict the correct location of a channel bank. In systems like in Walnut Gulch, where repeated incision has developed stream segments with multiple overbank deposits, bank height is often a subjective interpretation (Miller 2003). Using a GIS increases the subjectivity in estimating bank location and introduces error. In the case of high frequency IFSAR such as was used in this experiment, dense vegetation often reflected the radar pulse and obscured the true ground elevation; a relatively thick vegetative cover at the channel banks is present as an anomaly in the DEM surface. Because of these restrictions, an interactive technique was developed where the user manually interpreted the location of the channel banks. Such problems were not encountered in the LIDAR data, where the first and last returns were used to generate a bald earth
ASPRS Annual Conference Proceedings May 23-28, 2004. Denver Colorado
model. In Walnut Gulch, the riparian overstory has a relatively low canopy density, allowing some of the LIDAR pulses to penetrate all the way to the ground. Since the LIDAR frequency is so high, it does not penetrate the ground or vegetation significantly, resulting in a better representation of the true terrain height than the IFSAR data. Once the approximate location of the channel banks was determined, channel width was derived by simply locating the paired location of the opposite bank and determining the distance. Channel depth for a given profile was calculated by weighting the difference in elevation between each 0.5m segment and the datum represented by the bankfull elevation. Cross-section area was calculated as a product of width and depth.
RESULTS AND DISCUSSION Cross-section results of LIDAR and IFSAR were compared to the field observation. Figures 5 and 6 illustrate the relationships and error between the data derived from the LIDAR and IFSAR DEMs and the field data. As hypothesized, observed channel width was highly correlated to both the LIDAR and IFSAR data (Table 2), while the correlations for channel depth were significantly lower. Channel cross-section area was highly correlated to both surfaces. Linear regression results show strong relationships between field data and derived data with the exception of channel depth and IFSAR. 2.00
80.00 70.00 60.00
1:1 line
50.00 40.00 30.00 20.00
120.00
1.80
y = 0.86x + 0.03 2 R = 0.72
1.60
Area Extracted from LIDAR
y = 1.054x - 0.79 R2 = 0.89
90.00
Depth Extracted from LIDAR
Width Extracted from LIDA LIDAR R
100.00
1.40 1.20 1.00
1:1 line
0.80 0.60 0.40
y = 1.16x + 2.4 2 R = 0.98
100.00
80.00
60.00
1:1 line
40.00
20.00
0.20
10.00
0.00
0.00 0.00
20.00
40.00
60.00
80.00
0.000
100.00
0.00 0.500
1.000
1.500
2.000
0.00
20.00
40.00
Observed Depth
Observed Width
60.00
80.00
100.00
120.00
Observed Area
2.00
90.00
1.80
80.00
y = 1.08x + 2.16 2 R = 0.86
70.00 60.00 50.00
1:1 line
40.00 30.00 20.00
1.40 1.20 1.00 0.80
1:1 line
0.60 0.40
20.00
40.00
60.00
Observed Width
80.00
100.00
0.00 0.000
140.00
y = 1.55x + 7.78 R 2 = 0.94
120.00 100.00 80.00
1:1 line
60.00 40.00 20.00
0.20
10.00 0.00 0.00
1.60
160.00
y = 0.85x + 0.57 2 R = 0.45
Area Extracted from IFSAR
100.00 1 00.00
Depth Extracted from IFSAR
Width Extracted from IFSAR
Figure 5: Estimated values for channel width, depth, and cross-section area extracted from LIDAR DEM plotted against observed values. Linear regression models are shown on the figures with coefficients of determination.
0.500
1.000
1.500
2.000
0.00 0.00
Observed Depth
20.00
40.00
60.00
80.00 100.00 120.00 140.00 160.00
Observed Area
Figure 6: Estimated values for channel width, depth, and cross-section area extracted from IFSAR DEM plotted against observed values. Linear regression models are shown on the figures with coefficients of determination An inspection of Figure 5 shows that the LIDAR data are well distributed across the 1:1 line, indicating that there is no systematic bias in the data. The regression line shows a slight tendency to overprediction, due mainly to the large leverage exerted on the results by data collected on the largest channel in the analysis (85m wide). There is a greater uncertainty in the estimates of depth, which is consistent with the difficulty in measuring small variations in bed topography. The IFSAR data performed relatively well in the estimate of channel width, but showed a significant tendency to overpredict width (Figure 6). The spatial resolution of the IFSAR data was 2.5m, which is considerably larger than the 1m LIDAR data, and the poorer results are expected due to the aggregation of topography resulting from the larger cell size. The 2.5m resolution represents the resolution of data collection;
ASPRS Annual Conference Proceedings May 23-28, 2004. Denver Colorado
the DEM was built directly from the signal return. This approach maintains the high resolution of the data capture but results in a relatively irregular surface. In order to produce an accurate DEM for hydrologic modeling and to reduce the effects of sub-pixel noise on the surface, these data are regularly aggregated into a 10m resolution surface. We did not perform any smoothing operations on the data, and some of the error in channel depth may be due to local irregularities in the surface. Several difficulties were encountered in the extraction of cross-section data from the IFSAR DEM. The ability to discriminate small features is a function of the vertical and horizontal resolution of the terrain data, and in this project, the 2.5m resolution of the data was an impediment to extracting fine landscape features. As noted earlier, the presence of small shrubs and dense riparian vegetation along the channel banks introduced error into the determination of the channel banks and possibly contributed to the errors in estimation. In some cases spurious elevation data were present in the DEM. These errors resolved themselves as anomalous sinks or spikes in the surface model. In such cases, the cross-section profile was slightly moved, but these anomalies are a serious impediment to the development of fully automated systems.
AREA
DEPTH
WIDTH
Table 2: Pearson correlation matrix showing relationships among predicted and observed values for channel width, depth, and cross-section area.
LIDAR
LIDAR 1.00
IFSAR
IFSAR 0.94
OBSERVED 0.95
1.00
0.92
OBSERVED LIDAR IFSAR OBSERVED LIDAR IFSAR OBSERVED
1.00 1.00
1.00
0.55
0.85
1.00 0.96
0.70 1.00 0.99
1.00
0.97 1.00
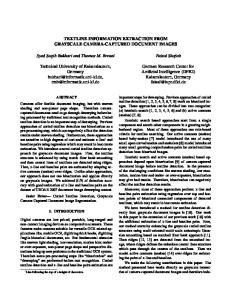
Whether in the field or using a GIS, extracting channel cross-section data is a somewhat subjective exercise, especially in ephemeral streams such as Walnut Gulch. The classic thalweg-bank-floodplain complex found on perennial streams is often absent in a sandy wash. Actively degrading channels may form no definitive bed or bank features to guide the observer in determining the appropriate bankfull depth. Field observations in such environments are relatively challenging, and the researcher must often utilize secondary information such as flood debris, soil properties, or vegetative characteristics. None of these tools is available to the researcher attempting to design a cross-section based on profiles extracted from a DEM. The user must rely on the presence of obvious landscape features; where none exist the prospect of determining an appropriate width or depth is futile. However, in the majority of cases, the channel form was clearly apparent in the graphical representation of the channel profiles. Thus, this approach shows promise for the future development of fully automated GIS-based techniques. An example of the difference in the channel profiles resulting from the different methods for calculating channel shape is presented in Figure 7. Note that the LIDAR data is closely matched to the observed data, while there is a significant difference in the profile extracted from the IFSAR surface in that there appears to be a relatively deep channel located near the right bank. In this particular case, there was significant disturbance within the channel due to local road building, and it appears that the IFSAR surface incorporated some of the localized disturbance in the estimation of channel height. Slight geopositioning error in either the IFSAR or channel cross-section location would result in the capture of some of the channel disturbance. The resolution of the LIDAR data is such that we were able to identify the exact cross-section and not capture the noise in the channel bed due to excavation of gravel. The semi-automated method used in this research had several potential points at which error can be introduced due to user error or interpretation. Field estimates of channel bank are user-dependent, especially in a system like Walnut Gulch where aggradational landforms are not always present (Gordon et al., 1992). Once the data were input to the spreadsheet, a user was required to identify the channel tops. This step was the
ASPRS Annual Conference Proceedings May 23-28, 2004. Denver Colorado
greatest source of error; channel profiles may have multiple breaks in slope and determining the bank top requires considerable knowledge of the system. In this research we used prior knowledge of the expected channel width (Miller, 1996) to interpret the profile. An important next step in this research is to fully automate the determination of channel bank location using the spatial variability within a given stream segment rather than relying solely on a single cross-section. 0 0
5
10
15
20
25
30
35
40
45
50
-0.5
Depth (m)
-1
-1.5
LIDAR Observed IFSAR
-2
-2.5
-3
Cross-section Width (m)
Figure 7: Comparison of channel profile extracted from LIDAR, IFSAR DEM and observed data
CONCLUSIONS A semi-automated approach for extracting channel morphologic properties from high resolution digital elevation models based on the findings of Miller (2003) was enhanced. Results indicate that the extracted channel properties of width and cross-section area were highly correlated to field observations for data extracted from two DEMs; a LIDAR surface with 1m resolution and an IFSAR surface with 2.5m resolution. Statistical analyses showed that the populations of the field observations and those from both DEMs were the same. These findings are encouraging and underscore the value of using high resolution mapping techniques, such as LIDAR, to aid in geomorphic and hydrologic research. This research is part of a larger program investigating heuristic soil classification, and it is anticipated that a fully automated method will be developed. Current research efforts are on developing a streamlined ArcMap tool that would significantly reduce user interaction. Field observations are generally preferable to secondary data extracted from terrain models. However, the high cost of pursuing detailed field work necessary for process-based hydrologic and geomorphic models makes a large-scale effort both difficult and time-consuming. The improvement in resolution and accuracy provided by the LIDAR data is a major improvement over conventional DEMs. This paper shows that even in large channels, the LIDAR data provide better results than using IFSAR data, which are themselves significantly better than conventional DEMs. These differences will become more profound as the research is extended into more complex terrain, smaller channels, or more heavily vegetated areas. Process-based models are sensitive to the estimation of channel morphology, and the automated parameterization of channel properties would be of significant benefit to these lines of research. Efforts aimed at developing a heuristic classification model for soils require detailed terrain data and data layers derived from those surfaces, and these findings illustrate the potential for extracting land surface information at a resolution necessary to carry out this research.
ACKNOWLEDGEMENTS This project was funded under a specific agreement with the USDA-ARS Southwest Watershed Research Center and is part of a larger effort funded by the US Army Topographic Engineering Center. The support of
ASPRS Annual Conference Proceedings May 23-28, 2004. Denver Colorado
the ARS is greatly appreciated, especially with respect to access to the Walnut Gulch Experimental Watershed and field research facilitation. Field assistance was provided by Katherine Hirsch, SWRC volunteer, David Thoma, Post-Doctoral scientist, USDA-ARS, Shea Burns and Soren Scott, both students at the University of Arizona.
REFERENCES Arnold, J.G., J. R. Williams, R. Srinivasan, K.W. King, and R. H. Griggs (1994). SWAT-Soil water assessment tool. USDA, Agricultural Research Service, Grassland, Soil and Water Research Laboratory, Temple, Texas Bowen, Z.H. and R.G. Waltermire (2002). Evaluation of light detection and ranging (LIDAR) for measuring river corridor topography. Journal of American Water Associations, 38 (1): 33-41. ESRI (1998). Arc/Info. Version 7.1.2. Redlands, California: Environmental system research institute. ESRI (2004). Arc/GIS. Version 8.3. Redlands, California: Environmental system research institute. Gabriel, A. K., R.M. Goldstein, and H.A. Zebker (1989). Mapping small elevation changes over large areas: Differential radar interferometry. Journal of Geophysical Research, 94(B7): 9183-9191. Gordon, N.D., T.A. McMahon, B.L. Finlayson (1992). Stream Hydrology: An introduction for ecologists. Wiley and Sons, New York, 552 pp Hedman, E.R., and W.R. Osterkamp (1982). Streamflow characteristics related to channel geometry of streams in the Western United States. USGS Water-Supply Paper 2193. 17 pp. Jarnagin, S.T. (2004). Use of LIDAR (Light Detection and Ranging) to monitor stream morphology due to urbanization of a suburban watershed. Online available at http://www.epa.gov/ord/scienceforum/PDFs/technology/jarnagin_s.pdf. (Accessed February 23, 2004) Leopold, L.B., and T. Maddock (1953). The hydraulic geometry of stream channels and some physiographic implications. USGS Prof. Paper 252. Madsen, S.N. and H.A. Zebker (1998). Imaging radar interferometry. In: Principles and applications of imaging radar: Manual of remote sensing. John Willey and Sons, 2, pp. 359-406. Miller, S. N. (2003). Estimating channel morphologic properties from a high resolution DEM. The First Interagency Conference on Research in the Watersheds, 27-30 October 2003, Benson, AZ. Miller, S.N., D.J. Semmens, R.C. Miller, M. Hernandez, D.C. Goodrich, W.P. Miller, W.G. Kepner, D. Ebert (2002). GIS-based hydrologic modeling: the automated geospatial watershed assessment tool. Proc. of the 2nd Federal Interagency Hydrologic Modeling Conference, July 28 - August 1, 2002, Las Vegas, Nevada Miller, S.N., D.P. Guertin, and D.C. Goodrich (1996). Linking GIS and geomorphology field research at Walnut Gulch. Proc. of the AWRA’s 32nd Annual Conference and Symposium: “GIS and water resources”, Sept. 22-26, 1996, Ft. Lauderdale, FL. Mrstik, V., G. VanBlaricum, Jr., G. Cardillo, and M. Fennel (1996). Terrain height measurement accuracy of interferometric synthetic aperture radars. IEE Transactions on Geoscience and Remote Sensing, 34(1): 219227 Osterkamp, W.R., L.J. Lane, and G.R. Foster (1983). An analytical treatment of channel-morphology relations. USGS Professional Paper 1288, 21 pp. Renard, K.G., L.J. Lane, J.R. Simanton, W.E. Emmerich, J.J. Stone, M.A. Weltz, D.C. Goodrich, and D.S. Yakowitz (1993). Agricultural impacts in an arid environment: Walnut Gulch Studies. Hydro. Science and Technology 9(1-4): 145-190. Rubinstein, B.A., B.A. Needelman, D. M. Balduff and M.C. Rabenhorst (2004). LIDAR for subaqueous and terrestrial soil landscape analysis. Online available at www.agnr.umd.edu/sawgal/Pictures2/LIDARpaper.pdf. (Accessed February 15, 2004) Smith, R.E., D.C. Goodrich, D.A. Woolhiser, and C.L. Unkrich (1995). KINEROS–A kinematic runoff and erosion model; Chapter 20 in V.P. Singh (editor), Computer Models of Watershed Hydrology, Water Resources Publications, Highlands Ranch, Colorado, 1130 pp. Sties, M., S. Kruger, J. B. Mercer and S. Schnick (2000). Comparison of digital elevation data from airborne laser and interferometric SAR systems. ISPRS, 33.
ASPRS Annual Conference Proceedings May 23-28, 2004. Denver Colorado