Semantic Segmentation using Regions and Parts Pablo Arbel´aez1 , Bharath Hariharan1 , Chunhui Gu1,2 , Saurabh Gupta1 , Lubomir Bourdev1,3,† and Jitendra Malik1 1 University of California, Berkeley - Berkeley, CA 94720 2 Google Inc., 1600 Amphitheatre Pkwy, Mountain View, CA 94043 3 Facebook, 1601 Willow Rd, Menlo Park, CA 94025 {arbelaez,bharath2,sgupta,malik}@eecs.berkeley.edu,
[email protected],
[email protected]
Abstract We address the problem of segmenting and recognizing objects in real world images, focusing on challenging articulated categories such as humans and other animals. For this purpose, we propose a novel design for region-based object detectors that integrates efficiently top-down information from scanning-windows part models and global appearance cues. Our detectors produce class-specific scores for bottom-up regions, and then aggregate the votes of multiple overlapping candidates through pixel classification. We evaluate our approach on the PASCAL segmentation challenge, and report competitive performance with respect to current leading techniques. On VOC2010, our method obtains the best results in 6/20 categories and the highest performance on articulated objects.
1. Introduction Accurate segmentation of articulated objects, and in particular people and other animals, is a frontier in recognition; solving it would pave the way towards finer-grained tasks such as sub-categorization, object parsing or three dimensional pose estimation. However, such categories are challenging for visual recognition. While they often have characteristic global shape and texture, they also tend to exhibit large intra-class variations. Secondly, although they have diagnostic parts that are organized in an anatomically correct configuration, they can appear in many different poses. These two observations seem to lead us down different paths. The first one suggests a region-based approach , e.g., [31, 20, 1, 27, 15, 10, 37, 5, 12, 21]; the second one is addressed naturally in a multiscale scanning window detec†This work was done while the author was at Adobe Systems, Inc.
978-1-4673-1228-8/12/$31.00 ©2012 IEEE
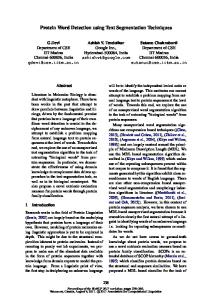
Figure 1. Bottom-up region cues and top-down part detectors provide complementary information for recognizing articulated objects. In this example, low-level segments produce a coherent region candidate of the cat body (top-right) regardless of the unusual pose, while the head triggers a strong activation of a part detector (bottom-left, higher intensities indicate higher score). Our approach integrates the strengths of both paradigms, as illustrated by the output of our region-based cat detector (bottom-right).
tor such as Viola-Jones [36] or Dalal-Triggs [11], complemented with part detectors as in Felszenszwalb et al. [14] or Bourdev et al. [8]. One goal of this paper is to unify these paradigms into a single recognition architecture, and leverage on their strengths. We show experimental results that demonstrate we have been successful in this objective. We approach semantic segmentation by designing region-based object detectors and subsequently combining their outputs. Such an approach can be divided into several sub-problems, as shown in Fig. 2: generation of candidates, representation, detector design and combination. In this paper, we propose novel solutions for each of these tasks. Our
3378
Figure 2. Overview of our approach.
main contributions are the following: • We construct regions by multiscale low-level hierarchical segmentation, obtaining high quality object candidates in a simple and generic way without any midlevel information or learning (Sect. 3). • We propose a multi-class high-level region representation that integrates scanning window part detectors and global appearance cues (Sect. 4). • We propose a novel design for region-based object detectors, based on class-specific region scoring (Sect. 5), followed by pixel classification (Sect. 6). We validate empirically our approach by conducting extensive experiments on the PASCAL Visual Object Classes (VOC) segmentation challenge [13], the most complex and general recognition dataset currently available. When compared to the state-of-the-art on VOC2010, our method is the most accurate on articulated objects, as we discuss in Sect. 7. We obtain the highest performance in 6/20 object categories.
2. Related Work The problem of combining top-down object knowledge with bottom-up grouping cues for semantic segmentation has been well studied over the last decade. Some inspiring early works are [20, 6], which have recently been followed by [3, 37, 24, 18, 9, 29]. There are three broad lines of work, and we review them below: CRF Approaches: A popular approach is to encode segment relations using Conditional Random Fields (CRFs) [19, 21, 5, 23]. Ladicky et al. [21] incorporate object cooccurrence in CRFs, and Kohli and Kumar [19] propose a generic representation for higher-order potentials in MRF. Boix et al. [5] propose a new potential which allows multiple class labels to be assigned to a single node. Lucchi et al. [23] analyze the utility of spatial and global constraints in CRF’s when local and global features have already leveraged information from the whole image. Recently, Maire et
al. [24] solve the combined problem of detection and segmentation of people by incorporating outputs of top down part-detectors in a generalized eigen-problem and obtaining parts and pixel groupings. Our work is orthogonal to this line of work, and we focus on the representation and classification of individual regions, rather than on modeling object relations. Our region-based object detectors can be interpreted as powerful unary potentials and combined with all these graph-based methods. Refining top-down detections: An alternative approach is to start from a bounding box predicted by a scanning window object detector and operate by refining the spatial support of the object. Yang et al. [37], use object detector outputs to estimate object shape, appearance and depth ordering in order to facilitate segmentation. Brox et al. [9] align a predicted object mask to the image contours, apply variational smoothing and assign figure/ground superpixels using self-similarity. Malisiewicz et al. [28] also generate segmentations by transferring them from matched exemplars. Our work differs from these approaches in that we use the output of scanning part detectors in a soft way to define novel region descriptors, instead of restricting the analysis to the locations predicted by an object detector. Parkhi et al. [29] use appearance similarity to expand top-down detections of heads to detect cats and dogs. Our approach is more general and does not rely on coherence in appearance of the entire object; and information from general top-down detector outputs is combined in a more general and natural manner, without the need to manually specify distinctive parts. Scoring bottom-up region hypotheses: Our approach is more along a third line of work which is to start with region proposals and classify them. Along this line of work, Gu et al. [15] start with regions and vote for object detections using a generalized hough transform. Vijayanarasimhan et al. [35] group over-segmented regions to maximize classifier scores. [10, 12, 2] design a ranking function for object segment proposals. Carreira et al. [10] use regression on the responses of multiple figure-ground (FG) hypotheses generated from
3379
Table 1. Quality of our bottom-up object candidates on trainval VOC2011, measured by the covering of the ground truth. We obtain a significant improvement over the baseline [4]. An oracle selecting the best among our regions per image would achieve a recognition accuracy of 76% plane bicycle bird boat bottle bus car cat chair cow table dog horse mbike person plant sheep sofa train tv artic transp indoors all gPb-owt-ucm [4] 59.3 32.9 70.3 51.1 61.3 51.2 57.6 74.3 58.0 68.6 67.4 67.5 64.3 48.5 53.6 53.5 72.6 71.2 55.1 73.1 67.3 50.8 64.1 60.6 Our regions 76.7 41.6 84.0 74.2 77.2 75.8 74.9 85.2 69.6 79.1 82.9 82.4 75.9 69.6 74.4 70.4 80.3 83.2 76.5 85.1 80.2 69.9 78.1 76.0
bottom-up processing and produce the final semantic segmentation by a weighted voting for the class of each pixel based on regression scores of FG hypotheses. We differ from this work significantly. First, our regions (FG hypotheses) are obtained differently, in a purely bottom-up manner without any learning and dataset-specific parameter tuning. Second, we incorporate stronger top-down cues from sophisticated off-the-shelf object detector scores to classify our regions, and are not restricted to only use a particular set of features for region classification. Third, we train a classifier to explicitly calibrate and project region scores onto the image to produce the final segmentation. Ion et al. [17] use the FG hypotheses of [10] to come up with image tilings and produce semantic segmentations by constructing a joint distribution over image tilings and tile labelings in [18]. We differ from this work and separate the task of labeling and projecting from region scores onto the image, potentially allowing use of more sophisticated machinery at the two separate stages. [3, 33] also propose FG hypotheses: while Arandjelovi´c et al. [3] use them to segment sculptures, Sande et al. [33] use them for bounding box prediction; neither considers the more general and harder problem of object segmentation, which is the focus of this paper.
3. Region Generation Our approach uses bottom-up regions as object candidates. Since the choice of these initial units impacts the whole recognition pipeline, they should satisfy two basic properties. First, they should approximate as precisely as possible the ground-truth masks for a large majority of objects. Second, their number should be limited, e.g. in the order of 1000 generic regions per image, in order to allow the use of powerful but computationally expensive learning techniques. Note we don’t impose any particular structure on our object candidates, such as parsing the image as in [17]. As in the case of sliding window detectors, we allow redundancy in the basic units and let the recognition machinery select the good ones in later stages. We generate object candidates building on the publicly available segmentation method of [4]. The output of that algorithm is a hierarchical tree of regions at different levels of contrast, based on globalP b contours, and represented as a boundary image called Ultrametric Contour Map (UCM). These bottom-up regions are therefore uniform in brightness, color or texture at multiple degrees of homogeneity.
They are few in number (about 150 per image) and provide almost full boundary recall for low enough thresholds. However, they tend to fragment objects with heterogeneous parts and strong internal contours. In order to cope with this structural issue, we propose a combinatorial multi-scale region extraction strategy: we compute UCMs at three resolutions of the input image (×1.0,×0.6,×0.3) in order to cover a large range of object sizes and different degrees of homogeneity. Then, we construct additional candidates by merging pairs or triplets of adjacent regions at the two coarser resolutions. Table 1 presents the evaluation of the quality of our set of candidates on the trainval set of the PASCAL VOC2011 segmentation challenge (2223 images). The overlap metric is the covering of the ground truth, given by the mean best intersection-over-union score between the regions in our pool of candidates and each object instance in the dataset. When compared to a naive application of the algorithm in [4], our combinatorial multi-scale strategy produces more candidates (1322 per image), but provides a large improvement in their quality. We obtain an average ground-truth covering across categories of 76%, indicating the presence of a significant fraction of complete or almost complete objects in our region pool. With the exception of bicycles, which are semi-transparent and hence difficult to capture with a single generic region, we obtain ∼ 70% or better in all the categories. In order to gain further insights, in the sequel we group the 20 PASCAL categories into three super-categories: articulated objects (bird, cat, cow, dog, horse, person, sheep), transportation means (aeroplane, bicycle, boat, bus, car, motorbike, train) and indoor objects (bottle, chair, diningtable, potted plant, sofa, tv monitor). Our candidates are particularly accurate on articulated objects and indoor categories. Furthermore, note that the ground-truth covering is not an upper bound for the recognition performance of our approach, as it may segment and classify independently the parts of a fragmented object, e.g., the head and body of a person. Note that compared to [10, 12] our region generation does not use any mid-level cues or additional training. This is a conscious choice : since it requires no dataset-specific training or parameter tuning, our approach is more robust and more generalizable. Further, as our experiments show, our low level engine is in fact powerful enough to produce
3380
good enough candidates to allow us to achieve state-of-theart performance.
4. Region Representation 4.1. Part Compatibility Features Part Activations In order to leverage object parts for describing regions, we consider the output of top-down scanning part detectors. For this purpose, we use the poselet framework introduced in [8, 7]. These models are trained by finding patches in the objects with similar keypoint configuration, guaranteeing thus an underlying semantic consistency of the detected parts. In practice, there are between 100 to 200 poselets per category, covering a large range of parts, poses and viewpoints. Each poselet comes with a soft foreground mask, obtained by averaging aligned masks of training examples. In the experiments, we use pre-trained models and masks from [9], in order to make a fair comparison with that work. Given a test image, we run all the poselet detectors and collect activations at various positions, scales and confidence scores. For each activation, we translate and scale the corresponding poselet mask to match the predicted bounding box of the activation in the image. It should be noted that the rest of our approach is agnostic to the choice of a particular object detector and other options, such as [14], can be considered, as shown in the experimental section. We only require as input a soft or binary mask indicating the rough location and scale of the part or object hypothesis, which we call activation mask and denote P , and an associated confidence score SP for the detection. Part-Based Region Ranking Our strategy to exploit part models consists of defining ranking functions for the regions in an image, based on the information provided by part activations. Precisely, given a region R and the activation mask P of a part, we consider the intersection between the two, |P ∩R|, and the confidence SP of the part classifier. We then combine these quantities into ranking functions of the form: F (P, R, α) =
SP α1 · |P ∩ R|α2 , |P ∪ R|α3 · |P |α4 · |R|α5 · |I|α6
(1)
where |I| denotes the total area of the image and α = (α1 , ..., α6 ) ∈ N6 . Each choice of α produces a different ranking function. For instance, α = (1, 0, 0, 0, 0, 0) takes into account only the score of the part activation and α = (0, 1, 1, 0, 0, 0) corresponds to the area of the intersection between part and region divided by the area of their union. In order to avoid early hard decisions by committing to a single hand-designed ranking function, we consider multiple choices of α and treat them as different features. In the
Figure 3. Ranking regions using part activations. Top: Original image and activations using the part detectors of [9]. A diagnostic part (the head) is detected, along with several false positives. Bottom: Best two object candidates for the cat class after nonmaximum suppression, using one of our part-based ranking functions.
experiments, we use N = 13 functions with values of αi in the range {0, 1, 2}. We did not observe an empirical improvement when including higher values of the exponents. Note that our approach is analogous to the motivation behind polynomial kernels, where several nonlinear combinations of individual features increase the power of the representation. Figure 3 shows an example of part-based region ranking. Note that several diagnostic parts, for instance a head and a torso detectors, can be activated inside the same region, and their joint response provides stronger evidence for the presence of the object. Thus, we describe each candidate by considering the ranking functions associated to the part with highest confidence, and also the 13 functions obtained by aggregating confidences across A activations P = {P1 , ..., PA }: ci (P, R, α) = F
X
Fi (P, R, α), ∀i ∈ [1, ..., N ].
(2)
P ∈P
Additionally, we take into account 5 more entries: the (x, y) normalized coordinates of the centroid of the highest confidence part with respect to the one of the region, the average relative location of activations and their total number A. In total, our part-activation feature for one object category has 13 + 13 + 5 = 31 dimensions.
4.2. Global Appearance Features As a complement to diagnostic parts, we would like to capture global appearance characteristics of objects such as overall shape, color and texture. For this purpose, we follow
3381
a two stage approach, where we consider a set of first-order appearance cues defined on the region support, e.g. color distribution, and train classifiers for each of them separately and also for their combinations. Then, on the second stage, we use the responses of these first-level classifiers as highlevel, category specific features. More specifically, we consider the following first-order appearance cues: Shape: a spatial pyramid[22] representation three levels on the bounding box of the region. Color: a joint HSV histogram for all pixels inside the region. Texture: opponent-SIFT[32] descriptors at three scales in a local grid inside the region. The descriptors are then vectorquantized using K-means. In order to take advantage of scene-level information, we represent each region by the concatenation of appearance cues on its interior and on the whole image. We train the first-level classifiers with the framework described in Section 5 and use the predicted scores on the region as a second-order feature. Following our principle of avoiding early hard-choices, we consider 7 such second-order appearance features for each category, by forming all possible combinations of the three first-order cues.
4.3. Semantic Contours Features As an additional source of top-down information, we consider the method of [16], which produces a soft map of category-specific contours for each of the PASCAL categories. We consider 4 region features per semantic contour map: the total contour strength in the boundary, in the interior and exterior of the region as well as its average strength on the boundary.
4.4. Generic geometrical properties We extract the following 16 generic geometric properties for each region, similarly to [10]: normalized area, normalized centroid, eccentricity, normalized length of equivalent diameter, extent, solidity, normalized length of axis, principal orientation, ratio of lengths of minor/major axes, aspect ratio, average strength of UCM inside, outside and on the boundary, and normalized length of perimeter.
4.5. Multi-Class Features As described above, for each object candidate, we compute 31 normalized part features, 7 second-order appearance features, 4 semantic contour features and 16 geometric properties; the three high-level descriptor types are category-specific and the low-level geometric properties are shared. In order to leverage on contextual cues expressed by differences in appearance and part activations among categories, our final region representation is the concatenation of features associated with all the categories of interest. As an example, for the experiments in the PASCAL benchmark, our multi-class feature vector has 856 =
(31 + 7 + 4) ∗ 20 + 16 dimensions. The multi-class region representation we propose aims simultaneously at high expressiveness and generality. Such a description relies implicitly on the ability of the learning machinery to assess the relative importance of each feature for the specific task of classifying the region into a given semantic category.
5. Region Scoring The goal of region scoring is to predict the probability of belonging to each category of interest for each object candidate. For this purpose, we learn independent region classifiers for each category, using the same high-level multi-class features for all of them. We follow a discriminative approach and train one-vs-all non-linear support vector machine classifiers. Since we assume high ground-truth covering in the pool of object candidates, we use as positive exemplars the ground-truth masks of objects in the category and as negatives all the other objects. Additionally, we label as negatives pure background regions in the training images. We then train an initial classifier, retrieve maximal scoring regions in the train images as in [11], and add them as negative training instances. We consider as hard negatives all high scoring regions among our candidates that overlap with the ground-truth mask by less than 50%, after nonmaximum suppression to avoid redundancy. Hence we refine the decision boundary by exposing the classifier to the type of regions it will encounter at test time. Note that, since we are using the same set of multi-class features for all the categories, only the labels determine each learning problem and the multiple decision boundaries tessellate the joint representation space. This property contributes to better calibration among different detectors, as discussed in the experimental section. For robustness, we use the same kernel and hyper-parameters for all the categories and weight the classes by their unbalance. Our region scoring strategy is tractable thanks to the low dimensionality of the representation and the use of additive kernels [26, 25, 34], which combine the expressive power of non-linear classifiers with efficiency close to linear ones, both in training and testing. After classification, each region is assigned a score for all the categories of interest. The next section studies how to project that information from the space of object hypotheses back into the image plane.
6. Pixel Classification Regions form a powerful intermediate representation, but our end goal requires us to make pixel level decisions. This task is not trivial, because a single pixel may be part of several different regions and hence may have several differ-
3382
ent scores. For this purpose we train a final set of classifiers that operate on pixels rather than on regions. We construct a feature vector for each pixel as follows. We consider three ways of projecting region scores onto pixels: • Each pixel receives the average score of all the regions it is part of. • Each pixel receives the maximum score among all the regions it is part of. • We do non-max suppression on the regions, i.e, we choose the highest scoring region, then discard all overlapping regions, and repeat. Each pixel then receives the score of the highest scoring region it is part of. For each region, we have scores for 20 categories. In addition, for each category, we train 4 different sets of classifiers for different settings of the SVM hyperparameter C. This gives us 80 classifiers for each region. For each classifier we can project onto pixels in 3 different ways, leading to a total of 240 scores for each pixel. We then train additive kernel classifiers for pixels using these 240 scores as features and convert the scores into probabilities using Platt’s method [30]. Note that, as in the case of region scoring, the representation space here is shared among categories and each individual learning problem is completely determined by the labels. At test time, our region-based object detectors produce confidence maps for each category. The final stage of processing consists of combining these confidence maps into a single semantic segmentation. In the PASCAL setting, pixels not belonging to the 20 object categories of interest are labeled background. Rather than modeling explicitly this heterogeneous category, we declare a minimum level of confidence for our object detectors. As we show in the experimental section, our approach produces fairly well calibrated detectors, which allows us to pick a single universal threshold, thus avoiding category-specific tweaks from end to end of the processing pipeline.
7. Experiments We validate empirically our approach on the standard PASCAL VOC segmentation challenge. We first conduct multiple control experiments on the validation set, assessing the relative importance of each individual component in our approach. Then, we submit the results of our full system on the test set to the evaluation server in order to compare our performance against the state-of-the-art. Control Experiments. In the control experiments, we evaluate each detector independently by constructing a confidence map and measuring its intersection-over-union
Table 2. Control experiments on validation set, evaluating individual components of our approach (see text). max IU(%) NONMAX CMAPS METHOD NO PRT NO APP NO SC NO G plane 34.5 37.4 44.4 44.9 bicycle 16.9 17.6 20.0 19.9 bird 20.3 22.4 25.9 25.7 boat 18.3 26.3 23.7 23.2 bottle 23.5 26.1 30.6 34.8 bus 42.4 41.0 45.8 46.0 car 43.0 40.9 44.3 46.3 cat 38.7 38.3 44.4 46.0 chair 11.1 12.1 12.2 12.1 cow 30.8 35.8 37.8 36.5 table 20.3 10.4 22.3 23.2 dog 26.4 35.8 34.5 32.9 horse 23.9 36.8 37.9 40.3 mbike 31.0 33.4 36.5 36.7 person 38.9 36.1 44.3 43.9 plant 17.6 22.3 22.0 24.3 sheep 38.5 23.5 35.9 35.8 sofa 14.1 15.9 13.0 14.3 train 37.5 26.0 40.9 41.9 tv 40.7 41.4 51.0 49.5 articulat 31.1 32.7 37.2 37.3 transp 31.9 31.8 36.5 37.0 indoors 21.2 21.4 25.2 26.4 all 28.4 29.0 33.4 33.9
ALL 44.4 20.3 26.0 24.3 30.9 45.1 44.4 45.6 12.5 38.8 21.6 35.8 38.6 36.4 44.2 25.7 36.1 15.1 41.8 50.7 37.9 36.7 26.1 33.9
PC MAPS SNG MC FULL 47.0 45.0 46.4 19.8 18.4 20.7 31.2 30.7 31.6 24.1 24.7 23.1 31.3 31.6 30.5 46.6 48.2 48.0 47.4 47.3 46.9 46.7 46.6 47.3 11.9 11.8 12.7 42.8 41.9 41.9 21.4 21.0 22.2 36.9 36.9 36.7 39.3 37.9 36.0 38.2 38.2 37.8 45.0 45.5 46.1 24.5 26.1 27.4 37.5 38.0 41.8 16.5 18.4 18.5 39.5 39.5 41.9 49.5 50.2 47.5 39.9 39.6 40.2 37.5 37.3 37.8 25.8 26.5 26.5 34.8 34.9 35.2
score with the ground-truth objects in the category for multiple thresholds. We report the maximal value obtained, labeled “max IU”, which measures the overlap between the predicted mask and the ground-truth at the detector’s optimal regime. Additionally, we report the average of this metric on the super-categories: articulated objects (“articulat”), transportation means (“transp”), indoor objects (“indoors”), as well as the mean across the 20 classes (“all”). Note that this metric differs from the standard PASCAL benchmark, which evaluates only the combined segmentation. We use it because it allows separating two important aspects of the segmentation problem: soft object detectors design and their combination. The left panel of Table 2 presents experiments measuring the relative power of the different types of region representations discussed in Section 4. In this case, we score regions using different sets of features and construct confidence maps directly by performing non-maximum suppression on regions (“NONMAX CMAPS”), thus omitting pixel classification. This procedure is commonly used in scanning window settings and relies strongly on the score of the classifier to discard overlapping hypotheses. Column “ALL” reports results using our full set of features and the other columns are obtained by “brain damaging” the system and removing one particular type of feature from the set. Both the part compatibility features and the global appearance contribute significantly to the final performance and provide complementary information. The semantic contour features provide a smaller but noticeable gain in the three
3383
super-categories, validating this additional source of topdown information. In contrast, low-level geometric properties are not very useful when combined with the highlevel features. Their inclusion benefits articulated objects marginally, but hurts on transportation means and indoor objects. The right panel of Table 2, labeled “PC CMAPS”, evaluates our pixel classification approach for constructing confidence maps (Section 6). The first column “SNG” is obtained by using as pixel features only the 3 scores (max, mean and non-max value of regions containing it) for the category. Even in this restricted setting, we obtain a significant improvement over using only the nonmax cmaps in column “ALL”, which indicates that the other two types of scores provide additional information. The second column “MC” uses as features the 3 scores for all the categories, and the third one “FULL” takes as input all scores for 4 values of the SVM hyper-parameter C (240 features per pixel). In the two cases, we obtain a steady improvement by increasing the set of scores, indicating that our pixel classifiers can take advantage of richer input to improve accuracy and provide a principled alternative to manual hyper-parameter selection.
Figure 4. Calibration of multiple detectors through pixel classification.
In the experiment reported in Figure 4, we test the calibration of our object detectors. The dotted red line represents the maxIU performance of our “FULL” model (35.2%), computed independently for each category. This number is a good indicator of its maximal performance on the PASCAL benchmark, because it assumes perfect calibration among detectors. The solid blue curve shows the PASCAL performance (excluding background) as the detector threshold varies; at the peak, the gap in accuracy with the individual evaluation is only 1.4%. Thus, the loss of accuracy is modest by choosing a single universal threshold of 0.3. This result provides further empirical evidence in favor of our pixel classification stage. Test set performance. In order to have a direct comparison with the state-of-the-art, we evaluate our approach on the test set VOC. We choose the full version of our system, retrain it using all the trainval data and submit our results to the automatic evaluation server. The comparison is presented in Table 3. The left panel shows the most up-todate version of entries in comp5 (train on VOC data), and the right panel shows our results next to [9], the only en-
Table 3. Performance on test VOC2010. See [13] for more details. VOC(%) [18] [10] [21] plane bicycle bird boat bottle bus car cat chair cow table dog horse mbike person plant sheep sofa train tv bgd articulat transp indoors mean
51.6 25.1 52.4 35.6 49.6 66.7 55.6 44.6 10.6 41.2 29.9 25.5 49.8 47.9 37.2 19.3 45.0 24.4 37.2 43.3 83.4 42.2 45.7 29.5 41.7
59.0 28.0 44.0 35.5 50.9 68.0 53.5 45.6 15.3 40.0 28.9 33.5 53.1 53.2 37.6 35.8 48.5 23.6 39.3 42.1 84.6 43.2 48.1 32.8 43.8
31.0 18.8 19.5 23.9 31.3 53.5 45.3 24.4 8.2 31.0 16.4 15.8 27.3 48.1 31.1 31.0 27.5 19.8 34.8 26.4 70.1 25.2 36.5 22.2 30.2
[5]
SRL UC3M TTI [23]
[9]
52.6 26.8 37.7 35.4 34.4 63.3 61.0 32.1 11.9 36.6 23.9 33.7 36.8 61.6 45.0 26.6 40.5 20.4 43.8 36.4 82.2 37.5 49.2 25.6 40.1
38.8 21.5 13.6 9.2 31.1 51.8 44.4 25.7 6.7 26.0 12.5 12.8 31.0 41.9 44.4 5.7 37.5 10.0 33.2 32.3 80.0 27.3 34.4 16.4 29.1
43.8 23.7 30.4 22.2 45.7 56.0 51.9 30.4 9.2 27.7 6.9 29.6 42.8 37.0 47.1 15.1 35.1 23.0 37.7 36.5 82.2 34.7 38.9 22.7 35.0
45.9 12.3 14.5 22.3 9.3 46.8 38.3 41.7 0.0 35.9 20.7 34.1 34.8 33.5 24.6 4.7 25.6 13.0 26.8 26.1 73.4 30.2 32.3 12.3 27.8
36.7 23.9 20.9 18.8 41.0 62.7 49.0 21.5 8.3 21.1 7.0 16.4 28.2 42.5 40.5 19.6 33.6 13.3 34.1 48.5 80.0 26.0 38.2 23.0 31.8
49.4 23.1 19.2 24.8 26.1 52.4 44.9 32.9 6.5 35.8 22.3 25.5 21.9 58.1 34.6 26.8 39.9 17.5 38.0 25.3 77.9 30.0 41.5 20.8 33.5
FULL FULL +[14] 50.2 48.1 21.2 20.1 38.8 42.2 31.4 32.7 39.6 41.9 58.9 58.0 52.1 52.5 48.1 45.2 7.7 9.2 37.9 42.2 30.9 37.8 36.4 36.6 46.9 50.4 52.0 52.6 47.3 47.6 24.9 28.7 51.9 49.0 26.1 25.2 36.4 41.5 40.1 43.8 83.6 84.0 43.9 44.8 43.2 43.7 28.2 31.1 41.1 42.4
try in comp6 (train on own data). Since we use as input pre-trained poselet detectors of [9], the two methods can be directly compared. When measured against the leading techniques in semantic segmentation, our method obtains the best results in 6/20 categories, achieving superior performance on articulated objects. The column labeled “FULL + [14]” presents a version of our system that includes additional features, constructed by applying the procedure of Sect 4.1 to the bounding boxes predicted by the detector of [14]. The increased performance highlights the generality of our recognition architecture. Results on VOC2011 are reported on Table 4. Figure 5 presents qualitative results. Note that our method successfully extracts objects with heavy occlusion/truncation as well as large pose, scale and intra-class variations. Typical failure modes are illustrated in the last column. These are generally due either to misclassifications, partial segmentation or imprecise object candidates.
Acknowledgements This work was partially supported by The Office of Naval Research MURI grant number N000141010933.
References [1] N. Ahuja and S. Todorovic. Connected segmentation tree: A joint representation of region layout and hierarchy. In Proc. CVPR, 2008. 1 [2] B. Alexe, T. Deselaers, and V. Ferrari. What is an object? In Proc. CVPR, pages 73–80, 2010. 2
3384
Table 4. Results on VOC 2011 test. See [13] for more details. VOC(%) plane bicycle bird boat bottle bus car cat chair cow table dog horse mbike person plant sheep sofa train tv bgd artic transp indoors mean FULL 48.9 20.0 32.8 28.2 41.1 53.9 48.3 48.0 6.0 34.9 27.5 35.0 47.2 47.3 48.4 20.6 52.7 25.0 36.6 35.4 83.3 42.7 40.5 25.9 39.1 FULL+[14] 46.8 18.9 36.6 31.2 42.7 57.3 47.4 44.1 8.1 39.4 36.1 36.3 49.5 48.3 50.7 26.3 47.2 22.1 42.0 43.2 83.4 43.4 41.7 29.8 40.8
Figure 5. Qualitative results. Our method segments accurately objects with occlusion, truncation, and variations in appearance, scale and pose. Failure modes are shown in the bottom row: partial segmentation, imprecise candidates and misclassifications. [3] R. Arandjelovi´c and A. Zisserman. Smooth object retrieval using a bag of boundaries. In Proc. ICCV, 2011. 2, 3 [4] P. Arbelaez, M. Maire, C. Fowlkes, and J. Malik. Contour detection and hierarchical image segmentation. IEEE Trans. on PAMI, 2011. 3 [5] X. Boix, J. M. Gonfaus, J. van de Weijer, A. D. Bagdanov, J. Serrat, and J. Gonz´alez. Harmony Potentials Fusing Global and Local Scale for Semantic Image Segmentation. International Journal of Computer Vision, 96(1):83–102, December 2012. 1, 2, 7 [6] E. Borenstein and S. Ullman. Combined top-down/bottom-up segmentation. IEEE Trans. on PAMI, 30(12):2109–2125, December 2008. 2 [7] L. Bourdev, S. Maji, T. Brox, and J. Malik. Detecting people using mutually consistent poselet activations. In Proc. ECCV, 2010. 4 [8] L. Bourdev and J. Malik. Poselets: Body part detectors trained using 3d human pose annotations. In Proc. ICCV, 2009. 1, 4 [9] T. Brox, L. Bourdev, S. Maji, and J. Malik. Object segmentation by alignment of poselet activations to image contours. In Proc. CVPR, 2011. 2, 4, 7 [10] J. Carreira, F. Li, and C. Sminchisescu. Object Recognition by Sequential Figure-Ground Ranking. International Journal of Computer Vision, 2012. To appear. 1, 2, 3, 5, 7 [11] N. Dalal and B. Triggs. Histograms of oriented gradients for human detection. In Proc. CVPR, 2005. 1, 5 [12] I. Endres and D. Hoiem. Category independent object proposals. In Proc. ECCV, 2010. 1, 2, 3
[13] M. Everingham, L. Van Gool, C. K. I. Williams, J. Winn, and A. Zisserman. The PASCAL Visual Object Classes Challenge. http://pascallin.ecs.soton.ac.uk/challenges/VOC/. 2, 7, 8 [14] P. Felzenszwalb, R. Girshick, D. McAllester, and D. Ramanan. Object detection with discriminatively trained part based models. IEEE Trans. on PAMI, 32(9), 2010. 1, 4, 7, 8 [15] C. Gu, J. Lim, P. Arbelaez, and J. Malik. Recognition using regions. In Proc. CVPR, 2009. 1, 2 [16] B. Hariharan, P. Arbelaez, L. Bourdev, S. Maji, and J. Malik. Semantic contours from inverse detectors. In Proc. ICCV, 2011. 5 [17] A. Ion, J. Carreira, and C. Sminchisescu. Image segmentation by figure-ground composition into maximal cliques. In Proc. ICCV, 2011. 3 [18] A. Ion, J. Carreira, and C. Sminchisescu. Probabilistic Joint Image Segmentation and Labeling. In Proc. NIPS, 2011. 2, 3, 7 [19] P. Kohli and M. Kumar. Energy minimization for linear envelope mrfs. In Proc. CVPR, 2010. 2 [20] M. Kumar, P. Torr, and A. Zisserman. Obj cut. In Proc. CVPR, 2005. 1, 2 [21] L. Ladicky, C. Russell, P. Kohli, and P. Torr. Graph cut based inference with co-occurence statistics. In Proc. ECCV, 2010. 1, 2, 7 [22] S. Lazebnik, C. Schmid, and J. Ponce. Beyond bags of features: Spatial pyramid matching for recognizing natural scene categories. In Proc. CVPR, 2006. 5 [23] A. Lucchi, Y. Li, X. Boix, K. Smith, and P. Fua. Are spatial and global constraints really necessary for segmentation? In Proc. ICCV, 2011. 2, 7 [24] M. Maire, S. Yu, and P. Perona. Object detection and segmentation from joint embedding of parts and pixels. In Proc. ICCV, 2011. 2 [25] S. Maji and A. Berg. Max-margin additive classifiers for detection. In Proc. ICCV, 2009. 5 [26] S. Maji, A. Berg, and J. Malik. Classification using intersection kernel support vector machines is efficient. In Proc. CVPR, 2008. 5 [27] T. Malisiewicz and A. Efros. Recognition by association via learning per-exemplar distances. In Proc. CVPR, 2008. 1 [28] T. Malisiewicz, A. Gupta, and A. A. Efros. Ensemble of exemplarsvms for object detection and beyond. In Proc. ICCV, 2011. 2 [29] O. Parkhi, A. Vedaldi, C. V. Jawahar, and A. Zisserman. The truth about cats and dogs. In Proc. ICCV, 2011. 2 [30] J. Platt. Probabilistic outputs for support vector machines and comparisons to regularized likelihood methods. In Advances in Large Margin Classifiers, pages 61–74, 1999. 6 [31] X. Ren and J. Malik. Learning a classification model for segmentation. In Proc. ICCV, 2003. 1 [32] K. E. A. van de Sande, T. Gevers, and C. G. M. Snoek. Evaluating color descriptors for object and scene recognition. IEEE Trans. on PAMI, 32(9):1582–1596, 2010. 5 [33] K. E. A. van de Sande, J. R. R. Uijlings, T. Gevers, and A. W. M. Smeulders. Segmentation as selective search for object recognition. In Proc. ICCV, 2011. 3 [34] A. Vedaldi and A. Zisserman. Efficient additive kernels via explicit feature maps. In Proc. CVPR, 2010. 5 [35] S. Vijayanarasimhan and K. Grauman. Efficient region search for object detection. In Proc. CVPR, 2011. 2 [36] P. Viola and M. Jones. Robust real-time face detection. International Journal of Computer Vision, 57(2):137–154, May 2004. 1 [37] Y. Yang, S. Hallman, D. Ramanan, and C. Fowlkes. Layered object detection for multi-class segmentation. In Proc. CVPR, 2010. 1, 2
3385