Scaled Entropy and DF-SE: Different and Improved Unsupervised Feature Selection Techniques for Text Clustering Deepak P∆∗, Shourya Roy# Department of CS&E, IIT Madras, Chennai, India # IBM India Research Lab, IIT Delhi, Hauz Khas, New Delhi, India
[email protected],
[email protected] *
Abstract Unsupervised feature selection techniques for text data are gaining more and more attention over the last few years. Text data is different from structured data, both in origin and content, and they have some special differentiating properties from other types of data. In this work we analyze some such features and exploit them to propose a new unsupervised feature selection technique called Scaled Entropy. Our experiments on standard corpora show that Scaled Entropy is different from other existing techniques and outperforms them more often than not. We have proposed a technique, inspired by Spearman Rank Correlation Co-efficient [1], for comparing different feature selection methods in terms of selected features. We have shown that the feature selection techniques which are significantly uncorrelated according to this measure, can be combined to produce better hybrid methods. As another contribution of this work, we propose two such hybrid unsupervised feature selection techniques. One of them, combination of Scaled Entropy and Document Frequency, works significantly better than the state-of-theart techniques on standard text clustering corpora. Keywords: Feature Selection, Text Clustering, Entropy, Scaled Entropy, Correlation Analysis
1. Introduction Data mining techniques have gained a lot of attention of late. Two principal techniques in the aforesaid arena are clustering and classification. The fundamental difference between these two techniques comes from the fact that clustering does not require any class label information for every object, like classification. Clustering is the technique of grouping similar objects together to divide a collection into groups or clusters. Data in each group should share a common property – often proximity according to some defined distance measure. Two extensive survey papers [2,3] on clustering contain overview of commonly used clustering techniques. Text clustering [4] is the technique of grouping a collection of text documents, articles, Web pages etc. based on some similarity measure. Conventionally, documents to be clustered are represented as vectors of (normalized and/or idf-scaled) term frequencies. The number of elements in the vector would correspond to the size of the vocabulary (collection of all distinct terms) in the corpus. This representation has an inherent problem – Curse of Dimensionality [5] and associated sparseness of the data. As every document is represented as a vector of size equal to the vocabulary size, hence most of the entries (corresponding to the terms not present in that document) in the vector would be zero. Clustering vectors containing tens of thousands of entries causes performance bottleneck and hurts the accuracy of the clustering algorithm also. Hence to obtain meaningful clustering result, it is absolutely necessary to reduce the dimensionality of the feature space by reducing the size of the vocabulary. Feature selection is a technique for doing the same by selecting a subset of relevant and important features from the entire vocabulary and representing documents as vectors of selected features only. People have done lots of work in the area of feature selection for text classification. Some survey papers [6,7] review popular techniques in good detail. Supervised feature selection techniques for classification typically exploit the correlation between class labels and features to select the subset of features which are ∆
Work done while doing internship at IBM India Research Lab
most discriminating. Feature selection for clustering [8] or unsupervised feature selection is different from its supervised counterparts because of unavailability of class label information. Although unsupervised feature selection techniques are less matured than their supervised counterparts, there exist a few techniques worth mentioning. Notable among them are linear Feature Selection techniques such as Document Frequency (DF) [9], Entropy Based Ranking (EN) [10], Term Strength (TS) [11] and Term Frequency Variance (TF) [8,12]. According to DF, the more number of documents a term occurs in, the more important the term is. TS of a term is measured based on the conditional probability of occurrence in the second half of a pair given that it has occurred in the first half. EN projects the entire vector space of documents onto a single term, and calculates the entropy of the projection. The lesser the entropy of the projection, the more important the term is. TF considers the importance of a term as being proportional to the variance of its term frequency. All these methods are linear in terms of number of documents in the corpus and we will refer to them as low-cost techniques. There are some other unsupervised techniques which are quadratic in number of documents such as the Entropy measure proposed in [13] and Term Contribution measure proposed in [9]. In this work, we propose a new low-cost technique for unsupervised feature selection called Scaled Entropy (SE). It exploits a property, which is very typical of text documents, for better feature selection: presence of an attribute is more important for clustering than absence. This technique compares well and quite frequently outperforms other state-of-the-art low-cost unsupervised feature selection techniques. We have proposed a technique, inspired by Spearman Rank Correlation Co-efficient [1], for comparing different feature selection methods. According to this measure, SE is considerably different, in terms of selected features, from other techniques. We have also shown that two different feature selection techniques can be combined to produce better feature selection techniques. We have observed that two feature selection techniques can be most effectively combined if they are both good in performance and ‘different’ (according to our proposed measure). Finally, we proposed one such hybrid method which outperforms with significant margin, other state-of-the-art low-cost unsupervised feature selection techniques. We consistently use K-Means [14] clustering algorithm to compare feature selection techniques, throughout this paper. The rest of the paper is organized as follows. Section 2 describes the proposed Scaled Entropy technique and the intuition behind it. Section 3 describes the proposed measure to quantify agreement between different feature selection techniques based on the ranked list of selected features. Description of the experiments that evaluate various feature selection techniques on standard corpora and their results with an analysis of the results comprise Section 4. Section 5 concludes the paper by summarizing the contributions and listing out pointers for future work.
2. Scaled Entropy 2.1 Asymmetric Information Content Hypothesis One unique property of text documents is that the presence of a word in a document is more informative than the absence of a word. As an illustrative example, consider two documents d1 and d2. We only know that d1 contains terms loan, interest, ATM and credit along with other terms whereas d2 does not contain these terms. Based on only this much information we can say that d1 is likely to belong to a cluster of documents on financial organizations but nothing can be said about d2. We refer to this hypothesis as the Asymmetric Information Content (AIC) hypothesis. Moreover, the information content regarding class membership of a document increases faster than linearly with the number of occurrences of a word in it. Euclidean distance, a metric which weighs presence and absence with the same weighting, is not considered as a good distance measure for text documents, as opposed to its widespread usage in other forms of data as image and bio-medical data [15].
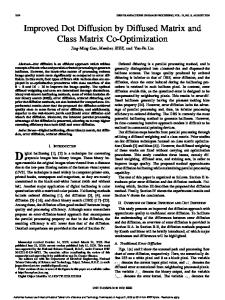
A good feature should be able to distinguish between different classes of documents. In other words, when a set of documents is projected on a feature dimension, the projection of documents belonging to different classes should be well separated. Further it is observed in text data, the purity (uniformity of labels) increases away from the origin in a discriminating dimension. Figure 1 shows the projection of a 2-class (a subset of the R6 dataset described later) text dataset on a discriminating feature dimension. The documents are colored according to their labels.
Figure 1. Projection of a 2-class text dataset onto a discriminating feature
2.2 Scaled Entropy Technique Based on the observations mentioned in the previous section, we lay down three claims that, we believe are among the desiderata for a text feature selection technique. All these are for selecting a feature when the set of documents are projected on the dimension corresponding to the feature. Claim 1. Skewed distributions are better than uniform distributions. Claim 2. Features with clusters away from the origin should be preferred to those which have clusters closer to the origin. Claim 3. Features with a sparse cluster away from the origin, should be preferred to
features that have a dense cluster nearer to the origin. Claim 1 is the idea behind the EN technique and is applicable for non-text data also. The others are based on weighting presence and absence asymmetrically and also that the importance increases faster than linearly with presence. The remaining part of this section gives the formulation of Scaled Entropy motivated by these three claims. The projection of a document vector d on the dimension corresponding to the feature X is given by the dot product d.iX, where iX is the unit vector along the same dimension. Let fi(X) be the fraction of documents for which the projected value on X dimension be i. The Scaled Entropy(SE) value of feature X is calculated as per the following formula.
∑ i
f i ( X ) log(1 + f i ( X )) i
Quality of feature X is inversely related to SE(X). The formulation similar to that of EN[10]. The division by i makes SE different from EN. This scales down the contribution of a set of documents by distance from the origin. Importance of a feature being inversely proportional to the contribution, it satisfies Claim 2 explicitly and implicitly aids Claim 3. We will see how SE compares with other feature selection techniques in section 3 and 4.
3. Comparing Feature Selection Techniques Before going to evaluate the goodness of the SE technique, we would like to show that SE is considerably different from other feature selection techniques in terms of the features it selects. Any feature selection technique gives a ranked list of features in descending order of importance. We wanted to use some of the well known techniques for comparing two ranked lists such as Spearman Rank Correlation Co-efficient
[1], Kendall-Tau Distance etc [16]. These techniques have an inherent assumption that the size of these two ranked lists are equal (say n) and each list contains same n distinct elements. However, top n features from two different feature selection techniques may not be (and most likely too) same. In the following subsection we propose a modification to Spearman Rank Correlation Co-efficient [1] technique to compare two lists which may contain different elements. Using the proposed measure, we compare stateof-the-art feature selection techniques with SE and show that SE is a considerably different technique. This observation eventually led us to another significant contribution of this work. If two feature selection techniques are considerably different and give good results independently then an intelligent combination of them is expected to give better results. We do not attempt to testify this hypothesis as it is evidently not unintuitive and an empirical justification of this hypothesis isn’t essential for the problem that this paper tries to address. Carrying this hypothesis forward, the more different two good techniques are, the better it would be to combine them. We will introduce a couple of such hybrid methods in section 4. 3.1 Modified Spearman Correlation Coefficient Spearman Rank Correlation Coefficient [1] (SCC) is a nonparametric (distribution-free) rank statistic proposed by Spearman1 in 1904 as a measure of the strength of the associations between two variables. Given two ranked lists of size n the following measure M gets a value in the range [-1, +1] where the absolute value indicates the extent of correlation and the sign indicates the type of correlation.
M = 1 − 6∑
d2 ; where d is the difference in rank of corresponding variables n(n 2 − 1)
Two identical lists will have M value +1, two completely opposite lists will have M value -1. Now if the two lists may contain different elements then Spearman Rank Correlation Co-efficient cannot be used to compare them. To aid the comparison of such lists, we define the Modified Spearman Correlation Coefficient (MSCC) by the following formula.
d2 M ′ = 1 − 6∑ n(n + 1)(2n + 1) Where d is the difference in rank for every element that occurs in the union of the top n features of the two lists. The rank of a feature not present in a list is considered as (n+1). It can be verified that MSCC satisfies all the above mentioned boundary conditions i.e. for identical lists it would be +1 and for completely disjoint lists it would be -1. We choose not to explain MSCC and its properties in greater detail due to space constraints. 3.2 Analysis We present the MSCC values for every pair of feature selection techniques DF, EN, TF and SE. Further, we define a Composite Correlation Measure for each technique as the sum of the correlations of that technique with the others in the set. The MSCC values have been computed for different values of n. The results presented here are results on the Reuters 6-cluster dataset (1359 documents and 11019 words), a subset of Reuters-21578, details of which can be found in a later section. As can be seen from the graph, SE is maximally different from DF and maximally similar to EN. Further, SE has the lowest composite similarity measure and hence can be said to be maximally different from other techniques. Another striking observation is that DF and TF appear to have a strong correlation. It may be noted that the correlation measure would increase as n increases, as the number of common features would increase with n. On a related note, we did this same analysis for each of these four methods with the supervised “Information Gain” (IG) [9] feature selection technique on the same dataset. It was found that SE is again highly uncorrelated with IG, the MSCC (for n = 1000) value being -0.63. DF, EN and TF had MSCC
1
http://en.wikipedia.org/wiki/Charles_Spearman
values (n=1000) of 0.29, -0.2 and 0.37 respectively with IG. Based on this analysis we can conclude that SE is significantly different from the state-of-the-art techniques. Table 1. Results of Correlation Analysis
30 00
20 00
15 00
0.8 0.6 0.4 0.2 0 -0.2 -0.4 -0.6 -0.8 -1
10 00
MSCC Values for FS Pairs
Feature Selection Technique DF
Composite Correlation Measure -1.74
EN
+1.20
SE
-2.54
TF
+2.44
Number of Features Selected (n)
4. Experiments and Results In this section, we present detailed experimental results to compare SE with other low-cost feature selection techniques. For each feature selection technique, we perform K-Means clustering [14] using Weka2 on a test dataset and the quality of clustering results is considered as the metric to judge the goodness of the feature selection technique. We take the best of 5 runs with random initial seed value to reduce the effect of the bias of K-Means on the starting centers. Finally, based on our observation (mentioned in section 3) we propose two hybrid feature selection methods which are combination of two pairs of most dissimilar methods. We compare these new techniques with existing techniques similarly. 4.1 Datasets We perform extensive experimentation with the Reuters 6 cluster dataset (R6) which is a subset of the Reuters-21578 dataset3 containing uniquely-labeled documents. Classes considered were crude, trade, grain, money-fx, ship, interest. R6 contains 1359 documents and the size of the vocabulary after stopword removal is 11019. Further, we present results on the Classic3 dataset. Classic34 data set contains 1400 aerospace systems abstracts from the Cranfield collection, 1033 medical abstracts from the Medline collection and 1460 information retrieval abstracts from the Cisi collection, making up 3893 documents in all. After preprocessing, this data set had a vocabulary of 4303 words. 4.2 Hybrid Feature Selection Techniques In section 3, we proposed that different and good feature selection techniques could be combined to create better hybrid feature selection techniques. We introduce two such measures in this section. The DF-SE technique is a combination of the DF and SE techniques. Top n features for the DF-SE technique would be the union of the top n/3 features from the DF technique and top 2n/3 features from SE technique. This asymmetric division is of importance and stems from our preliminary results which show that DF performance peaks at a very low value of n, whereas other techniques peak much later. The other hybrid 2
Weka Toolkit : http://www.cs.waikato.ac.nz/ml/weka/ http://www.daviddlewis.com/resources/testcollections/reuters21578/ 4 ftp://ftp.cs.cornell.edu/pub/smart 3
measure SE-TF is a symmetric combination of SE and TF techniques. Every feature is tagged by the sum of its ranks according to TF and SE (lesser the sum, the better). Top n features are selected from this ranked list. 4.3 Clustering Quality Validation Measures We use purity [17] and entropy [9] to validate the clustering quality. The class labels of documents are used only for validation and not for feature selection or clustering. Purity is defined as weighted sum of the fraction of documents of maximally represented class for each cluster. Entropy is defined as the weighted sum of the entropies of the clusters, the entropy for a cluster calculated as the uniformity of the cluster based on label information. Note that best technique in the case of purity is the technique that gives the highest purity, as opposed to entropy where lesser implies better. As we perform a host of experiments for varying values of n and k (in K-Means), we have an array of performance measures for every feature selection technique. To aid visual comparison of performances, we propose a single quality measure called Sum of Deviations from Best (SDFB) which is a per-technique score, aggregating the performances of the technique across experiments. SDFB for a particular feature selection technique (F1) is computed as the sum of the absolute deviation of entropy (purity) of F1 from the best entropy (purity) obtained (among all feature selection techniques for that experiment) over all experiments (varying n and k). Lower the value of SDFB, the better and consistent (for both entropy and purity SDFBs) the technique. 4.4 Results We present an extensive set of charts from the R6 dataset experiments (some charts such as that for K=18 have been omitted due to space constraints) and a sample of the results for the Classic3 experiments. 4.4.1 Results on the R6 Dataset Table 2. Results on the R6 dataset for varying K and n Purity Plot: K = 6 in K-Means More, the better
Entropy Plot: K = 6 in K-Me ans Lesse r, the better 2.5
0.6
2
0.4
Entropy
Purity
0.8
0.2 0 1000
1500
2000
1.5 1 0.5
3000
0
n = num ber of features selected
1000
1500
2000
3000
n = number of features selected
Entropy Plot: K = 12 in K-Means Lesser, the better
1
2
0.8
1.5
Entropy
Purity
Purity Plot: K = 12 in K-Means More, the better
0.6 0.4 0.2 0
1 0.5 0
1000
1500
2000
n = num ber of fe atures selected
Legend:
3000
1000
1500
2000
n = number of features selected
3000
Purity SDFB Values - Lesser, the better
Entropy SDFB Values - Lesser, the better 3.5
1.6 1.4
3
1.2
2.5
1
2
0.8
1.5
0.6 0.4
1
0.2
0.5
0
0 DF
EN
SE
TF
DF-SE
DF
SE-TF
EN
SE
TF
DF-SE
SE-TF
DF-SE is the most consistent technique across the experiments 5.4.2 Results on the Classic3 Dataset Table 3. Results on the Classic3 Dataset Classic3 Dataset Results for n = 1000 1000 Features Selected from 4303 features 1 0.8 0.6
Purity
0.4
Entropy
0.2 0 DF
EN
SE
TFV
DFSE
SETF
Feature Selection Technique
4.5 Analysis Many useful conclusions could be arrived at by a detailed analysis of the above charts. Firstly, DF shows a sharp decrease in performance with increasing n as depicted by the decrease in purity and increase in entropy as we move towards higher n. Secondly, DF is clearly inferior to the other techniques as illustrated by a huge pillar in the SDFB charts. Thirdly, the performance of SE compares well with those of EN and TF. Fourthly, and most importantly, DF-SE performs better than any of the other techniques and is the best performer in the majority of experiments with R6 resulting in a close-to-zero value for both Purity and Entropy SDFB. The performance on the Classic3 dataset further reinforces that DF-SE is very superior to all the other techniques. Fifthly, SE-TF doesn’t seem to give too much of an improvement over its constituent feature selection techniques. The constituents of SE-TF weren’t as ‘different’ as those of DF-SE (Ref: Section 3.2). This possibly, points to the fact that high-performing hybrid techniques could be obtained only by combining significantly different techniques.
5. Contributions and Future Work In this work, we have laid down the AIC hypothesis that text data is very special in that occurrence of a term conveys more information than the absence of it. Based on this hypothesis we have proposed Scaled Entropy, a different feature selection technique which compares well in performance with existing techniques. We have proposed a measure to compare different feature selection techniques and based on our observation we have introduced the notion of combining different feature selection techniques to create better hybrid feature selection techniques. Future work in this direction would be centered on the variability analysis of feature selection techniques and intelligent usage of it to generate hybrid feature selection techniques. Feature selection techniques could be subjected to variability analysis so as to handpick uncorrelated and good pairs to combine. In
fact, it may be possible to group existing feature selection techniques into few groups based on their mutual correlation. We hope that techniques which have similar heuristics will have higher correlation and hence would cluster together. Then techniques from different groups could be combined to obtain a better hybrid feature selection technique. Another possible extension of this work would be to devise specialized techniques for text using AIC hypothesis. References [1]. Lehmann, E. L. and D'Abrera, H. J. M. “Nonparametrics: Statistical Methods Based on Ranks”, rev. ed. Englewood Cliffs, NJ: Prentice-Hall, 1998. [2]. J. Han, M. Kamber, and A. K. H. Tung. Spatial clustering methods in data mining: A survey. In H. Miller and J. Han (eds.),Geographic Data Mining and Knowledge Discovery. Taylor and Francis, 2001. [3]. A. K. Jain, M. N. Murty, and P. J. Flynn. Data clustering: A review. ACM Computing Surveys, 31(3):264-323, 1999. [4]. Michael W Berry, “Survey of Text Mining: Clustering, Classification and Retrieval”, Springer, 2004 [5]. Jain, Zongker, “Feature Selection: Evaluation, Application and Small Sample Performance”, IEEE Transactions on Pattern Analysis and Machine Intelligence, 1997 [6]. Yang, Y., & Pedersen, J. O. (1997). A comparative study on feature selection in text categorization. Proc. of ICML-97 (pp. 412-420). [7]. Blum, A. L., & Langley, P. (1997). Selection of relevant features and examples in machine learning. Artificial Intelligence, 1(2), 245-271. [8]. Bin Tang, Michael Shepherd, Evangelos Milios, Heywood, “Comparing and Combining Dimension Reduction Techniques for Efficient Text Clustering”, Proceedings of the Workshop on Feature Selection for Data Mining, SIAM Data Mining, 2005 [9]. Liu, Liu, Chen, Ma, “An Evaluation of Feature Selection for text Clustering”, Proceedings of the International Conference on Machine Learning, ICML-2003, 2003 [10]. Liu, Li, Wong, “A Comparative study on Feature Selection and Classification Methods Using Gene Expression Profiles and Proteomic Patterns”, Genome Informatics, 2002 [11]. Wilbur, J.W., & Sirotkin, K. (1992). The automatic identification of stop words. Journal of Information Science, 18, 45-55. [12]. I. S. Dhillon, J. Kogan, , and M. Nicholas. “Feature selection and document clustering”. In M.W. Berry, editor, A Comprehensive Survey of Text mining. Springer, 2003. [13]. Dash, M., & Liu, H. “Feature Selection for Clustering”. Proc. of Pacific Asia Conference on Knowledge Discovery and Data Mining, PAKDD-2000, 2000 [14]. MacQueen, J. B. (1967). “Some methods for classification and analysis of multivariate observations.” Proceedings of the Fifth Symposium on Math, Statistics, and Probability, Berkeley, CA [15]. Bingham, Mannila, “Random Projection in Dimensionality Reduction: Applications to image and text data”, Conference on Knowledge Discovery in Data (KDD 2001), 2001 [16]. Diaconis, P. 1988. “Group representation in probability and statistics”. IMS Lecture Series 11, Institute of Mathematical Statistics. [17]. Zhao, Karypis, “Criterion Function for Document Clustering: Experiments and Analysis”, Department of Computer Science, University of Minnesota, TR#01-40