Safer or Cheaper? Traffic Safety, Vehicle Choices and the Effect of New Corporate Average Fuel Economy Standards Yizao Liu1
April, 2016 Abstract The new Corporate Average Fuel Economy (CAFE) Standards increase fuel economy to 54.5 MPG by model year 2025 and determine fuel economy targets based on vehicle sizes. This paper examines the effect of the new CAFE standards on consumer choices and composition of vehicle sales, accounting for the impact of traffic safety. I first formulate and estimate a mixed logit model of consumer demand using micro-level data. Two measures of traffic safety, consumers’ safety concerns and traffic fatalities, are included and interacted with two vehicle characteristics that matter most for traffic safety: weight and size. Further, I conduct simulations of two extreme firm responses to assess the potential impact of the new CAFE standards: lightweighting and paying CAFE fines. Simulation results suggest that the sales impact will fall almost entirely on the SUV and light truck segments and on US automakers that use lightweighting. Moreover, consumers in states with more traffic fatalities are the most responsive, shifting away from passenger cars. In addition, the new CAFE standards could result in an increase of 3.5 percent in the share of SUV and light trucks, which will cause as many as 152 more equivalent fatalities on roads each year.
Keyword: Fuel Economy Standards, MPG Targets, Lightweighting, Traffic Safety, Automobile Demand
1
Department of Agricultural and Resource Economics, University of Connecticut, 1376 Storrs Rd, Storrs, CT, 06269. Tel: 860-486-1923. E-mail:
[email protected]
1
1. Introduction Growing concerns over the environmental externalities of greenhouse gas emissions have heightened the interest of environmental groups and government in demanding increases in vehicle fuel efficiency. In 2011, President Obama announced an agreement with 13 large automakers to increase fuel economy to 54.5 miles per gallon for cars and light-duty trucks by model year 2025, a jump from the previous standard for all vehicles of 35.5 MPG. Further, until the changes to the CAFE rules in 2012, all passenger cars were held to the same fuel economy standard2 and all lightduty trucks were held to a lower standard.3 The US Environmental Protection Agency (EPA) and National Highway Traffic Safety Administration (NHTSA) now base the new CAFE standards on a vehicle’s footprint, which is measured by multiplying the vehicle’s wheelbase4 by its average track width.5 The footprint, defined as the area between the four wheels, is used a proxy for vehicle sizes. The new standards also maintain the car–truck distinction. Vehicles with a smaller footprint must meet a tighter standard than those with a larger footprint, and light-duty trucks still have a less stringent overall footprint standard than cars. The shift to tougher, vehicle footprint-based CAFE standards may have important implications on both manufacturers and consumers. On one hand, the new standards present major challenges to automakers. Even the smallest and most efficient cars
2
The standard for passenger cars was 27.5 mpg from 1990 to 2011. The standard for light-duty trucks was between 20 and 23 mpg during the same period. 4 The wheelbase is the distance between the centers of the front and rear wheels, which is a measure of the length of a vehicle. 5 The track width is the distance between the centerline of two wheels on the same axle, i.e., side to side, which is a measure of the width of a vehicle. 3
2
struggle as the CAFE standard skyrockets about 10 mpg every five years (Berkowitz and Csere, 2011). Achieving these standards will require various changes in engine and transmission technologies, as well as improved aerodynamics, tires with lower rolling resistance, and materials that reduce weight (Csere, 2010). In fact, to meet the tougher rules that are being phased in, more than 50% of automakers will shift their focus to lightweighting and use of lightweight structural materials on their new products, as other technologies will soon be unable insufficient to enable the industry to progress toward meeting the tougher requirements (Wards Auto, 2014; P.E., 2014). For example, GM is using high-strength steel, aluminum and composites to reduce vehicle weight and also considering using carbon fiber in the future (O’Hara, 2015). Ford has taken the lead by converting the F-150 pickup, its best-selling model, into a full aluminum-body vehicle (Hawver, 2015). On the other hand, although the effect of CAFE standards on traffic safety and fatalities is highly controversial, it is generally believed that the decrease in vehicle weight due to higher fuel economy standard is correlated with increases in vehicle fatalities (Crandall and Graham, 1989). Bigger and heavier vehicles are safer in singlevehicle accidents and are safer for their own occupants in multi-vehicle crashes. Automakers’ decision to lightweight in response to the CAFE standards may affect consumer choices and welfare. If vehicle weight is a key determinant of consumer utility when they value vehicle safety and make vehicle choices, one might wonder how the increasing fuel economy standards will affect consumer’s vehicle choices and traffic safety.
3
It is still uncertain how the new CAFE standards will affect consumer choices, automakers, and traffic safety. Some believe that a fuel economy standard that discourages vehicles with smaller footprints may push consumers’ vehicle choices towards bigger cars and reduce fatalities. However, others believe that the new CAFE standards’ higher MPG requirement for all vehicles in general may cause many automakers to use lightweighting to meet the standards, which may, in turn, affect consumers’ vehicle choices and give rise to larger concerns about traffic safety. This paper examines the effect of the new CAFE standards on consumer choices and composition of vehicle sales, accounting for the impact of traffic safety. I first formulate and estimate a mixed logit model of consumer demand using micro-level data from National Household Travel Survey (NHTS 2011). Specifically, I focus on how traffic safety affects consumers’ vehicle choices and include two measures of traffic safety: one subjective measure, which is a consumer’s own safety concern, and one objective measure, traffic fatalities in the state where the consumer lives. I interact the two measures with two vehicle characteristics that are most related to traffic safety: vehicle weight and size (footprint). The coefficients for the four interaction terms imply how traffic safety affects a consumer’s preference for vehicle weight and size. The demand estimation shows that if a consumer lives in a state with higher traffic fatalities, vehicle size matters but weight does not. Consumers tend to choose bigger car, compared to those living in a state with low traffic fatalities. Further, using estimates from the demand model, I conduct simulations of two extreme firm responses to assess the potential impact of the new CAFE standards.
4
First, I assume that all automakers, if they do not meet the standards now, will meet the MPG requirement of the new CAFE standards by lightweighting. Second, I assume that automakers who do not meet the MPG requirement, instead of trying to meet the standards, will simply choose to pay the fine. For each scenario, I simulate consumers’ choices under alternative MPG targets of CAFE standards and estimate the effects on automakers. The results provide an important reference point of the impact for policy makers when examining the effectiveness of the new CAFE standards. The simulation results show that the effects of CAFE standards vary across vehicle type and origin. Simulation results suggest that the sales and profit impact of the CAFE standards will fall almost entirely on the SUV and light truck segments of the market and on US automakers that use lightweighting. Since consumers care more about vehicle size than vehicle weights, large-size American SUVs and light trucks are preferred and enjoy increasing market shares when US automakers can reduce vehicle weights to improve fuel efficiency while maintaining original sizes. On the other hand, SUV and European automakers will benefit when all firms pay CAFE fines. Moreover, consumers in states with higher traffic fatalities and higher traffic risks are the most responsive, shifting away from passenger cars when making vehicle choices. One possible explanation is their preference for larger size vehicles due to concerns for traffic safety. Finally, I calculate the total equivalent fatalities given the new shares of SUV and light trucks under both scenarios. The simulation results suggests that the new CAFE standards could result in an increase of 3.5 percent in SUV and light trucks shares, which will cause as many as 152 more equivalent fatalities on road each year. 5
A number of studies have analyzed the effects of CAFE standards on consumers and producers. For example, Goldberg (1998) used a short-run model to simulate the effect of an increase in the standard on market equilibrium in which vehicle characteristics and technology are held constant. Austin and Dinan (2005), using a long-run model, estimate annual costs of reducing long-run gasoline consumption by 10% via a 3.8 miles per gallon increase in the fuel economy standards. Klier and Linn (2012) focus on the medium-run effects of CAFE standards and estimate a model that accounts for the characteristics’ endogeneity by using variation of engine models used in vehicle models. Several other studies looked into the effects of the new CAFE standards. Using data from earlier regulatory analyses and a combined economic–engineering model, Whitefoot and Skerlos (2012) concluded that the new standards create an incentive to increase vehicle size except when consumer preference for vehicle size is near its lower bound and preference for acceleration is near its upper bound. Jacobsen (2013) studies the equilibrium effects of an increase in the CAFE standards, focusing on modeling heterogeneity across firms. He finds that the profit impact of CAFE falls almost entirely on US domestic producers. This study is also related to one other area of research on fuel economy standards, consumer choices and traffic safety. Crandall and Graham (1989) show that the costs of added traffic fatalities would more than offset the benefits in reductions of fuel consumption from CAFE standards, even if the improving fuel economy were costless to producers. Ahmad and Greene (2005), using national time-series data, reexamine
6
the relationship between light-duty vehicle fuel economy and highway fatalities from 1966 to 2002 and find no support for Crandall and Graham’s (1989) conclusion. Li (2012) investigates the interrelation between traffic safety and vehicle choice by quantifying the effects of the “arms race” on vehicle demand, producer performance, and traffic safety. Jacobsen (2012) develops a model of vehicle fleets that captures vehicle types and driving safety behavior, applies the model to the recent structure of US CAFE standards, and finds an adverse effect on safety. Anderson and Auffhammer (2014) quantify the external costs of vehicle weight and estimate the effects of vehicle weight on fatalities and serious injuries conditional on collision occurring. This paper differs from the literature in three ways. First, I incorporate two measures of traffic safety into consumers’ vehicle choices. Second, I simulate two specific firm responses to the new CAFE standards, lightweighting and paying fines, which are common and realistic strategies by firms. Third, I simulate and quantify the total equivalent fatalities under the new CAFE standards given alternative industry responses. The results will provide policy makers examining the effectiveness of the new CAFE standards an important reference point of their impact. The remainder of this paper is organized as follows. Section 2 discusses data. Section 3 presents the demand model, and Section 4 discusses the estimation results. Section 5 presents the post-estimation simulations under the new CAFE standards. Section 6 provides that analysis of traffic fatalities, and Section 7 concludes.
7
2. Data This analysis combines several datasets. The main data set used in this analysis is the 2009 National Household Travel Survey (NHTS). NHTS, which is published by the U.S. Department of Transportation, is the latest national cross-sectional survey of personal transportation in the United States. The 2009 survey was conducted between March 2008 and May 2009 and contains 150,147 household level observations throughout the nation. Since this paper focuses on consumer purchases of new vehicles, all new purchases were extracted for estimation. Out of the full sample, a 2008 or 2009 model car owned by a household is considered as a new vehicle purchase. Table 1 presents the summary statistics of variables used in this analysis. The 2009 NHTS only records the year, make, and model of vehicles owned by the household, with no information on vehicle characteristics, so I collected this data on vehicle characteristics from WARD’s Automotive Yearbook. The average retail price of a new car with the horsepower of 220 was $28,732. The average car weighed 3,756 pounds. I use footprint as a proxy for vehicle size, which is consistent with measures used in the new CAFE standards. The average footprint of a vehicle in the sample is 6,800 square inches. Among all vehicles in the sample, around 39% are American cars, 12% are European cars and the rest are Asian cars. In terms of vehicle classes, around half of all new vehicles models are passenger cars (49%), 45% are SUVs, and 6% are light trucks.
8
Respondents to the 2009 NHTS were asked about their views on traffic safety concerns that might have an impact on their vehicle choices and driving behavior. Specifically, they were asked to rate their safety concerns on a scale of 0 to 3, with 0 being not concerned at all and 3 being very concerned. The average safety concern rating is 2.26, which means safety is a moderate concern for most households. I also include traffic fatalities as an objective measure of traffic safety that could affect consumers’ vehicle choices. I collected the fatality data from Fatality Analysis Reporting System (FARS), which measures the number of people killed in traffic accidents each state per year. The average number of fatalities in a state is 1,701 per year, with a large standard deviation of 1,075. Table 2 provides subsample summary statistics of vehicle characteristics, broken down by vehicle origin. There are substantial differences across automakers from different regions. The average price of an American car is $25,809, which is close to that of an Asian car. However, the average price of a European car is much higher, reaching $37,025, with a standard deviation of $19, 632. European cars also enjoy a higher horsepower, followed by American cars and Asian cars. Vehicle weight and size are closely related to traffic safety. American automakers tend to make bigger and heavier cars. An average American car weighs 4,017 pounds and has a footprint of 7,102 square inches, while the weight and footprint of a European car are only 3,560 pounds and 6,394 square inches, respectively. Asian cars also weigh less and are smaller. In terms of the composition of vehicle fleets, American automakers focus on the SUV and light truck segment: 55% of all vehicle models are SUVs and 11% are
9
light trucks. However, 74% of all vehicles made by European automakers are passenger cars; European automakers do not produce light trucks. Asian vehicles fall in between: 51% are passenger cars, 44% are SUVs, and 5% are light trucks.
3. Model Specification This paper formulates a mixed logit model of consumer demand in new vehicle purchases (Revelt and Train, 1997; Train, 1998). Suppose a consumer faces a choice among J new vehicles. The utility of consumer n choosing alternative j ∈ J is specified as: 𝑈𝑛𝑗 = 𝛼𝑛 𝑝𝑗 + 𝛽𝑥𝑗 + 𝛾1 𝑆𝑎𝑓𝑒𝑡𝑦𝑛 ∗ 𝑊𝑒𝑖𝑔ℎ𝑡𝑗 + 𝛾2 𝑆𝑎𝑓𝑒𝑡𝑦𝑛 ∗ 𝑆𝑖𝑧𝑒𝑗 +𝛾3 𝐹𝑎𝑡𝑎𝑙𝑖𝑡𝑦𝑛 ∗ 𝑊𝑒𝑖𝑔ℎ𝑡𝑗 + 𝛾4 𝐹𝑎𝑡𝑎𝑙𝑖𝑡𝑦𝑛 ∗ 𝑆𝑖𝑧𝑒𝑗 + 𝜖𝑛𝑗
(1)
where 𝑝𝑗 is the price of vehicle j, 𝑥𝑗 is a vector of observed characteristics of choice alternatives, including horsepower, weight, MPG, size, etc. 𝜖𝑛𝑗 is an unobserved random error term with i.i.d. extreme value distribution. To capture the effect of traffic safety on consumers’ vehicle choices, I include two variables: consumer’s own safety concern, 𝑆𝑎𝑓𝑒𝑡𝑦𝑛 , which is an subjective measure from the consumer’s own perspective; and traffic fatalities in the state where consumer n lives, 𝐹𝑎𝑡𝑎𝑙𝑖𝑡𝑦𝑛 , which is an objective measure of travel safety on road. I interact 𝑆𝑎𝑓𝑒𝑡𝑦𝑛 and 𝐹𝑎𝑡𝑎𝑙𝑖𝑡𝑦𝑛 with two vehicle characteristics that are closely related to traffic safety, vehicle weight and vehicle size (expressed in footprint).
10
To capture the heterogeneity of consumer preference, I include a random coefficient for price, 𝛼𝑛 , which is assumed to vary over consumers in the population. The density function follows: 𝛼𝑛 ~𝑓(𝛼|𝜃), where 𝜃 is a vector of parameters of the distribution: mean and variance. In this estimation, I assume a lognormal distribution for the coefficient of price. Assuming the i.i.d. extreme value distribution of 𝜖𝑛𝑗 , the probability that consumer n chooses vehicle j, conditioning on Ω𝑛 = (𝛼𝑛 , 𝛽, 𝛾), can be expressed as exp(𝛿𝑗 )
𝐿𝑛𝑗 (Ω𝑛 ) = ∑ where
(2)
𝑗 exp(𝛿𝑗 )
𝛿𝑗 = 𝛼𝑛 𝑝𝑗 + 𝛽𝑥𝑗 + 𝛾1 𝑆𝑎𝑓𝑒𝑡𝑦𝑛 ∗ 𝑊𝑒𝑖𝑔ℎ𝑡𝑗 + 𝛾2 𝑆𝑎𝑓𝑒𝑡𝑦𝑛 ∗ 𝑆𝑖𝑧𝑒𝑗 + 𝛾3 𝐹𝑎𝑡𝑎𝑙𝑖𝑡𝑦𝑛 ∗
𝑊𝑒𝑖𝑔ℎ𝑡𝑗 + 𝛾4 𝐹𝑎𝑡𝑎𝑙𝑖𝑡𝑦𝑛 ∗ 𝑆𝑖𝑧𝑒𝑗 . Since Ω𝑛 is random and unknown, the unconditional
choice probability is the integral of 𝐿𝑛𝑗 (Ω𝑛 ) over all possible realization of Ω𝑛 : exp(𝛿𝑗 )
𝑃𝑛𝑗 = ∫ 𝐿𝑛𝑗 (Ω𝑛 ) 𝑓(Ω𝑛 |𝜃)𝑑Ω𝑛 = ∫(∑
𝑗 exp(𝛿𝑗 )
) 𝑓(Ω𝑛 |𝜃)𝑑Ω𝑛
(3)
The probability 𝑃𝑛𝑗 does not have a closed form solution. Then a maximum simulated likelihood method is used for estimation (Train, 1998). The simulated log likelihood is given by: 𝐽 ̂ 𝑆𝐿𝐿 = ∑𝑁 𝑛=1 ∑𝑗=1 𝑑𝑛𝑗 𝑙𝑛𝑃𝑛𝑗 (𝜃),
(4)
where 𝑑𝑛𝑗 = 1if consumer n choose product j and zero otherwise. 𝑃̂ 𝑛𝑗 (𝜃) is the average simulated probability. The maximum simulated likelihood estimator is the value of 𝜃 that maximize 𝑆𝐿𝐿
11
4. Results The estimation results from the mixed logit model are presented in Table 3. To capture the heterogeneity of consumer tastes, I specify a random coefficient for Price. The coefficient of price is assumed to follow an independent lognormal distribution, since price is expected to have the same negative sign for all consumers, with only magnitude varying across consumers. In addition, I use the negative of price in the estimation since the lognormal distribution is defined over the positive range, while price is expected to have a negative impact on consumer utility. The mean and standard deviation of the log of the price coefficient are estimated and presented in Table 3. For a clearer explanation, I calculate the mean and standard deviation of the price coefficient itself and present the results in Table 4.6 As expected, price has a negative and significant impact on consumer utility. However, the standard deviation of the price coefficient is not significant, suggesting that there is no significant heterogeneity in consumer taste in the sample. To examine how traffic safety affects consumers’ vehicle choices, I include one subjective measure, the consumer’s own safety concerns, and one objective measure, which is actual traffic fatalities in the state where the consumer lives. I interact the two measures with the two vehicle characteristics that matter the most for traffic safety: vehicle weight and size (footprint). The coefficients for the four interaction
Parameters 𝑚 and 𝑠, which represent the mean and variance of the log of the coefficient, are estimated: 𝑙𝑜𝑔𝛽 ∽ 𝑁(𝑚, 𝑠). The mean and variance of 𝛽 are then derived from the estimates of 𝑚 and 𝑠. The mean 𝑠 is exp(𝑚 + ), and the variance is exp(2𝑚 + 𝑠) [exp(𝑠) − 1]. 6
2
12
terms suggest how traffic safety affects consumers’ preferences for vehicle weight and size. Surprisingly, the coefficients of the interaction terms of safety concern with weight and size are both insignificant, suggesting that there is no significant relationship between consumers’ subjective safety concerns and vehicle choices. In other words, consumers with a serious concern for safety do not put more emphasis on vehicle weight or size when they are making vehicle choices, compared with someone with little concern for safety. The coefficient of the interaction term of traffic fatalities with vehicle size is positive and significant. This suggests that if a consumer lives in a state with higher traffic fatalities, he tends to choose a bigger car, compared with those living in a state with low traffic fatalities. However, the interaction term of traffic fatalities with vehicle weight does not have a significant impact on consumer utility. The difference in significance provides an interesting insight into the implications of weight and size for safety. All other things being equal, occupants in a bigger and heavier vehicle are better protected than those in a smaller and lighter vehicle, but it is generally difficult to separate the effect of weight from the effect of size in the real world. In other word, it is hard to say which is more important, weight or size. Some studies have concluded that extra weight is likely a key factor in traffic safety (Highway Loss Data Institute, 2011), while other studies show that vehicle size is the better determinant of safety since larger vehicles have more crush space to absorb impacts (Van Auken and Zellner, 2003; Wenzel, 2010). Although this analysis does
13
not contribute to the debate directly, this results do suggest that, in terms of safety, consumers value vehicle size more than weight when making vehicle choices, especially those living in a state with higher traffic risks. Table 3 also presents the estimated coefficients of other vehicle characteristics. Overall, a consumer would prefer a bigger, more powerful car with higher fuel efficiency. In addition, American cars and Asian cars are more attractive to U.S. consumers, compared with European cars.
5. Post-Estimation Simulations under Footprint-based CAFE Standards The new CAFE standards are based on the footprint of individual vehicles: vehicles with larger sizes now face a lower standard, compared with smaller vehicles. On one hand, there are concerns that a fuel economy standard that discourages vehicles with smaller footprints may affect consumers’ vehicle choices and reduce casualties. On the other hand, the new CAFE standards raise the MPG requirement for all vehicles in general, which may cause many automakers to use lightweighting technology to meet the standards. Some worry that such a strategy may affect consumers’ vehicle choices, raising concerns about traffic safety. In this section, I conduct two simulations of firms’ responses to the new CAFE standards. Specifically, I discussed two extreme cases. First, I assume that all automakers, if they do not meet the standard now, will meet the MPG requirements of the new CAFE standards by lightweighting. Second, I 14
assume that automakers who do not meet the MPG requirements, rather than try to meet the CAFE standards, will simply choose to pay the fine. Note that the current simulations assume a static supply side, which means that prices of other products, attributes other than the one of interest, and product offerings would stay the same under different scenarios. In other words, I do not try to conduct a complete supply side analysis and fully characterize all industry responses.7 Instead, I analyze consumer choices under the two extreme cases and estimate the ranges of the effect on consumers and automakers. The results will provide policy makers a reference point on the impact of the effectiveness of the new CAFE standards.
5.1 Compliance with CAFE Standards Using Lightweighting In this section, I conduct simulations assuming all automakers are in compliance with the new CAFE standards, and that those who do not meet the standards now will meet the MPG requirement by lightweighting. Since vehicle weight is closely related to vehicle fuel efficiency, by reducing weights, all firms will achieve the MPG targets of the new standards. To some extent, this is a reasonable assumption, since most automakers are concentrating on lightweighting and the use of lightweight structural materials in order to achieve the new fuel economy targets (Wards Auto, 2014). In
7
Full supply side decisions, although a very interesting topic, are beyond the scope of the present study. Modelling firm responses of price, attributes, and product offering changes would require a structural dynamic game with several key factors about the auto industry: several big players that act strategically and each of them producing multiple differentiated products.
15
addition, I do not consider the change in price of vehicles associated with the use of lightweighting technology. It is possible that higher costs may occur in the lightweighting process, so there might be an increase in vehicle prices. Therefore, these results will provide an upper bound of market shares and vehicle sales changes. I first calculate the corresponding MPG target for each vehicle model given its footprint and vehicle class. 1
MPG Target = [a +
1 1 b a
( − )𝑒 (𝑓𝑜𝑜𝑡𝑝𝑟𝑖𝑛𝑡−𝑐)/𝑑) 1+𝑒 (𝑓𝑜𝑜𝑡𝑝𝑟𝑖𝑛𝑡−𝑐)/𝑑)
]−1
(5)
where a is maximum fuel economy target and b is minimum fuel economy target. c is the footprint value at which the fuel economy target is midway between a and b, d is parameter defining the rate at which the value of targets decline from the largest to smallest values, and e = 2.718. 𝑓𝑜𝑜𝑡𝑝𝑟𝑖𝑛𝑡 is the footprint of the vehicle model. The value of parameters a, b, c, and d for each target year is given by NHTSA and EPA (NHTSA and EPA, 2012). Using the above equation, I calculate the MPG requirement of CAFE standards for three years: 2012, 2017, and 2025. Figures 1 and 2 present the MPG target of CAFE standards from 2012 to 2025. These figure show that the MPG targets are increasing over time and reach a maximum in 2025, for both passengear cars and SUVs and light trucks. The MPG targets are much lower for vehicles with larger footprints and for SUVs/light trucks. Second, I compute the predicted weights of vehicles that use lightweighting to achieve the associated MPG targets. To predict the vehicle weights with new MPG, I estimate the following equation using data for all vehicle models from 1980 to 2009:
16
𝑤𝑒𝑖𝑔ℎ𝑡𝑗𝑡 = 𝛿0 + 𝛿1 𝑀𝑃𝐺𝑗𝑡 + 𝛿1 𝑆𝑖𝑧𝑒𝑗𝑡 + 𝛿2 𝐻𝑜𝑟𝑠𝑒𝑝𝑜𝑤𝑒𝑟𝑗𝑡 + 𝛿3 𝑆𝑡𝑒𝑒𝑙𝑃𝑟𝑖𝑐𝑒𝑡 + 𝛿4 𝑃𝑎𝑠𝑠𝑒𝑛𝑔𝑒𝑟𝑗 + 𝛿5 𝑆𝑈𝑉𝑗 + 𝛿6 𝑇𝑖𝑚𝑒𝑡 + 𝜐𝑗𝑡
(6)
where δs are the coefficients of the regression and 𝜐𝑗𝑡 is the stochastic error term. The estimation results are presented in Table 5. The 𝑅 2 is 0.81, which suggest very good model fitness. As expected, MPG has a negative and significant impact on vehicle weight, while a bigger size and higher horsepower will increase vehicle weight. On average, an SUV is heavier than a passenger car. The time trend is estimated to be positive and significant, implying an upward trend in vehicle weights over the past 30 years. Using the estimated coefficients from the weight regression, I calculate the new predicted weights of vehicles if they meet the targeted MPG using lightweighting. The vehicle weights remain unchanged for those models that have already met the CAFE standards. With the predicted weights, the new market shares and sales under different scenarios are solved based on the demand estimates from Section 4. Table 6 presents the effects of archiving the targeted MPGs of CAFE standards using lightweighting. The top panel gives the percentage changes in sales by vehicle class. The sales of passenger cars will be decrease by 1.6% if all automakers are in compliance with the 2012 CAFE standards. However, SUV and light trucks will gain increases in sales through compliance using lightweighting. The results are reasonable since consumers with different degrees of safety concern value vehicle size rather than weight. If a SUV or light truck can achieve a higher fuel efficiency by reducing weight without sacrificing size, it will be considered a better option and 17
contribute positively to consumers’ utility when they are making vehicle choices. As I increase the MPG targets of the CAFE standards, the trend of decreasing sales for passenger cars will continue. When I apply the 2025 CAFE standards, passenger cars will lose 7.3% of sales, while SUVs and light trucks will experience increases in sales of 5.9% and 8.4%, respectively. The bottom panel of Table 6 provides simulation results by automakers’ origin. In general, American and Asian cars will gain while European cars will lose. When applying 2025 CAFE standards, the sales of American cars will be increased by 1.8%, a result consistent with our expectations. The new CAFE standards are based on the footprint of individual vehicles: vehicles with larger sizes now face a lower standard, compared with smaller vehicles. Most American automakers specialize in large-size vehicles. As shown in Table 2, 66% of all vehicle models offered by American automakers are SUVs and light trucks. Therefore, American car manufacturers will benefit most under the new CAFE standards. Overall, the sales and profit impact of the CAFE standards will fall almost entirely on the SUV and light truck segments and US automakers. Since consumers care more about vehicle size, rather than vehicle weights, large-size American SUVs and light trucks are preferred and are enjoying increasing market shares as US automakers adopt lightweighting to reduce weight while maintaining original sizes. I further examine the impacts on vehicle sales in states with different rates of traffic fatality and provide the results in Table 7. I look at three types of states: those with fatalities lower than 806 per year, those with rates between 806 and 3090 per
18
year, and those more than 3090 fatalities per year, where 806 is the 25th percentile and 3090 is the 75th percentile of traffic fatality. In all states, there is a decline in passenger car sales and an increase in light truck and SUV sales. Further, consumers in states with more traffic fatalities and higher traffic risks are the most responsive. As the CAFE standards get tougher from 2012 to 2025, passenger car sales will drop by over 10% and the light truck sales and SUV sales will increase by 12.78% and 9.88%, respectively, in states with the highest number of traffic fatalities. One possible explanation for the change is consumers’ preference for larger vehicles due to their concerns for traffic safety.
5.2 Non-compliance with CAFE Standard and Paying Fines In this section, I consider an alternative scenario. Automakers who do not meet the CAFE standards will simply choose to pay the fine instead of investing heavily in R&D to improve fuel efficiency. In fact, this strategy is chosen by many automakers in the current car market. For example, many European automakers have been paying fines for years (NHTSA, 2014). In the past, NHTSA allowed persistent violations of CAFE standards as long as fines were paid. The current regulation requires $55 per MPG above the standard on a per vehicle basis, which effectively sets a limit on the cost of fuel-use reduction under CAFE. Using the MPG targets of CAFE standards for each vehicle model from the previous section, I recalculate the new prices for vehicles that do not meet the standard. With
19
new prices, the simulated market shares and sales under different scenarios are solved based on the demand estimates from Section 4. Table 8 presents the simulated changes in sales under alternative CAFE standards. Similar to the previous scenario, I first examine the sales changes by vehicle classes. Overall, the magnitude of impact is much smaller when firms are paying fines, compared with their use of lightweighting to meet the standards. When all manufacturers pay fines, only SUVs increase market share, while passenger cars and light truck suffer declines in sales. When applying the 2025 CAFE standards, the sales of SUVs will be pushed up by over 2.5%, while sales of passenger cars and light trucks will drop by 0.124% and 1.149%, respectively. There are a couple of possible reasons for this change. First, although many SUV models do not meet the CAFE standards and have to pay fines, which results in a higher price, they face lower standards compared with passenger cars. For example, the 2025 CAFE standard is 50 for SUV/light trucks with footprint of 41 square feet or smaller, and 30 for SUV/light truck with footprint of 75 square feet or larger. However, the 2025 CAFE standards can be as high as 60 for passenger cars. Therefore, the gap between current MPG and targeted CAFE standard could be higher for passenger cars, which will result in a larger increase in prices and thus a decline in sales. Second, for light trucks, the current MPG for light trucks is very low, with an average MPG of 17. Even with a lower CAFE target, the gap is still high, which leads to higher fines and decreasing sales. In terms of automakers, European cars will gain a slight increase in sales, while sales of American and Asian cars will drop. In the current market, the price of a
20
European car is generally higher. When manufacturers pay fines, the increase in prices for American and Asian cars makes them lose their price advantages. Therefore, some consumers may switch to European cars with a higher price but better vehicle performance. I also present the changes in sales for states with different rates of traffic fatalities. Different from the previous scenario with lightweighting, only SUV sales will be pushed up, while passenger car and light truck sales will decline. Specifically, when applying the 2025 CAFE standards in states with more traffic fatalities, the decrease in passenger car sales is 0.24%, while in a state with fewer traffic fatalities, it is 0.03%. This suggests that there are more consumers shifting away from passenger cars in states with higher traffic risk and safety concerns. Further, the decline in light truck sales is possibly due to the price increase that results from the CAFE fine. Although larger light trucks might be preferred in a state with high traffic fatalities, the large gap between current MPG and CAFE standards will lead to much higher prices and thus drive consumers away from purchases.
6. Traffic Safety Results from the previous two simulations suggest that sales of passenger cars, SUVs and light trucks will be impacted differently. In other words, the composition of sales will also be changed. Under both lightweighting and paying fines, there will be an increase in SUV sales but a drop in passenger car sales. Light truck sales, however,
21
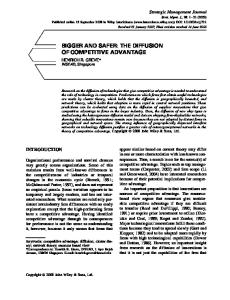
will benefit more from lightweighting and only experience a slight decline when firms choose to pay CAFE fines. Although consumers prefer large-size SUVs and light trucks for better selfprotection and safety, there have been concerns that overall traffic safety for society as whole may worsen, since SUVs and light trucks may pose a greater danger to the occupants of passenger cars in collisions (Anderson, 2008; Gayer, 2004). Therefore, when firms’ responses to the new CAFE standards have a significant impact on the composition of vehicle fleets—shares of SUVs and light trucks especially—it is worth considering the potential negative impact of the new CAFE standards on traffic safety. In this section, given the predicted changes in vehicle sales, as shown in Tables 6 and 8, I calculate new market shares of passenger cars, SUVs and light trucks, assuming that the 2025 CAFE standards take effect. I then compute the total number of equivalent fatalities in a year given the new composition of vehicles, using estimates from Li (2012). In this analysis, based on the comprehensive cost estimates of traffic accidents by the National Safety Council, 20 incapacitating injuries are converted into one fatality. Li (2012) quantifies the relationship between overall traffic safety and the fleet composition. Specifically, the total number of equivalent fatalities in a year among all users of vehicles is defined by the following equations: 𝑇𝐸𝐹 = 𝑂𝐶𝐶 (𝐸𝐹𝑐 𝑆𝑐 + 𝐸𝐹𝑡 𝑆𝑡 ) 𝐸𝐹𝑗 = (𝐷𝑗𝑐 𝑆𝑐 + 𝐷𝑗𝑡 𝑆𝑡 )𝑃𝑗𝑀𝑉 + 𝐷𝑗 𝑃𝑗𝑆𝑉 , 𝑗 = {𝑐, 𝑡}
22
(7) (8)
where OCC is the total number of occupants of vehicles, 𝑆𝑐 is the share of passenger cars, and 𝑆𝑡 is the share of SUV and light trucks. 𝐸𝐹𝑗 is the internal safety of vehicle type j. j can be a passenger car denoted by c, or an SUV or light truck denoted by t. 𝐷𝑗𝑘 is the probability of an occupant in a vehicle of type j suffering an equivalent fatality when colliding with a vehicle of type k. 𝑃𝑗𝑀𝑉 is the probability of being involved in a multiple-vehicle crash for the vehicle type j. 𝑃𝑗𝑆𝑉 is the probability of a single-vehicle crash for the vehicle type j. Li (2012) estimates all the parameters using the General Estimate System database maintained by NHTSA. Figure 3 presents the relationship between traffic safety and the market share of SUV and light trucks. The total equivalent fatality increases as the number of SUVs and light trucks on the road increases. Using Li’s (2012) estimates, I calculate the total equivalent fatalities given the new market shares of SUV and light trucks under both scenarios.
The results are
presented in Table 10. SUV and light trucks represent 50% of vehicles in the original fleet composition, accounting for 53,679 of the total equivalent fatalities. The changing pattern of market shares varies depending on specific firm responses when I simulate adoption of 2025 CAFE standards. When using lightweighting, some consumers shift away from passenger cars, resulting an increase of 3.5 percent in SUV and light trucks shares, but this will cause 152 more equivalent fatalities on road in a year. When firms choose to pay CAFE fines, the share of SUV and light trucks will only be increased slightly, by 0.6 percent, resulting in only 25 additional equivalent
23
fatalities in the U.S. in a year. Overall, the new CAFE standards will impose a negative effect on total traffic fatalities.
7. Conclusion The new Corporate Average Fuel Economy (CAFE) Standards mandate an increase in fuel economy to 54.5 miles per gallon by model year 2025, and determine fuel economy targets based on vehicle sizes, such that larger vehicle have lower MPG targets. The drastic improvement in MPG standards may push many automakers to use lightweighting as a major strategy to meet the tougher rules, which in turn will affect consumers’ vehicle choices and traffic safety. This paper examines the effects of new CAFE standards on consumer choices and composition of vehicle sales, considering the impact of traffic safety. I first formulate and estimate a mixed logit model of consumer demand using micro-level data. The demand estimation shows that if a consumer lives in a state with more traffic fatalities, vehicle size matters but weight does not. These consumers tend to choose a bigger car, compared with those living in a state with low traffic fatalities. Further, using estimates from the demand model, I conduct simulations of two extreme firm responses to assess the potential impact of the new CAFE standards: lightweighting and paying CAFE fines. SUV and light truck sales and American automakers will benefit when all firms use lightweighting to meet CAFE standards, while SUV and European automakers will benefit when all firms pay CAFE fines.
24
Moreover, consumers in states with higher traffic fatalities and higher traffic risks are the most responsive, shifting away from passenger cars when making vehicle choices. In addition, since the new CAFE standards will affect composition of sales, I calculate the total equivalent fatalities given the new shares of SUVs and light trucks under both scenarios. The simulation results suggests that the new CAFE standards could result in an increase of 3.5 percent in SUV and light trucks market shares, which will cause as many as 152 more equivalent fatalities on road in a year.
25
Reference Anderson, M. (2008). Safety for Whom? The Effect of Light Trucks on Traffic Fatalities, Journal of Health Economics, 27, 973-989 Ahmad, S. and D. L. Greene, (2005), The Effect of Fuel Economy on Automobile Safety: A Reexamination, Transportation Research Record, No. 1941, 1-7, Anderson, M. and M. Auffhammer. (2014). Pounds That Kill: The External Costs of Vehicle Weight, Review of Economic Studies, 81, 535-571.Austin, D. and T. Dinan. (2005). Clearing the Air: The Costs and Consequences of Higher CAFE Standards and Increased Gasoline Taxes, Journal of Environmental Economics and Management, 50, 562-582. Berkowitz, J. and C. Csere. (2011). The CAFE Numbers Game: Making Sense of the New Fuel-Economy Regulations, http://www.caranddriver.com/features/the-cafenumbers-game-making-sense-of-the-new-fuel-economy-regulationsfeature#jump-to-comments Crandall, R. W., and J. D. Graham. (1989). The Effect of Fuel Economy Standards on Automobile Safety. Journal of Law and Economics, 32, 97–118. Csere,
C.
(2010).
How
Automakers
Will
Meet
2016
CAFE
Standards,
http://www.caranddriver.com/features/how-automakers-will-meet-2016cafe-standards Gayer, T. (2004). The Fatality Risks of Sport-Utility Vehicles, Vans, and Pickups Relative to Cars, Journal of Risk and Uncertainty, 28, 103-133. Goldberg, P. (1998). The Effects of the Corporate Average Fuel Economy Standards in the US, The Journal of Industrial Economics, 46(1), 1-33. Hawver, M. (2015). Ford Retooling Plant for Aluminum F-150, Assembly Line Shuttering for Two Months, Tech Times, 26
http://www.techtimes.com/articles/14089/20140826/ford-retoolsproduction-plant-build-new-f150.htm Highway Loss Data Institute. (2011). Injury odds and vehicle weight comparison of hybrids and conventional counterparts. HLDI Bulletin 28(10). Jacobsen, M. (2012). Fuel Economy and Safety: The Influence of Vehicle Class and Driver Behavior, NBER Working Paper Series, WP18102. Jacobsen, M. (2013). Evaluating US Fuel Economy Standards in a Model with Producer and Household Heterogeneity, American Economic Journal: Economic Policy, 5(2): 148-187 Klier, T. and J. Linn. (2012). New-Vehicle Characteristics and the Cost of the Corporate Average Fuel Economy Standard, Rand Journal of Economics, 43(1), 186-213. Li, S. (2012). Traffic Safety and Vehicle Choice: Quantifying the Effects of the “Arms Race” on American Roads, Journal of Applied Econometrics, 27(1), 34-62. National Highway Traffic Safety Administration (NHTSA). (2014). Summary of CAFE Fines Collected, July 24, 2014. National Highway Traffic Safety Administration (NHTSA) and Environmental Protection Agency (EPA). (2012). 2017-2025 Model Year Light-Duty Vehicle GHG Emissions and CAFE Standards: Supplemental Notice of Intent O’Hara, M. (2015). What is General Motors’ Lightweighting Strategy? General Motor Global Business Conference, http://marketrealist.com/2015/10/ford-generalmotors-look-industrys-future/ P.E., (2014), The Detroit Auto Show: Enter the Lightweights, The Economist, http://www.economist.com/blogs/schumpeter/2014/01/detroit-auto-show Revelt, D. and Train, K. (1997). Mixed Logit with Repeated Choices: Households’ Choices of Appliances Efficiency Level. The Review of Economics and Statistics, 647-657.
27
Train, K.E. (1998). Recreating Demand Models with Taste Differences over People. Land Economics, 74(2), 230-39. U.S. Department of Transportation Federal Highway Administration. (2011). 2009 national
household
travel
survey
user’s
guide.
http://nhts.ornl.gov/publications.shtml Van Auken, R.M. and J.W. Zellner. (2003). “A Further Assessment of the Effects of Vehicle Weight and Size Parameters on Fatality Risk in Model Year 1985–98 Passenger Cars and 1985–97 Light Trucks.” Torrance: Dynamic Research, Inc. Wards Auto. (2014). Automakers Focus on Lightweighting to Meet CAFE Standards. 2014 CAR Management Briefing Seminars. http://wardsauto.com/vehiclestechnology/automakers-focus-lightweighting-meet-cafe-standards Wenzel, T. (2010). Analysis of the Relationship between Vehicle Weight/Size and Safety, and Implications for Federal Fuel Economy Regulation, Lawrence Berkeley National Laboratory Report, LBNL-3143E Whitefoot, K. and S. Skerlos. (2012). Design Incentives to Increase Vehicle Size Created from the U.S. Footprint-Based Fuel Economy Standards, Energy Policy, 41(2012), 402-411.
28
Table 1: Summary Statistics Price ($) Horsepower Weight (lbs) Size (sq. inch) American Car European Car Passenger Car SUV Light Truck Consumer's Safety Concern Fatality
Mean 28,732.86 220.44 3,755.76 6,800.81 0.39 0.12 0.49 0.45 0.06
Std. Dev. 15,031.83 72.36 802.26 784.65 0.49 0.33 0.50 0.50 0.24
Min 11,395 70 1,808 3,858.75 0 0 0 0 0
Max 100,075 500 5,872 9,446.10 1 1 1 1 1
2.26 1,701.43
0.71 1,075.43
0 29
3 3,104
Table 2: Summary Statistics of Vehicle Characteristics by Origin
Price Horsepower Weight MPG Size Passenger Car SUV Light Truck
American Mean Std. Err. 25,809.78 9,319.45 221.22 63.62 4,017.24 829.51 19.98 3.62 7,102.37 826.01 0.34 0.55 0.11
European Mean Std. Err. 37,025.68 19,632.29 238.41 94.75 3,560.68 729.12 21.48 5.16 6,394.88 757.06
0.47 0.50 0.31
0.74 0.26 0.00
29
0.44 0.44 0.00
Asian Mean Std. Err. 24,774.60 11,390.20 205.10 67.21 3,530.33 725.58 22.22 4.83 6,643.24 650.68 0.51 0.44 0.05
0.50 0.50 0.21
Table 3: Estimation Results from Main Model Variable
Coefficient
Std.Err.
t
Mean Price (mean of log (coefficient)) Horsepower/Weight Size MPG
-0.3341*** 0.0437*** 3.4002*** 0.1141***
0.0932 0.0066 0.7067 0.0069
3.58 6.58 4.81 16.59
Safety Concern * Weight Safety Concern * Size Fatality * Weight Fatality * Size
0.0651 -0.2487 -0.0001 0.0007 **
0.1965 0.4023 0.0002 0.0004
0.33 -0.62 -0.49 1.91
American Car European Car Passenger Car
0.1181*** -0.6721*** 0.0341
0.0488 0.1211 0.0611
2.42 -5.55 0.56
S.D. Price (S.D. of log (coefficient))
0.1076
0.1138
0.95
Table 4: Mean and Standard Deviations of Lognormal Coefficient
Mean of Price S.D. of Price
30
Coefficient
Std. Err.
-1.4048*** 0.1517
0.1296 0.1616
t -10.84 0.94
Table 5: Estimation Results from Weight Regression MPG Size Horsepower Steel Price Passenger Car SUV Year Constant No. of Observation 𝑅2
Coefficient -31.0473 *** 0.1936 *** 3.1060 *** 0.2663 -183.4196 *** 254.0745 *** 4.4525 *** -7916.8150 *** 3792 0.81
31
Std.Err. 1.7897 0.0041 0.1466 0.2304 21.3993 21.6149 1.2838 2523.1840
t -17.35 46.81 21.18 1.16 -8.57 11.75 3.47 -3.14
Table 6: Simulated Changes in Sales Using Lightweighting: By Vehicle Class and Origin
Percentage Changes in Sales 2012 Standard 2017 Standard 2025 Standard By Vehicle Class Passenger Car SUV Light Truck
-1.606% 1.424% 3.654%
-2.596% 2.034% 4.216%
-7.247% 5.892% 8.396%
By Automakers' Origins American European Asian
0.609% -1.453% 0.657%
0.527% -2.013% 0.681%
1.803% -4.483% 0.136%
Table 7: Simulated Changes in Sales Using Lightweighting: By Traffic Fatality % Change in Sales for States with Different Traffic Fatality [0,806) [806,3090) >=3090 Using 2012 Standard Passenger Car SUV Light Truck
-0.79% 0.44% 2.07%
-1.36% 1.18% 3.25%
-2.62% 2.57% 5.52%
Using 2017 Standard Passenger Car SUV Light Truck
-1.42% 0.68% 2.41%
-2.25% 1.70% 3.76%
-4.06% 3.63% 6.35%
Using 2025 Standard Passenger Car SUV Light Truck
-4.44% 2.47% 4.64%
-6.39% 5.06% 7.48%
-10.78% 9.88% 12.78%
32
Table 8: Simulated Changes in Sales When Paying Fines: By Vehicle Class and Origin Percentage Changes in Sales 2012 2017 2025 Standard Standard Standard By Vehicle Class Passenger Car SUV Light Truck
-0.408% 0.466% -0.205%
-0.177% 1.002% -0.958%
-0.124% 2.537% -1.149%
By Automakers' Origins American European Asian
-0.076% 0.187% -0.121%
-0.079% 1.131% 0.086%
0.500% 2.616% 0.255%
Table 9: Simulated Changes in Sales When Paying Fines: By Traffic Fatality Percentage Change in Sales for States with Different Traffic Fatality (%) [0,806) [806,3090) >=3090 Using 2012 Standard Passenger Car SUV Light Truck
-0.38% 0.49% -0.18%
-0.40% 0.47% -0.20%
-0.44% 0.44% -0.24%
Using 2017 Standard Passenger Car SUV Light Truck
-0.17% 1.01% -0.95%
-0.17% 1.00% -0.96%
-0.19% 0.99% -0.97%
Using 2017 Standard Passenger Car SUV Light Truck
-0.03% 2.63% -1.05%
-0.10% 2.56% -1.12%
-0.24% 2.42% -1.26%
33
Table 10. Impact of 2025 CAFE Standards on Total Traffic Fatality
Passenger Car SUV Light Truck Total Traffic Fatality
Lightweighting Original Share New Share Change 0.5022 0.4674 -0.0348 0.3537 0.3758 0.0221 0.1441 0.1567 0.0126 52,679
52,831
34
152
Paying Fines New Share Change 0.4966 -0.0056 0.3591 0.0054 0.1443 0.0002 52,704
25
Figure 1: CAFE Target Curve for Passenger Cars
Figure 2: CAFE Target Curve for SUV/Light Trucks
35
Figure 3. Traffic Safety and Fleet Composition
36