Relationship between two-dimensional and three-dimensional bone architecture in predicting the mechanical strength of the pig mandible Kyung-Hoe Huh, DDS, MSD,a Won-Jin Yi, PhD,b In-Seong Jeon, DDS, MSD, PhD,c Min-Suk Heo, DDS, MSD, PhD,d Sam-Sun Lee, DDS, MSD, PhD,d Soon-Chul Choi, DDS, MSD, PhD,e Jae-Il Lee, DDS, MSD, PhD,f Yong-Keun Lee, DDS, MSD, PhD,g Seoul, Korea SEOUL NATIONAL UNIVERSITY
Objectives. To investigate the relationship between two-dimensional (2D) and three-dimensional (3D) bone imaging parameters. Study design. Bone specimens were obtained from the mandibles of five male pigs weighing around 110 kg each. A total of 111 samples were measured two-dimensionally with using solid state digital intraoral radiography. Of these 111 samples, 43 were selected for 3D analysis and measured by microcomputed tomography. Through destructive mechanical testing, strength parameters were obtained. Results. Correlations between the 2D and 3D parameters were rare; however, both 2D and 3D parameters separately showed significant correlations with strength. Multiple linear regression analyses using both 2D and 3D parameters together showed greater predictability than those using only 2D or only 3D parameters. Conclusion. Architectural parameters in 2D and 3D independently affect trabecular strength; the combination of the two can be used to improve bone strength predictability. (Oral Surg Oral Med Oral Pathol Oral Radiol Endod 2006;101:363-373)
INTRODUCTION The evaluation of bone quality is important in diagnosing diseases associated with bone loss, such as
This work was supported by the grant from the Ministry of Commerce, Industry and Energy entitled “Development of Core-technology of medical devices for the elderly (#2004-00633)”. a Post-graduate student, Department of Oral and Maxillofacial Radiology, BK21, and Dental Research Institute, College of Dentistry, Seoul National University, Seoul, Korea. b Associate Assistant Professor, Department of Oral and Maxillofacial Radiology, BK21, and Dental Research Institute, College of Dentistry, Seoul National University, Seoul, Korea. c Part time lecturer, Department of Oral and Maxillofacial Radiology, BK21, and Dental Research Institute, College of Dentistry, Seoul National University, Seoul, Korea. d Associate Assistant Professor, Department of Oral and Maxillofacial Radiology, BK21, and Dental Research Institute, College of Dentistry, Seoul National University, Seoul, Korea. e Professor, Department of Oral and Maxillofacial Radiology, BK21, and Dental Research Institute, College of Dentistry, Seoul National University, Seoul, Korea. f Associate Professor, Department of Oral Pathology, BK21, and Dental Research Institute, College of Dentistry, Seoul National University, Seoul, Korea. g Associate Professor, Department of Dental Biomaterials Science, Intellectual Biointerface Engineering Center, BK21, and Dental Research Institute, College of Dentistry, Seoul National University, Seoul, Korea. Received for publication May 13, 2005; returned for revision June 24, 2005; accepted for publication June 28, 2005. 1079-2104/$ - see front matter © 2006 Elsevier Inc. All rights reserved. doi:10.1016/j.tripleo.2005.06.024
osteoporosis, and perhaps also for better prediction of osseointegration of dental implants. Mechanical strength has been used as an indicator of bone quality, with studies reporting that in addition to bone mass, trabecular architecture provides a useful predictor of mechanical strength.1-4 The assessment of trabecular architecture was first performed on histological sections using direct measurement of trabecular width and spacing.5,6 A method for the calculation of trabecular number and spacing was introduced based on a parallel plate model.7 Subsequently, several computerized techniques for histomorphometric analysis have been developed8-10 and applied to two-dimensional (2D) plain radiographs.11,12 All of these methods, however, only offer 2D projection information of complex three-dimensional (3D) structures. Recent advances in noninvasive imaging techniques including micro-computed tomography (CT)13,14 and high-resolution magnetic resonance imaging (MRI)15,16 have made it possible to directly assess the 3D architecture of the jaws. There have been numerous studies on the relationship between bone strength and 2D or 3D bone parameters representing bone mass and architecture. Traditional histomorphometry, based on 2D sections, has been reported to show significant correlations with 2D or 3D parameters.14,17,18 However, there is a relative dearth of published information concerning the direct relationship between 2D and 3D imaging parameters. 363
364 Huh et al. Luo et al. did investigate the relationship between plain radiographic patterns and 3D trabecular architecture through the measurement of anisotropy, and showed that the plain radiograph contains architectural information directly related to the underlying 3D structure.19 Pothuaud et al. demonstrated that the fractal dimension of 2D trabecular bone projection images is related to characteristics of 3D microarchitecture, such as porosity and connectivity.20 However, the 2D radiographs used in these studies were not actual plain radiographs but simulated from 3D data sets. Until recently, despite studies on several bone parameters related to bone strength, there was no clear understanding about the relationship between 3D and associated 2D parameters. Further, it is still unclear whether plain radiographs can be a practical alternative to 3D imaging techniques. Direct comparison of the actual 2D radiographs with the 3D techniques is required to establish their true relationship. The aims of the present report were: (1) to investigate the relationship between 2D and 3D bone parameters obtained respectively from plain radiography and CT, and (2) to determine an effective combination of bone parameters for the prediction of the trabecular bone strength. MATERIALS AND METHODS Bone specimens Mandibles were obtained from five male pigs, aged from 25 to 30 weeks and each weighing around 110 kg. The protocol for this study was approved by our institution’s ethics committee for animal use. Using a micro-cutting and grinding system, the 300 CP precision parallel-control EXAKT (Apparatebau GmbH, Norderstedt, Germany) with continuous water irrigation, the mandibles were cut parasagittally into several consecutive plates 5 mm thick in an approximately perpendicular direction to the trabeculation. The bone plates were cut to uniform width to exclude the influence of thickness on measurements of 2D bone imaging parameters. The bone plates were then cut horizontally to produce several more samples of various trabecular areas. Bone samples containing tooth roots, tooth germs, or bone defects were excluded from study. Those having a trabecular area of less than 5 mm in width were also excluded. A total of 111 bone samples were obtained and fixed immediately in 10% phosphate-buffered formalin. (Fig. 1A, B) Two-dimensional image acquisition A 4 mm-diameter circle was drawn in pencil on the trabecular area in the cutting surface of the bone specimens; a 10 mm-diameter copper ring for correct selection of the region of interest (ROI) was then placed to
OOOOE March 2006
cover the circle. Along with a copper step wedge (0.050.30 mm, 6 steps) for a standard measure of gray value, digital intraoral radiographs were made using a Heliodent DS (Siemens Corp., München, Germany) generator operated at 70 kVp, 7 mA for 0.16 s, was used in combination with a CCD x-ray detector (Jupiter CDX2000HQ, Biomedisys Corp., Seoul, Korea). All the bone specimens were projected perpendicularly to the cutting surface with a focus-to-object distance of 60 cm. The pixel size of the raw images was 44 m. For subsequent image analysis, a total of 111 images were saved in bitmap files with a gray level depth of 8 bits. Two-dimensional image analysis After the region of interest (ROI) was established (Fig 1C), all digital manipulations and analyses were performed within the ROIs using automatic image analysis macro provided by the Scion version 4.1 (Scion Corp., Frederick, Maryland, USA) image software program. Nine parameters were assessed: mean gray level, fractal dimension, trabecular area, perimeter, length of skeleton, number of termini, number of nodes, mean strut length, and node-to-terminus ratio. In the Scion image program, the gray level was set with white having a gray-scale value of 0, and black having a value of 255. After using a step wedge portion of the image to calibrate mean gray level, image processing for morphometric analysis was performed based on a partial revision of the methods described in previous studies.12 This was done by blurring the ROI using a Gaussian filter (sigma ⫽ 10 pixels, kernel size ⫽ 31 x 31) and subtracting the blurred image from the original, removing largescale variations in gray level from the radiographs. After adding a 128 gray-value to the result at each pixel location and a threshold on a gray value of 128, a binary image was obtained and subsequently an outlined and a skeletonized image produced. In the binary image, the trabecular area was defined as the total number of white pixels. In the outlined image, the perimeter was defined as the total number of pixels on the outer border of the trabeculae. The complexity of the trabecular structure was quantitatively assessed by fractal dimension, determined by applying the tile counting method with a tile size of 6-12 pixels. In the skeletonized image, the length of skeleton was defined as the total number of black pixels, the nodes as intersecting points (i.e., black pixels with three or more adjacent black pixels), the termini as free ends (i.e., black pixels with only one adjacent black pixel), and the strut length as the number of segmented linear pixels with a node or terminus on both ends.
OOOOE Volume 101, Number 3
Huh et al. 365
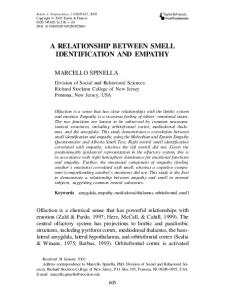
Fig. 1. A. Illustration of a pig mandible and sectioning planes. B. Example of a 5 mm-thick bone specimen. A manually drawn circle is shown in the trabecular area on the cutting surface. C. Digital intraoral radiograph of a bone specimen with a copper ring and a copper step wedge. The region of interest, an area of 100 x 100 pixels (4.4 x 4.4 mm), was established at the center of the copper ring to avoid the cortical bone.
Three-dimensional image acquisition Based on their anatomical location within the mandible, 43 bone specimens were selected from the 111 total to provide various patterns of trabeculation. They were scanned using CT (Skyscan-1072, SKYSCAN, Antwerpen, Belgium) operating at 80 kVp, 100 A, for 3400 ms with 1 mm Al filtration at a 11.51 m pixel size (magni-
fication, x23.75). The volume of interest (VOI) was 3 x 3 x 5 mm3. To match the VOI in the 3D image to the ROI established in the 2D image of the same specimen, an acrylic tap was attached to the center of the circle on the cutting surface. During acquisition, the bone specimens were kept moist in 10% phosphate buffered formalin. Three dimensional rendering of CT data were performed
366 Huh et al.
OOOOE March 2006
on a fixed threshold value of 150 to separate trabecular bone from marrow space.
SPSS for Windows (version 12.0, SPSS Inc., Chicago, USA) was used for all statistical analyses.
Three-dimensional image analysis The morphometric parameters were calculated by SkyscanTM CT-analyzer software. The five parameters used were trabecular thickness (Tb.Th), bone specific surface (BS/BV), percent bone volume (BV/TV), structure model index (SMI) and degree of anisotropy (DA). The BV/TV was defined as the proportion of the VOI occupied by binarized solid objects, indicating the amount of trabecular bone present. The BS/BV was defined as the ratio of binarized solid surface to the volume within the VOI, and is a useful basic parameter in characterizing the complexity of structures. The Tb.Th was measured with use of a model-independent method by placing spheres within the trabeculae.21 The SMI, which indicates the relative prevalence of rods and plates, was measured by a differential analysis of the triangulated surface of trabecular bone involving a measurement of surface convexity.22 An ideal plate, cylinder, and sphere have SMI values 0, 3, and 4 respectively. Isotropy, the presence or absence of preferential alignment of structures along a particular directional axis, is a measure of 3D symmetry. The DA was measured by the ratio between the maximum and minimum radii of the ellipsoid of mean intercept-length.23 Apart from the percent bone volume, the DA and the general stereology parameters of trabecular bone are probably the most important determinants of mechanical strength.24
RESULTS Relationships between 2D and 3D bone imaging parameters and punch shear strength of pig mandibles are presented in Table 1. Strength parameters showed linear relationships with several bone imaging parameters representing bone mass and architecture. Yield stress and Young’s modulus showed better correlations with bone imaging parameters than maximum stress. In 2D analysis, mean gray level, fractal dimension, trabecular area, perimeter, length of skeleton, and mean strut length showed significant correlations with more than two of the strength parameters. In 3D analysis, Tb.Th, BS/BV, BV/TV, and SMI showed significant correlations with more than two of the strength parameters. In particular, strong correlations (Pearson correlation coefficient, r ⬎ 0.5) with strength parameters were seen in the mean gray level and fractal dimension among the 2D parameters, and BV/TV and SMI among the 3D parameters (Fig. 3 & 4). Examples of digital radiographs from representative bone specimens with high and low bone strength are shown in Fig. 5. Examples of 3D reconstructions of CT data from another pair with high and low bone strength are shown in Fig. 6 which presents the architectural differences according to trabecular strength. Unexpectedly, the 2D binary images in Fig. 6 C, D did not show as remarkable architectural differences as the 3D reconstruction images in Fig. 6 A, B. This is consistent with the results showing little in the way of significant correlations between the 2D and 3D architectural parameters, while these parameters separately showed significant correlations with strength parameters (Table 1). Among the 2D parameters, only mean gray level, which represents bone mass and was measured on non-processed images, showed significant correlations with all the 3D parameters except for the DA. When using only 2D or only 3D bone parameters, no matter how many predictor variables were included, the coefficients of determination (adjusted R2) in MLRA were under 0.60. This means that, at best, only 60% of the variability of trabecular strength could be accounted for by the models. However, when both 2D and 3D bone parameters were used together as predictor variables, the MLRA showed that the variability of yield stress and Young’s modulus could be accounted for up to 100% by the models. Additionally, in the multiple linear regression model of yield stress with the four 2D and 3D bone parameters that individually showed a strong correlation with trabecular strength, the predictability was much better than those using only 2D or only 3D parameters, with BV/TV alone explaining 41% of the variance in yield stress. By stepwise inclusion of fractal dimension and
Mechanical testing After 2D and 3D image acquisition, punch shear strength analysis was performed using a materials testing machine (Instron 4465, Instron Corp., Canton, USA). The loading punch (2 mm diameter) was placed at the center of the circle drawn on the cutting surface of the specimen. The loading force was applied in the direction perpendicular to the surface at a constant strain rate of 1 mm/min. From the load-deformation curve, maximum stress, yield stress and Young’s modulus were measured (Fig. 2). Statistical analysis Relationships between strength, 2D, and 3D bone parameters were examined by linear correlation analyses. If needed, the data were log-transformed to improve normality and linearity. Multiple linear regression analyses (MLRA), using strength parameters as outcome variables and 2D and 3D bone parameters as predictor variables, were performed to determine the predictive value of each of the bone parameters. Combinations of bone parameters were then examined to determine which parameters are important predictors of the strength.
OOOOE Volume 101, Number 3
Huh et al. 367
Fig. 2. Through punch shear strength analysis (A), load-deformation data were obtained. From the load-deformation curve (B), three parameters were measured: maximum stress, yield stress and Young’s modulus.
structure model index, the variance in the yield stress was better explained up to 72% and 79% (Table 2). This stepwise-method MLRA indicates that BV/TV was the strongest predictor of strength, though a much better prediction could be obtained by the combination of an independent architectural parameter such as fractal dimension, but not by the combination of a correlated parameter such as mean gray level. In enter-method MLRA which shows the relative strength of the various predictors, fractal dimension showed the largest beta coefficient, ⫺0.680, and mean gray level showed the smallest, 0.216 (Table 3). DISCUSSION Most studies on mechanical strength and related bone imaging parameters have been performed using the spine, iliac crest, femoral head, radius, tibia, calcaneus, and recently, the mandibular condyle.25,26 Studies using the mandibular body, however, were uncommon.27,28 Through destructive mechanical testing of pig mandibles, several bone imaging parameters have been examined and verified bone mass and architecture to have a close relationship with bone strength. In the 2D images, it appeared that bone specimens with high trabecular strength were primarily characterized by high density and thick trabeculae with relatively simple architecture, while those with low trabecular strength were characterized by low density and tiny, coarse trabeculae with increasing complexity. The 3D analysis showed that high bone volume and plate-like, thick trabeculae with less complexity were related to high trabecular strength.
The present study demonstrated that there was no significant correlation, except for mean gray level, between the 2D and 3D bone parameters that individually showed a significant correlation with bone strength. This is in contrast to previous studies that report a relationship between plain radiographic patterns and 3D trabecular architecture.19,20,29 There are a large number of bone imaging parameters reflecting bone mass and architecture. Bone mass is usually measured by determining the bone mineral density (BMD) through the use of dual energy x-ray absorptiometry (DEXA)30 or quantitative computed tomography.31 In the present study, the mean gray level in 2D radiographs and the BV/TV in 3D images were used as the bone mass parameter. Several morphological parameters have been introduced to characterize bone architecture and previous studies reported in the literature have examined the relative influence of those parameters on the mechanical properties of bone.1-4,26 The present study has found correlations between 3D32 and between 2D parameters,3,33 meaning that these various parameters are not mutually independent. Thus, a change in one parameter can be explained by another. For example, an increase of BV/TV is explained by a transition from rod-like trabeculae to plate-like trabeculae.32,34 On the other hand, they may reflect the same kind of property, so redundancy in these parameters can be expected. However, the 2D and 3D architectural parameters were mutually independent in the present study, and therefore they may represent different as-
368 Huh et al.
Table I. Pearson correlation coefficients between strength and 2-dimensional and 3-dimensional bone parameters Strength parameters MS Strength parameters MS YS YM Two-dimensional Gray parameters FD TA Peri Lsk Nd Term NTR Strut Three-dimensional Tb.Th parameters BS/BV BV/TV SMI DA
1
YS
YM
Two-dimensional parameters Gray
FD
TA
Peri
Lsk
Nd
Three-dimensional parameters Term
.851** .777** ⫺.607** ⫺.455** ⫺.074 ⫺.250** ⫺.168 ⫺.078 ⫺.066 1 .896** ⫺.612** ⫺.563** ⫺.233* ⫺.377** ⫺.315** ⫺.172 ⫺.098 1 ⫺.604** ⫺.455** ⫺.325** ⫺.418** ⫺.391** ⫺.298** ⫺.195* 1 .315** .470** .328** .377** .123 ⫺.114 1
.391**
.708** .679**
1 1
.593** .830** .938** 1
.360** .537** .657** .698** 1
.174 .004 .292** .234* .716** 1
NTR
Strut
Tb.Th
⫺.007 .101 .255 ⫺.086 .292** .387* ⫺.146 .305** .349* .247** ⫺.313** ⫺.350* .240* .666** .479** .595** .438** ⫺.228* 1
⫺.468** ⫺.570** ⫺.693** ⫺.760 ⫺.524** ⫺.290** ⫺.318** 1
⫺.048 .071 ⫺.124 ⫺.125 ⫺.274 ⫺.474** .292 .387* 1
BS/BV
BV/TV
SMI
DA
⫺.222 .494** ⫺.460** ⫺.416** .647** ⫺.523** ⫺.442** .667** ⫺.641** .483** ⫺.662** .605**
⫺.266 ⫺.256 ⫺.270 .250
⫺.048 .026 .190 .187 .299 .406** ⫺.147 ⫺.330* ⫺.846**
.258 .150 .187 .195 .176 .081 .010 ⫺.236 ⫺.277
1
⫺.005 ⫺.123 ⫺.044 .253 ⫺.166 .157 ⫺.114 .208 ⫺.249 .209 ⫺.448** .112 .187 .090 .239 ⫺.258 .707** ⫺.273
⫺.835** .419** 195 1 ⫺.581** ⫺.124 1 .125 1
*Correlation is significant at the 0.05 level (2-tailed). MS: maximum stress, YS: yield stress, YM: Young’s modulus, Gray: mean gray level, FD: fractal dimension, TA: trabecular area, Peri: perimeter, Lsk: length of skeleton, Nd: number of nodes, Term: number of termini, NTR: node-to-terminus ratio, Strut: mean strut length, Tb.Th: trabecular thickness, BS/BV: bone specific surface, BV/TV: percent bone volume, SMI: structure model index, DA: degree of anisotropy. Only node-to-terminus ratio showed better normality and linearity after log-transformation. The other parameters were not log-transformed. **Correlation is significant at the 0.01 level (2-tailed).
OOOOE March 2006
OOOOE Volume 101, Number 3
Huh et al. 369
Fig. 3. Relationship between bone strength and 2D bone parameters from plain radiographs for the 111 bone specimens. Plot of yield stress versus mean gray level (A) and fractal dimension (B) shows a linear relationship, r ⫽ -0.612, and r ⫽ -0.563 respectively (p ⬍ 0.01).
Fig. 4. Relationship between bone strength and 3D bone parameters from CT for the 43 bone specimens. Plot of Young’s modulus versus percent bone volume (A) and structure model index (B) shows a linear relationship, r ⫽ 0.667, and r ⫽ -0.641 respectively (p ⬍ 0.01).
pects of structure. This could be caused by the dimensional difference, or by the various conceptually diverse techniques used to obtain the parameters. Some features of the complex 3D architecture may be lost due to superimposition and image processing. When 3D structures are projected onto a 2D plane, a lot of trabeculae and marrow spaces are superimposed through the entire thickness. The characteristic bright and dark regions that result are attributed to the relative superimposition of trabeculae and marrow spaces, and thus information on both mass and architecture may be incorporated. Through a series of image processing, the peculiar gray level differences, which are considered to correspond to the boundary between the trabeculae and marrow
spaces, can be detected, even in bright and dark regions. As a result, noises and large-scale variations in gray level are removed from the original image. The inherent bone mass information, represented mainly by gray level, is also removed in the binary image. Therefore, the 2D architectural parameters, obtained from the processed image, may reflect other aspects of structure than those reflected by the 3D parameters. Bone imaging parameters related to trabecular strength, if extracted by different methods, may not show direct relationships and may reflect different aspects of structure independently. For example, in the present study, although the fractal dimension among 2D parameters and the BS/BV among 3D parameters individually represents complexity of structure
370 Huh et al.
OOOOE March 2006
Fig. 5. Examples of digital intraoral radiographs and their image processing from bone specimens with high (A) and low (B) bone strength. From the upper left in a clockwise direction: original image in the region of interest, binary image after subtraction and thresholding, skeletonized image, and outline image, respectively.
and showed direct relationship with trabecular strength, no significant correlation was found between them. Mean gray level, which represents bone mass and was obtained from a non-processed image, showed significant correlations with all 3D parameters except for the DA. The DA did not show significant correlations with the other 3D parameters. While it was obtained from the 3D image in the same way as the other 3D parameters, use of the mean intercept length to measure anisotropy was a relatively distinctive method.23,35 If two different parameters do not show correlations, it means that they are independent to each other and will contribute separately to trabecular strength prediction, so finding out which parameters are independent is very important. In this respect, the degree of anisotropy can be a strong contributor to the prediction of trabecular strength,23,24 if it has direct relationship with trabecular strength in further studies. It should be noted that the actual 2D radiography used in the present study differed from clinical circumstances in that the influence of outer cortex, and soft tissue was excluded, due to the fact that the radiographs were taken in the mesiodistal direction, not in the buccolingual direction. The inner trabecula, junctional trabecula, and cortical housing all contribute to the trabecular striae pattern,36 indicating that 2D image analysis of such measurements as mean gray level, fractal dimension, and node-strut analysis may show different results in further in vivo studies using the mandible. The present study excluded the influence of
the cortex in mechanical testing also, verifying the relationship of trabecular strength with trabecular bone parameters. Previous reports have described the influence of voxel size or spatial resolution on the accuracy of architectural parameters.37-39 Larger voxel size may decrease accuracy due to the loss or merging of trabeculae. The resolution in the present study, however, was higher than those used as reference standards in the previous studies on the spatial resolution. We think that a resolution of 11.51 m in CT is appropriate to reconstruct accurately the trabecular microarchitecture of pig mandibles. Limitations should be recognized in the present study. First, the bone specimens were obtained from a limited number of pig mandibles with a narrow range of ages, perhaps resulting in a lack of structural variety among the specimens. Nevertheless, variations were present based on anatomic locations within mandible27,28 and a relatively large number of bone specimens were included in the present study. Second, to separate bone trabeculation from marrow space, an empirical fixed threshold value was used based on the pilot study instead of Archimedes principle.40 One of the major problems with CT is determining the threshold. The choice of threshold may influence percent bone volume (BV/TV);38-40 however, Hara et al. have found that changes in the DA due to variation
OOOOE Volume 101, Number 3
Huh et al. 371
Fig. 6. Examples of 3D reconstructions of CT data from bone specimens with high (A) and low (B) trabecular strength. Note that specimen A shows a more plate-like structure (SMI ⫽ 1.01) with a higher percent bone volume (BV/TV ⫽ 48.4%), and specimen B shows a more rod-like structure (SMI ⫽ 1.53) with a lower percent bone volume (BV/TV ⫽ 25.1%). Corresponding 2D binary images obtained from digital intraoral radiographs of the same bone specimens are shown, with (C) corresponding to (A), and (D) corresponding to (B), respectively. Note that the 2D binary images seem unable to visually demonstrate the remarkable difference between the two specimens compared to the ability of the 3D reconstructed images.
in threshold are negligible and that trabecular thickness and bone specific surface are actually not very sensitive to changes in the threshold.41 These factors can explain the relatively low correlation coefficients between bone parameters and strength in the present study. The specific anatomic site, the mandible, could also be a factor because of its vulnerability to inflammation. Therefore, the difference in the mandibular architecture according
to the location within the mandible, though it needs further studies, can be altered anytime to a variable extent. However, the data measured in the present study were statistically within the range of normal distribution and the strength parameters showed linearity with the bone parameters in correlation analysis. The MLRA could thus be performed and reveal comparable or even superior predictability than those in previous studies.
OOOOE March 2006
372 Huh et al. Table II. Stepwise-method multiple linear regression analysis using the four parameters, BV/TV, SMI, Gray and FD Model 1 2 3
Predictors
Adjusted R2
BV/TV BV/TV, FD BV/TV, FD, SMI
.405 .719 .790
Outcome variable: yield stress. BV/TV: percent bone volume, SMI: structure model index, Gray: mean gray level, FD: fractal dimension. R2: coefficient of determination. This stepwise-method multiple linear regression analysis shows that BV/TV had the strongest predictability of the strength, and a much better prediction could be obtained by the combination of the independent architectural parameter such as fractal dimension. BV/TV, FD, and SMI were included in the models, but mean gray level was removed from the models by stepping method criteria, probabilityof-F-to-enter ⱕ .050, probability-of-F-to-remove ⱖ .100.
Table III. Enter-method multiple linear regression analysis using the four parameters, BV/TV, SMI, Gray and FD Standardized coefficients Model 1
Predictors
adjusted R2 ⫽ .803
(constant) Gray FD BV/TV SMI
Beta
t
Sig.
.216 ⫺.680 .541 ⫺.423
6.682 1.895 ⫺8.432 5.549 ⫺4.371
.000 .066 .000 .000 .000
Outcome variable: yield stress. BV/TV: percent bone volume, SMI: structure model index, Gray: mean gray level, FD: fractal dimension. R2: coefficient of determination. The adjusted R2, 0.803 indicates that about 80% of the variability of yield stress is accounted for by the model. To compare the relative strength of the various predictors, the Beta coefficients are shown. FD has the largest Beta coefficient, ⫺0.680, demonstrating indirectly its independence from the other variables. Thus, a one standard deviation increase in FD leads to a 0.680 standard deviation decrease in predicted yield stress, with the other variables held constant. Gray has the smallest Beta, 0.216, and the value is statistically insignificant (p ⬎ 0.05), indirectly demonstrating its correlation with the other variables.
The compression test is the standard technique for studying the mechanical properties of trabecular bone; many reports about compressive strength have been published.2,3,25-27 Nonetheless, these measurements can be influenced by inherent errors, and the mechanical properties vary with loading orientation.24 Moreover, a complete description of anisotropic elastic properties is virtually impossible. With large-scale finite element analysis (FEA),44,45 which takes into account the geometric structure and the material properties, experimental artifacts can
be eliminated. In further studies using 3D reconstruction data, FEA will undoubtedly be helpful to better demonstrate the relationship between architecture and mechanical strength in mandibles. In conclusion, architectural parameters in 2D and 3D independently affect trabecular strength and the combination of the two can be used to improve bone strength predictability. It is recommended to obtain both 2D and 3D parameters whenever possible in further studies to improve the predictability of the study model.41-43 We thank Bong-Seon Kim, Young-Ran Lee, Yu-Jin Jung, and Ju-Hee Park, graduate students of College of Dentistry, Seoul National University, who participated in the experiment for this study. REFERENCES 1. Pothuaud L, Van Rietbergen B, Mosekilde L, Beuf O, Levitz P, Benhamou CL, et al. Combination of topological parameters and bone volume fraction better predicts the mechanical properties of trabecular bone. J Biomech 2002;35:1091-9. 2. Borah B, Dufresne TE, Chmielewski PA, Gross GJ, Prenger MC, Phipps RJ. Risedronate preserves trabecular architecture and increases bone strength in vertebra of ovariectomized minipigs as measured by three-dimensional microcomputed tomography. J Bone Miner Res 2002;17:1139-47. 3. Thomsen JS, Ebbesen EN, Mosekilde L. Relationships between static histomorphometry and bone strength measurements in human iliac crest bone biopsies. Bone 1998;22:153-63. 4. Borah B, Dufresne TE, Cockman MD, Gross GJ, Sod EW, Myers WR, et al. Evaluation of changes in trabecular bone architecture and mechanical properties of minipig vertebrae by three-dimensional magnetic resonance microimaging and finite element modeling. J Bone Miner Res. 2000;15:1786-97. 5. Wakamatsu E, Sissons HA. The cancellous bone of the iliac crest. Calcif Tissue Res 1969;4:147-61. 6. Weinstein RS, Hutson MS. Decreased trabecular width and increased trabecular spacing contribute to bone loss with aging. Bone 1987;8:137-42. 7. Parfitt AM, Mathews CH, Villanueva AR, Kleerekoper M, Frame B, Rao DS. Relationships between surface, volume, and thickness of iliac trabecular bone in aging and in osteoporosis. Implications for the microanatomic and cellular mechanisms of bone loss. J Clin Invest 1983;72:1396-409. 8. Garrahan NJ, Mellish RW, Compston JE. A new method for the two-dimensional analysis of bone structure in human iliac crest biopsies. J Microsc 1986;142:341-9. 9. Vesterby A, Gundersen HJ, Melsen F. Star volume of marrow space and trabeculae of the first lumbar vertebra: sampling efficiency and biological variation. Bone 1989;10:7-13. 10. Hahn M, Vogel M, Pompesius-Kempa M, Delling G. Trabecular bone pattern factor-a new parameter for simple quantification of bone microarchitecture. Bone 1992;13:327-30. 11. Kumasaka S, Kashima I. Initial investigation of mathematical morphology for the digital extraction of the skeletal characteristics of trabecular bone. Dentomaxillofac Radiol 1997;26:161-8. 12. White SC, Rudolph DJ. Alterations of the trabecular pattern of the jaws in patients with osteoporosis. Oral Surg Oral Med Oral Pathol Oral Radiol Endod 1999;88:628-35. 13. Ruegsegger P, Koller B, Muller R. A microtomographic system for the nondestructive evaluation of bone architecture. Calcif Tissue Int 1996;58:24-9.
OOOOE Volume 101, Number 3 14. Barou O, Valentin D, Vico L, Tirode C, Barbier A, Alexandre C, et al. High-resolution three-dimensional micro-computed tomography detects bone loss and changes in trabecular architecture early: comparison with DEXA and bone histomorphometry in a rat model of disuse osteoporosis. Invest Radiol 2002;37:40-6. 15. Majumdar S, Kothari M, Augat P, Newitt DC, Link TM, Lin JC, et al. High-resolution magnetic resonance imaging: three-dimensional trabecular bone architecture and biomechanical properties. Bone 1998;22:445-54. 16. Majumdar S. A review of magnetic resonance (MR) imaging of trabecular bone micro-architecture: contribution to the prediction of biomechanical properties and fracture prevalence. Technol Health Care 1998;6:321-7. 17. Chappard D, Guggenbuhl P, Legrand E, Basle MF, Audran M. Texture analysis of X-ray radiographs is correlated with bone histomorphometry. J Bone Miner Metab. 2005;23:24-9. 18. Cortet B, Chappard D, Boutry N, Dubois P, Cotten A, Marchandise X. Relationship between computed tomographic image analysis and histomorphometry for microarchitectural characterization of human calcaneus. Calcif Tissue Int 2004;75:23-31. 19. Luo G, Kinney JH, Kaufman JJ, Haupt D, Chiabrera A, Siffert RS. Relationship between plain radiographic patterns and threedimensional trabecular architecture in the human calcaneus. Osteoporos Int 1999;9:339-45. 20. Pothuaud L, Benhamou CL, Porion P, Lespessailles E, Harba R, Levitz P. Fractal dimension of trabecular bone projection texture is related to three-dimensional microarchitecture. J Bone Miner Res 2000;15:691-9. 21. Fajardo RJ, Muller R. Three-dimensional analysis of nonhuman primate trabecular architecture using micro-computed tomography. Am J Phys Anthropol 2001;115:327-36. 22. Hildebrand T, Ruegsegger P. Quantification of Bone Microarchitecture with the Structure Model Index. Comput Methods Biomech Biomed Engin 1997;1:15-23. 23. Goulet RW, Goldstein SA, Ciarelli MJ, Kuhn JL, Brown MB, Feldkamp LA. The relationship between the structural and orthogonal compressive properties of trabecular bone. J Biomech 1994;27:375-89. 24. Odgaard A. Three-dimensional methods for quantification of cancellous bone architecture. Bone 1997;20:315-28. 25. Teng S, Herring SW. Anatomic and directional variation in the mechanical properties of the mandibular condyle in pigs. J Dent Res 1996;75:1842-50. 26. Giesen EB, Ding M, Dalstra M, van Eijden TM. Architectural measures of the cancellous bone of the mandibular condyle identified by principal components analysis. Calcif Tissue Int 2003;73:225-31. 27. Misch CE, Qu Z, Bidez MW. Mechanical properties of trabecular bone in the human mandible: implications for dental implant treatment planning and surgical placement. J Oral Maxillofac Surg 1999;57:700-6. 28. Choel L, Last D, Duboeuf F, Seurin MJ, Lissac M, Briguet A, et al. Trabecular alveolar bone microarchitecture in the human mandible using high resolution magnetic resonance imaging. Dentomaxillofac Radiol 2004;33:177-82. 29. Majumdar S, Lin J, Link T, Millard J, Augat P, Ouyang X, et al. Fractal analysis of radiographs: assessment of trabecular bone structure and prediction of elastic modulus and strength. Med Phys 1999;26:1330-40. 30. Pouilles JM, Tremollieres F, Todorovsky N, Ribot C. Precision and sensitivity of dual-energy x-ray absorptiometry in spinal osteoporosis. J Bone Miner Res 1991;6:997-1002. 31. Rosenthal DI, Ganott MA, Wyshak G, Slovik DM, Doppelt SH,
Huh et al. 373
32.
33.
34.
35. 36.
37.
38.
39.
40. 41.
42.
43.
44.
45.
Neer RM. Quantitative computed tomography for spinal density measurement. Factors affecting precision. Invest Radiol 1985;20:306-10. Hildebrand T, Laib A, Muller R, Dequeker J, Ruegsegger P. Direct three-dimensional morphometric analysis of human cancellous bone: microstructural data from spine, femur, iliac crest, and calcaneus. J Bone Miner Res 1999;14:1167-74. Croucher PI, Garrahan NJ, Compston JE. Assessment of cancellous bone structure: comparison of strut analysis, trabecular bone pattern factor, and marrow space star volume. J Bone Miner Res 1996;11:955-61. Vogel M, Hahn M, Delling G. Relation between 2- and 3-dimensional architecture of trabecular bone in the human spine. Bone 1993;14:199-203. Whitehouse WJ. The quantitative morphology of anisotropic trabecular bone. J Microsc 1974;101:153-68. Jett S, Shrout MK, Mailhot JM, Potter BJ, Borke JL. An evaluation of the origin of trabecular bone patterns using visual and digital image analysis. Oral Surg Oral Med Oral Pathol Oral Radiol Endod 2004;98:598-604. Muller R, Koller B, Hildebrand T, Laib A, Gianolini S, Ruegsegger P. Resolution dependency of microstructural properties of cancellous bone based on three-dimensional mu-tomography. Technol Health Care 1996;4:113-9. Kothari M, Keaveny TM, Lin JC, Newitt DC, Genant HK, Majumdar S. Impact of spatial resolution on the prediction of trabecular architecture parameters. Bone 1998;22:437-43. Kim DG, Christopherson GT, Dong XN, Fyhrie DP, Yeni YN. The effect of microcomputed tomography scanning and reconstruction voxel size on the accuracy of stereological measurements in human cancellous bone. Bone 2004;35:1375-82. Ding M, Odgaard A, Hvid I. Accuracy of cancellous bone volume fraction measured by micro-CT scanning. J Biomech 1999;32:323-6. Hara T, Tanck E, Homminga J, Huiskes R. The influence of microcomputed tomography threshold variations on the assessment of structural and mechanical trabecular bone properties. Bone 2002;31:107-9. Ito M, Nakamura T, Matsumoto T, Tsurusaki K, Hayashi K. Analysis of trabecular microarchitecture of human iliac bone using microcomputed tomography in patients with hip arthrosis with or without vertebral fracture. Bone 1998;23:163-9. Ruegsegger P, Koller B, Muller R. A microtomographic system for the nondestructive evaluation of bone architecture. Calcif Tissue Int 1996;58:24-9. Van Rietbergen B, Weinans H, Huiskes R, Odgaard A. A new method to determine trabecular bone elastic properties and loading using micromechanical finite-element models. J Biomech 1995;28:69-81. Van Rietbergen B, Odgaard A, Kabel J, Huiskes R. Direct mechanics assessment of elastic symmetries and properties of trabecular bone architecture. J Biomech 1996;29:1653-7.
Reprint requests: Soon-Chul Choi, DDS, MSD, PhD Department of Oral and Maxillofacial Radiology College of Dentistry, Seoul National University 28 Yeongeon-dong, Jongno-gu, Seoul, 110-749, Korea Tel: 822-2072-3498 (business) 822-939-5757 (home) Fax: 822-744-3919
[email protected]