SECTOR UPDATE
REITs & Business Trusts
Singapore
Monday, 24 October 2011
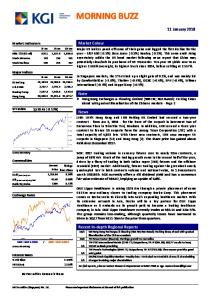
Turning bullish after the Fed rate hike Fed decision bodes well for the market... On Thursday, the Federal Open Market Committee (FOMC) hiked the fed fund rates by 25bp, putting an end to the zero interest rate policy since Dec-2008. The US equity market took this positively, with the S&P 500 closing 1.45% higher on the day. REITs oversold, rate hike concerns overblown. Since our June report ’What happens & what to do when interest rates rise’, the REIT index ‘FSTREI’ has fallen another ~12% despite the 10Y Singapore bond yield currently (2.50%) trading slightly below the June period (~2.65%). While we acknowledge that certain sub-sectors have seen decline in rents, such as office and hospitality, the selldown has been broad-based across various REITs. Figure 1: FSTE ST REIT Index vs 10Y SG Government Bond Yield 850
3.0%
830 810 790
2.8% 2.6%
770 750
2.4% FSTREI Index (LHS)
730 710 690
2.2%
10Y SG Govt Bond (RHS)
2.0%
670 650
1.8%
Source: Bloomberg
Lower long-term interest rates bode well for REITs. Unsurprisingly, FOMC has, for some time, been shading down its 2016-2017 forecasts for fed fund rate target with the first rate hike delivered only last night. However, we note that the longer-term projections for fed fund rates has also been on the downtrend, with the average FOMC member now expecting normalized long-term rates at 3.3% (Dec-14: 3.8%). Increased divergence between US/EU/HK REITs and Singapore REITs. Year on year, Singapore REITs (-8.1%) have underperformed REITs in the US (+1.8%), Europe (+22.3%) and Hong Kong (+1.1%), even after including dividends despite already offering high yields. If the comparison is done in USD, Singapore REITs underperformed more (-14.1%). Comparatively, SREITs look increasingly attractive versus overseas REITs.
Hong Wei WONG
[email protected] +65 6236 2850
Sector looking attractive after a steep decline. After a steep decline in stock prices with a more measured pace of expected rate increases, we think that the SREITs and Business Trusts under our coverage looks increasingly attractive. We like and reiterate our BUY rating on Croesus Retail Trust (TP: S$0.91), Soilbuild REIT (TP: S$0.87) and Frasers Centrepoint Trust (TP: S$2.03) for their stable cashflows and high dividend yield. We also like OUE Hospitality Trust (TP: S$0.83) as RevPAR has begun to stabilize. We upgrade Asian Pay Television Trust (TP: S$0.73) and First REIT (TP: S$1.25) from HOLD to BUY, as they have fallen below our TP. Please see important disclosures at the end of this publication
Singapore
REITs & Business Trusts
More measured pace of rate hikes going forward First rate hike accompanied by lower longer-term interest rates. FOMC publishes its projections of fed fund rates every quarter. We note that the projected level of fed funds rate has been declining after each quarterly meeting, with the average FOMC member projecting rates to rise to 1.48% at end-2016 and 2.64% at end-2017. More importantly, the average FOMC member no longer believes in a 4% neutral fed fund rate, with the longer-term fed funds projection at a mere 3.32%. Figure 2: Fed fund rate projections, each quarterly meeting from Dec-14
Projection: Target level of fed funds rate End-2016
4.25%
End-2017
Longer-term
Target level of fed funds rate
3.75%
3.25%
2.75%
Max
2.25%
Average 1.75%
Min
1.25%
0.75%
0.25%
-0.25%
Dec-14 Mar-15 Jun-15 Sep-15 Dec-15
Dec-14 Mar-15 Jun-15 Sep-15 Dec-15
Sep-14 Dec-14 Mar-15 Jun-15 Sep-15 Dec-15
FOMC Projections date Source: FOMC
Lower rates a key positive, in spite of rate hike. We acknowledge that the rate hike may result in an increase in finance expense for borrowings on floating rate. However, most REITs, including the business trusts under our coverage, have hedged or fixed a large portion of the borrowings. Conversely, lower long term rates implies that these stocks may continue to offer large yield premiums compared to government bonds, staying attractive as investments. Weakness in oil price may benefit SREITs. We also think that SREITs are beneficiaries of weaknesses in oil prices. In addition to decreasing energy and utility expenses, a secondary effect is that inflation has been lowered with lower oil price. If inflation targets are not achieved, this may prove to be a key resistance for central banks to tighten their monetary policies, providing further impetus to buy into yield stocks.
December 18, 2015
2 $ 222
Singapore
REITs & Business Trusts
Comparatively cheaper than overseas REITs. Singapore REITs have been sold down and underperformed REITs in Hong Kong, U.S. and Europe, in both local currency terms and in USD. In fact, SREITs was the only loser, while the other REIT indices recovered from their Sep-15 lows. Figure 3: REIT Index Total Returns (LCL, USD), 1Y Normalized at 100 from 17-Dec-14
Source: Bloomberg
Looking cheap on a historical basis. SREITs are trading just under 7% yield, near their 5-year highs. Offering ~4.0% yield spread over the 10Y government bond, SREITs are beginning to look cheap as they trade near the +1s.d. band. Figure 4: Yield spread of FSTE ST Reit Index over SG Government bond 8.0% 7.0% 6.0% Dividend Yield 5.0% 10Y SG Govt Bond Yield Yield Spread
4.0% 3.0%
+1 s.d.
2.0%
-1 s.d.
1.0% 0.0% 21-05-10
21-05-11
21-05-12
21-05-13
21-05-14
21-05-15
Source: Bloomberg
December 18, 2015
3 $ 333
COMPANY UPDATE
Singapore
First Real Estate Investment Trust Monday, 24 October 2011 (FIRT SP; FRET.SI )
Upgrade BUY
Update on asset swap and Kupang acquisition
Pri ce a s of 17 Dec 2015
1.180
12M ta rget pri ce (S$)
1.25
Previ ous ta rget pri ce (S$)
1.31
Ups i de, i ncl di v (%)
13.2
Trading data Ma rket Ca p (S$m)
885.0
Is s ued Sha res (m)
750.0
Ave Da i l y Tra ded (3-Month) Vol / Va l
0.6m / $0.8m
52 week l o / hi
$1.14 / $1.47
Free Fl oa t
64.8%
Major Shareholders Li ppo Ka ra wa ci Tbk PT
27.7%
PT Mena ra Ti rta Inda h
5.9%
12-Mth FIRT SP (Blue) vs. FSSTI 1.70 1.50 1.30 1.10 0.90 0.70 0.50
Oct-15
Jul-15
Apr-15
Jan-15
Oct-14
Jul-14
Jan-14
Apr-14
3,750 3,550 3,350 3,150 2,950 2,750 2,550
Source: Bloomberg
Previous Recommendations Share Price Target Price
Date
Rating
(S$)
(S$)
14-Oct-15
HOLD
1.340
1.310
20-Jul-15
HOLD
1.425
1.390
11-Jun-15
HOLD
1.415
1.390
15-Apr-15
HOLD
1.425
1.480
19-Jan-15
BUY
1.290
1.380
Hong Wei WONG
[email protected] +65 6236 2850
Swapping the existing Siloam Hospitals Surabaya (SHS). First REIT plans to divest SHS and a plot of land for min S$35.7m to Lippo Karawaci (LK). LK intends to build a mixed development, including a new SHS. First REIT will acquire the new SHS for S$90m, with progress payments to be made over ~5 years while the new SHS is constructed. 6.0% p.a. will be paid to First REIT based on the progress payments. Thereafter, the existing master lease will be terminated and a new master lease will be entered for S$8.1m p.a. Acquiring Siloam Hospitals Kupang (“SHKP”) and Lippo Plaza Kupang. First REIT will acquire both properties for S$70m from Metropolis Propertindo Utama (“MPU”). The initial base rent will be S$6.94m p.a. Acquisitions are a positive for DPU growth, however we are cautious on MPU. Both properties will be yield-accretive for First REIT, as the yield on the new SHS and Kupang acquisitions are 9.0% and 9.91% respectively. First REIT has entered an increasing number of master lease agreements with MPU. We are cautious as S&P had previously rated MPU at “CCC+”. While Siloam Hospitals is the operator, we do not find comfort in the elevated Rent to EBITDA ratio, which may pressure the master lessee’s ability to service the rents. Upgrade to BUY as share price has fallen for the wrong reasons. Following James Riady’s interest in relocating Lippo’s SREITs to Indonesia, First REIT has fallen ~10%. Our check with LK revealed that it is too premature for LK to consider any action given the ‘paucity of information and lack of detailed implementing regulations’. We also talked to First REIT CEO Dr Ronnie, who mentioned there has been no instruction from the sponsor, while Dr Ronnie has responded by buying more shares of First REIT. Barring unforeseen developments, we think that the share price has fallen for the wrong reasons. Though DPU will increase from the acquisitions, our TP is lowered to S$1.25 (from S$1.31) as our cost of equity is increased to 7.5% (from 6.95%) to factor increased exposure from MPU while gearing is expected to increase. We upgrade First REIT to BUY with 13.2% upside (incl dividends). Financials & Key Operating Statistics YE Dec (S$ m) Revenue Net Property Income Distributable Income DPU (cents) Dividend growth (%) Div Yield (%) Net asset Borrowings BVPS (Scts) NPI Margin (%) Gearing (%) Price / Book (x)
2013 83.3 80.2 52.1 7.5 n.m. 6.4 683.8 353.8 0.9 96.3 32.3 1.3
So urce: Co mpany Data, KGI Fraser
Please see important disclosures at the end of this publication
2014 93.3 91.9 58.2 8.1 7.3 6.8 745.4 396.6 1.0 98.5 33.1 1.2
2015F 100.5 99.0 62.0 8.3 2.5 7.0 764.1 397.5 1.0 98.6 32.5 1.1
2016F 110.1 108.8 67.1 8.6 4.2 7.3 830.8 427.4 1.1 98.9 32.3 1.1
2017F 111.3 110.1 68.8 8.6 -0.2 7.3 863.7 409.5 1.2 98.9 30.6 1.0
Singapore
First Real Estate Investment Trust
Figure 5: Dividend discount model DDM (SGD cents) DPU Terminal value/unit PV/unit
2016F
2017F
2018F
2019F
2020F
2021F
8.62
8.60
8.62
8.65
8.66
8.0
7.4
6.9
6.5
6.0
8.69 129.7 89.6
Model Parameter Risk free rate Beta Market risk premium
3.10% 0.80 5.50%
Cost of equity
7.50%
Terminal distribution growth rate
0.75%
Target price, S$
1.25
Source: KGI Fraser
December 18, 2015
5 $ 555
Singapore
First Real Estate Investment Trust
YE 31 Dec INCOME STATEMENT (S$m) Gross Rental Income Other operating income Gross Revenue Property operating expenses Net Property Income Finance costs Manager's management fees Trustee's fees Interest income Other trust expenses Net Income before tax and fair value changes Fair value changes Net Income before tax Income tax expense Net Income after tax Net adjustments Income available for distribution
2013 83.3 0.0 83.3 (3.1) 80.2 (12.4) (8.0) (0.3) 0.2 (1.7) 58.0 61.3 119.4 (1.5) 117.8 (65.8) 52.1
2014 93.3 0.0 93.3 (1.4) 91.9 (15.2) (9.1) (0.3) 0.2 (1.9) 65.5 47.2 112.7 (22.1) 90.6 (32.4) 58.2
2015F 100.5 0.0 100.5 (1.4) 99.0 (16.3) (9.8) (0.4) 0.3 (3.0) 69.9 1.7 71.6 (15.9) 55.7 6.3 62.0
2016F 110.1 0.0 110.1 (1.3) 108.8 (18.9) (10.6) (0.4) 0.2 (1.5) 77.7 15.3 93.0 (17.7) 75.3 (8.2) 67.1
2017F 111.3 0.0 111.3 (1.3) 110.1 (17.9) (10.8) (0.4) 0.2 (1.5) 79.7 15.3 95.0 (18.2) 76.8 (8.1) 68.8
BALANCE SHEET (S$m) Cash and cash equivalents Trade and other receivables Other current assets Current Assets Investment properties Other non-current assets Non-current Assets Total assets Borrowings (Current) Income tax payable Trade and other payables Other current liabilities Current Liabilities Deferred tax liabilities Borrowings (Non-current) Other non-current liabilities Non-current liabilities Total liabilities Net Asset
2013 29.3 24.7 2.6 56.6 1,052.3 0.5 1,052.8 1,109.4 0.0 1.5 30.0 18.3 49.8 22.0 353.8 0.0 375.8 425.6 683.8
2014 28.2 9.0 2.4 39.6 1,172.0 1.2 1,173.2 1,212.8 26.5 0.4 20.4 20.9 68.2 29.1 370.1 0.0 399.2 467.4 745.4
2015F 27.1 21.6 0.0 48.6 1,172.7 2.3 1,175.1 1,223.7 0.0 1.7 14.1 21.0 36.9 25.2 397.5 0.0 422.8 459.6 764.1
2016F 28.6 23.4 0.0 52.0 1,270.0 2.3 1,272.4 1,324.3 0.0 1.9 14.1 22.8 38.8 27.4 427.4 0.0 454.8 493.6 830.8
2017F 28.6 23.6 0.0 52.2 1,285.3 2.3 1,287.6 1,339.8 0.0 1.9 14.1 23.0 39.0 27.6 409.5 0.0 437.1 476.1 863.7
CASH FLOW STATEMENT (S$m) Net income before tax Finance costs Management fees paid in Units Interest Income Fair value change in investment properties Change in working capital Change in other current assets Cash flows from operating activities Cash flows from investing activities Net proceeds from issuance of Units Proceeds from borrowings Repayment of borrowings Net interest paid Payment of debt upfront fee Payment of distribution to Unitholders Change in other financing activities Cash generated from financing activities Net increase in cash & cash equivalents Beginning Cash Ending Cash
2013 119.4 12.4 5.9 (0.2) (60.7) (0.7) (12.9) 63.2 (141.7) 0.0 140.6 0.0 (10.5) 0.0 (42.8) 0.0 87.3 8.8 20.5 29.3
2014 112.7 15.2 6.7 (0.2) (46.4) 8.9 (16.2) 80.8 (67.5) 0.0 56.3 (17.0) (13.8) 0.0 (39.8) 0.0 (14.4) (1.1) 29.3 28.2
2015F 71.6 16.3 6.5 (0.3) (0.3) (14.9) (10.6) 68.3 (0.2) 0.0 0.0 (8.1) (14.7) 0.0 (46.5) 0.0 (69.2) (1.1) 28.2 27.1
2016F 93.0 18.9 6.9 (0.2) (15.3) 0.1 (17.7) 85.7 (47.1) 0.0 82.0 (52.1) (18.3) 0.0 (48.6) 0.0 (37.0) 1.5 27.1 28.6
2017F 95.0 17.9 7.0 (0.2) (15.3) 0.0 (18.2) 86.3 0.0 0.0 0.0 (17.9) (17.8) 0.0 (50.6) 0.0 (86.3) (0.0) 28.6 28.6
December 18, 2015
6 $ 666
COMPANY UPDATE
Singapore
Asian Pay Television TrustMonday, 24 October 2011 (APTT SP; ASIA.SI )
Upgrade BUY Pri ce a s of 17 Dec 2015
0.640
12M ta rget pri ce (S$)
0.73
Previ ous ta rget pri ce (S$)
0.73
Ups i de, i ncl di v (%)
27.0
Trading data Ma rket Ca p (S$m)
919.6
Is s ued Sha res (m)
1,436.8
Ave Da i l y Tra ded (3-Month) Vol / Va l
3.0m / $2.2m
52 week l o / hi
$0.61 / $0.94
Free Fl oa t
99.9%
Major Shareholders Venezi o Inves tments
7.9%
Morga n Sta nl ey
5.4%
12-Mth APTT SP (Blue) vs. FSSTI 1.50 1.30 1.10 0.90 0.70 0.50 0.30 0.10
3,900 3,400 2,900
Oct-15
Jul-15
Apr-15
Jan-15
Oct-14
Jul-14
Jan-14
Apr-14
2,400
Source: Bloomberg
Previous Recommendations Date
Rating
6-Nov-15 4-Aug-15
Share Price Target Price (S$)
(S$)
HOLD
0.795
0.730
HOLD
0.830
0.820
11-Jun-15
HOLD
0.885
0.820
12-May-15
HOLD
0.900
0.890
17-Mar-15
SELL
0.930
0.750
Hong Wei WONG
[email protected] +65 6236 2850
Value emerging from recent selldown Underperforming the market with lack of company specific newsflows. APTT has fallen 18.5% month on month, significantly underperforming the STI which fell 2.0%. Other than a query by SGX, which revealed that a 3rd party had made an unsolicited approach for the ownership of the trusteemanager, we saw no other significant newsflows. We explore the possibility of a dividend cut, as we think it is unusual for the market to ignore a stock trading at >10% dividend yield, if the dividend were sustainable. Establishing a sustainable level of dividend. Having taken a contrarian call to initiate a sell, our main thesis was that the dividend payout was higher than the cash flow generation. We do not draw conclusions from FY16F’s FCF as APTT may still incur expansionary capex in Taichung. Still, our forecasted free cash flows of S$126.0m for FY17 is insufficient to fund both the S$118.5m dividend and the projected S$48.5m interest payments. This implies that S$77.5m (5.39c / share) is the sustainable level of dividend. If this is so, the market may be anticipating a cut in dividends. Capex is key to driving free cash flow. While management has guided for ~S$20m maintenance capex, we note that total capex has remained elevated to date, with 9M15 YTD cashflow from investing already -S$58.0m and exceeding our capex projections of S$46m-S$48m p.a. over FY17FFY19F. As such, we think that capex requirements will be the main variable in driving free cash flows. On the other hand, we do not see large changes in operating cashflows over FY17F-FY19F as we no longer assume significant user growth in Greater Taichung due to the delay. Upgrade to BUY as share price has fallen below our TP. At our projected 5.39c/share sustainable level of dividend, this implies APTT trades at 8.4% yield. We think this is attractive given that APTT enjoys recurring revenues from Cable TV and broadband. We upgrade APTT from HOLD to BUY, as we see 13.5% upside with TP of S$0.730, even without factoring distributions. The key downside risk would be higher than expected capex, though we also acknowledge upside risks if APTT expands significantly in Greater Taichung. Financials & Key Operating Statistics YE Dec (S$ m) Revenue Operating Profit Profit after tax EBITDA FCF Borrowings EBITDA margin (%) Interest Cost EBITDA / Interest Cost (x)
2013* 185.0 87.9 45.3 111.4 22.6 949.3 60.2 25.2 4.4
2014 318.7 141.9 114.7 195.2 79.4 1053.3 61.3 44.1 4.4
So urce: Co mpany Data, KGI Fraser *Figures are fo r 30 A pr 2013 (date o f A P TT co nstitutio n) to 31Dec 2013
Please see important disclosures at the end of this publication
2015F 328.7 142.9 48.3 198.1 78.2 1159.6 60.3 74.8 2.6
2016F 329.4 144.2 76.1 201.6 109.7 1198.1 61.2 52.6 3.8
2017F 330.3 145.0 75.6 202.0 126.0 1221.4 61.2 53.8 3.8
Singapore
Asian Pay Television Trust
Figure 6: Discounted cash flow model DCF (S$ mil)
2016F
2017F
2018F
2019F
EBIT * (1-tax rate) Depreciation & Amortization
115.4 57.4
116.0 57.0
120.6 54.3
125.0 52.4
-0.7
-0.6
-0.6
-0.6
Change in working capital Capex
-62.4
-46.5
-47.1
-47.9
Free cash flows
109.7
126.0
127.2
129.0
Terminal value of free cash flow Discounted cash flow Model Parameter
0.0
0.0
0.0
2255.1
102.7
110.5
104.5
1834.1
Model Parameter (S$)
Risk free rate Beta Country risk premium
3.10% 1.05 0.90%
Enterprise value Net debt Equity value
2,152m 1,108m 1,044m
Market risk premium
5.50%
Shares outstanding
1,437m
Cost of equity
9.82%
Cost of debt
4.0%
Tax rate
20%
After tax cost of debt
3.2%
WACC
6.79%
Target price, S$
0.73
Source: KGI Fraser
December 18, 2015
8 $ 888
Singapore
Asian Pay Television Trust
Summary of Financials YE 31 Dec INCOME STATEMENT (S$ 000) Basic Cable TV Premium Digital Cable TV Broadband Gross Revenue Broadband, production costs and staff costs Depreciation and amortization expenses Trustee-manager fee Other operating costs Operating profit Interest and other finance costs Profit before income tax Income tax (expense) benefit Profit after income tax
2013 147,641 7,861 29,538 185,040 -51,612 -25,350 -4,162 -16,013 87,903 -25237 62,666 -17,343 45,323
2014 255,774 13,793 49,163 318,730 -87,076 -48,737 -7,167 -33,859 141,891 -44,090 97,801 16,860 114,661
2015F 261,024 15,093 52,627 328,744 -91,444 -46,108 -7,268 -41,053 142,871 -74,778 68,093 -19,780 48,313
2016F 257,426 15,625 56,344 329,395 -89,675 -57,379 -7,594 -30,515 144,233 -52,555 91,679 -15,585 76,093
2017F 257,044 16,660 56,556 330,260 -89,896 -57,017 -7,784 -30,595 144,969 -53,841 91,128 -15,492 75,637
2018F 257,664 17,701 59,328 334,693 -90,648 -54,271 -7,978 -31,005 150,790 -54,880 95,910 -16,305 79,605
2019F 259,294 18,748 62,098 340,140 -91,717 -52,445 -8,178 -31,510 156,290 -69,921 86,369 -14,683 71,686
BALANCE SHEET (S$ 000) Cash and cash equivalents Trade and other receivables Other current assets Current Assets Property, plant and equipment Intangible assets (License & goodwill) Other non-current assets Non-current Assets Total assets Borrowings (Current) Trade and other payables Income tax payable Other current-liabilities Current Liabilities Borrowings (Non-current) Deferred tax liabilities Retirement benefit obligation Other non-current liabilities Non-current liabilities Total liabilities Net Asset
2013 96,228 11,483 1,223 108,934 149,512 2,238,188 9,010 2,396,710 2,505,644 6,120 19,116 138,721 53,080 217,037 943,148 6,351 10,439 7,611 967,549 1,184,586 1,321,058
2014 74,490 11,538 2,121 88,149 175,749 2,223,424 1,836 2,401,009 2,489,158 17,460 20,005 10,609 55,657 103,731 1,035,877 53,808 11,320 8,595 1,109,600 1,213,331 1,275,827
2015F 55,590 16,720 1,792 74,101 190,955 2,286,808 1,817 2,479,580 2,553,682 0 21,776 5,240 61,349 88,365 1,159,622 50,970 11,692 18,309 1,240,594 1,328,958 1,224,724
2016F 51,134 16,802 1,792 69,728 195,931 2,286,808 1,817 2,484,556 2,554,283 0 21,682 5,240 61,349 88,271 1,198,114 50,970 12,313 18,309 1,279,707 1,367,977 1,186,306
2017F 46,794 16,845 1,792 65,432 185,390 2,286,808 1,817 2,474,015 2,539,446 0 21,734 5,240 61,349 88,323 1,221,352 50,970 12,911 18,309 1,303,542 1,391,865 1,147,582
2018F 43,387 17,121 1,792 62,300 178,219 2,286,808 1,817 2,466,844 2,529,144 0 21,945 5,240 61,349 88,534 1,244,902 50,970 13,697 18,309 1,327,878 1,416,412 1,112,732
2019F 31,335 17,399 1,792 50,525 173,639 2,286,808 1,817 2,462,264 2,512,790 0 22,159 5,240 61,349 88,748 1,268,835 50,970 14,502 18,309 1,352,616 1,441,364 1,071,426
CASH FLOW STATEMENT (S$ 000) Net income before tax Depreciation and amortization Finance costs Unrealised forex losses (gain) Income tax expense Change in working capital Change in other assets & liabilities Income tax paid Cash flows from operating activities Cash flows from investing activities Net proceeds from issuance of Units Net proceeds from borrowings Net interest paid Payment of distribution to Unitholders Change in other financing activities Cash generated from financing activities
2013 45,323 25,350 25,237 -2034 17,343 2,092 -31,260 -2,347 79,704 -713,979 1,017,252 -137,190 -22,452 -68966 -58,141 730,503
2014 114,660 48,737 44,090 2,572 -16,860 700 -770 -55,299 137,830 -82,813 0 110,259 -40,146 -147,272 404 -76,755
2015F 48,313 46,108 49,928 2,772 19,780 -3,178 18,362 -29,547 152,538 -70,582 0 57,869 -39,321 -116,812 -2,593 -100,857
2016F 76,093 57,379 52,555 0 15,585 -738 0 -15,585 185,289 -62,354 0 38,492 -47,346 -118,536 0 -127,390
2017F 75,637 57,017 53,841 0 15,492 -555 0 -15,492 185,939 -46,476 0 23,238 -48,505 -118,536 0 -143,803
2018F 79,605 54,271 54,880 0 16,305 -636 0 -16,305 188,120 -47,100 0 23,550 -49,442 -118,536 0 -144,428
2019F 71,686 52,445 69,921 0 14,683 -644 0 -14,683 193,408 -47,866 0 23,933 -62,992 -118,536 0 -157,594
Net increase in cash & cash equivalents
96,228
-21,738
-18,900
-4,456
-4,340
-3,407
-12,052
Beginning Cash Ending Cash
0 96,228
96,228 74,490
74,490 55,590
55,590 51,134
51,134 46,794
46,794 43,387
43,387 31,335
December 18, 2015
9 $ 999
Singapore
REITs & Business Trusts
Appendix: SREIT Peer Comparison Last Price
Market Cap
(S$)
(S$ m)
Office
Distribution Frequency
Cons/AMF DPU (cents)
Yield (%)
Current Current Next FY Next FY FY FY
S$13,167
Leverage ratio (%)
Price-tobook (x)
6.8
7.0
30.5
0.74
CapitaLand Commercial Trust Ltd
1.345
3,972
Semi-Anl
8.7
9.0
6.5
6.7
19.0
0.77
Frasers Commercial Trust
1.270
999
Quarter
9.9
10.2
7.8
8.0
36.0
0.82
Keppel REIT
0.930
2,991
Quarter
7.0
6.6
7.5
7.1
36.4
0.67
Suntec Real Estate Investment Trust
1.560
3,933
Quarter
9.8
10.0
6.3
6.4
34.7
0.75
OUE Commercial Real Estate Investment
0.665
855
Semi-Anl
4.7
5.1
7.1
7.7
37.7
NM
IREIT Global
0.680
417
Semi-Anl
5.2
6.5
7.7
9.5
NM
NM
6.5
6.7
32.1
0.96
Retail
S$19,931
CapitaLand Retail China Trust
1.480
1,248
Semi-Anl
10.9
10.9
7.4
7.4
28.5
0.87
CapitaLand Mall Trust
1.930
6,834
Quarter
11.0
11.7
5.7
6.1
32.1
1.04
Frasers Centrepoint Trust
1.830
1,678
Quarter
11.5
11.5
6.3
6.3
28.2
0.96
Lippo Malls Indonesia Retail Trust
0.305
853
Quarter
3.1
3.1
10.2
10.2
31.0
0.82
Mapletree Commercial Trust 1.305 Mapletree Greater China Commercial Trust 0.915
2,768 2,515
Quarter Semi-Anl
8.1 7.2
8.3 7.4
6.2 7.9
6.4 8.1
36.3 36.2
1.05 0.77
SPH REIT
0.955
2,420
Quarter
5.6
5.7
5.9
6.0
25.5
1.01
Starhill Global REIT
0.740
1,614
Quarter
5.3
5.5
7.2
7.4
35.4
0.83
Healthcare
6.3
6.0
34.1
1.27
First Real Estate Investment Trust
1.180
S$2,258 885
Quarter
8.3
8.3
7.1
7.0
32.7
1.16
Parkway Life Real Estate Investment Trust
2.270
1,373
Quarter
13.0
12.3
5.7
5.4
35.0
1.34
7.8
7.9
34.3
0.81
Hospitality
S$5,972
Ascott Residence Trust Ascendas Hospitality Trust
1.165 0.665
1,804 743
Semi-Anl Semi-Anl
8.4 5.6
8.7 5.7
7.2 8.4
7.5 8.6
37.6 37.5
0.84 0.92
OUE Hospitality Trust
0.750
1,002
Quarter
6.5
6.3
8.7
8.3
32.5
0.83
Far East Hospitality Trust
0.640
1,145
Quarter
4.8
4.6
7.5
7.2
31.3
0.66
CDL Hospitality Trusts
1.295
1,278
Semi-Anl
10.3
10.6
8.0
8.2
31.6
0.81
7.4
7.7
33.4
1.02
Industrial
S$15,808
AIMS AMP Capital Industrial REIT
1.350
857
Quarter
11.7
11.7
8.7
8.7
31.1
0.89
Ascendas Real Estate Investment Trust
2.250
5,426
Semi-Anl
15.3
16.1
6.8
7.2
33.4
1.07
Cache Logistics Trust Cambridge Industrial Trust Mapletree Industrial Trust
0.890 0.580 1.550
794 753 2,767
Quarter Quarter Quarter
8.1 5.0 10.9
8.7 5.0 11.0
9.1 8.6 7.0
9.8 8.6 7.1
30.7 34.4 30.6
0.92 0.86 1.17
Mapletree Logistics Trust Sabana Shari'ah Compliant Industrial Real Estate Investment Trust Soilbuild Business Space REIT
1.015
2,521
Quarter
7.6
7.7
7.5
7.6
34.1
1.00
0.710 0.725
520 677
Quarter Quarter
7.0 6.3
7.1 6.5
9.9 8.6
10.0 8.9
37.4 35.0
0.67 0.91
Keppel DC REIT Viva Industrial Trust
1.005 0.705
887 607
Irreg Quarter
6.1 N.A
6.8 N.A
6.1 N.A
6.8 N.A
NM 43.7
NM 0.9
6.9
7.0
31.6
0.89
31 S-REITs MASB10Y Index
S$57,137 Monetary Authority of Singapore
2.5 Source: Bloomberg LLP, KGI Fraser
December 18, 2015
10 $ 101010
REITs & Business Trusts
KGI’s Ratings
Disclaimer
Singapore
Rating
Definition KGI Fraser Research’s recommendations are based on a Total Return rating system.
BUY
>10% total return over the next 12 months
HOLD
-10% to +10% total return over the next 12 months
SELL
<-10% total return over the next 12 months
This report is provided for information only and is not an offer or a solicitation to deal in securities or to enter into any legal relations, nor an advice or a recommendation with respect to such securities. This report is prepared for general circulation. It does not have regard to the specific investment objectives, financial situation and the particular needs of any recipient hereof. You should independently evaluate particular investments and consult an independent financial adviser before dealing in any securities mentioned in this report. This report is confidential. This report may not be published, circulated, reproduced or distributed and/or redistributed in whole or in part by any recipient of this report to any other person without the prior written consent of KGI Fraser. This report is not intended for distribution and/or redistribution, publication to or use by any person in any jurisdiction outside Singapore or any other jurisdiction as KGI Fraser may determine in its absolute discretion, where the distribution, publication or use of this report would be contrary to applicable law or would subject KGI Fraser and its connected persons (as defined in the Financial Advisers Act, Chapter 110 of Singapore) to any registration, licensing or other requirements within such jurisdiction. The information or views in the report (“Information”) has been obtained or derived from sources believed by KGI Fraser to be reliable. However, KGI Fraser makes no representation as to the accuracy or completeness of such sources or the Information and KGI Fraser accepts no liability whatsoever for any loss or damage arising from the use of or reliance on the Information. KGI Fraser and its connected persons may have issued other reports expressing views different from the Information and all views expressed in all reports of KGI Fraser and its connected persons are subject to change without notice. KGI Fraser reserves the right to act upon or use the Information at any time, including before its publication herein. Except as otherwise indicated below, (1) KGI Fraser, its connected persons and its officers, employees and representatives may, to the extent permitted by law, transact with, perform or provide broking, underwriting, corporate finance-related or other services for or solicit business from, the subject corporation(s) referred to in this report; (2) KGI Fraser, its connected persons and its officers, employees and representatives may also, to the extent permitted by law, transact with, perform or provide broking or other services for or solicit business from, other persons in respect of dealings in the securities referred to in this report or other investments related thereto; and (3) the officers, employees and representatives of KGI Fraser may also serve on the board of directors or in trustee positions with the subject corporation(s) referred to in this report. (All of the foregoing is hereafter referred to as the “Subject Business”.) However, as of the date of this report, neither KGI Fraser nor its representative(s) who produced this report (each a “research analyst”), has any proprietary position or material interest in, and KGI Fraser does not make any market in, the securities which are recommended in this report. Each research analyst of KGI Fraser who produced this report hereby certifies that (1) the views expressed in this report accurately reflect his/her personal views about all of the subject corporation(s) and securities in this report; (2) the report was produced independently by him/her; (3) he/she does not carry out, whether for himself/herself or on behalf of KGI Fraser or any other person, any of the Subject Business involving any of the subject corporation(s) or securities referred to in this report; and (4) he/she has not received and will not receive any compensation that is directly or indirectly related or linked to the recommendations or views expressed in this report or to any sales, trading, dealing or corporate finance advisory services or transaction in respect of the securities in this report. However, the compensation received by each such research analyst is based upon various factors, including KGI Fraser’s total revenues, a portion of which are generated from KGI Fraser’s business of dealing in securities. Copyright 2015. KGI Fraser Securities Pte. Ltd. All rights reserved.
December 18, 2015
$