J Am Soc Nephrol 13: 1350–1357, 2002
Refining Predictive Models in Critically Ill Patients with Acute Renal Failure RAVINDRA L. MEHTA,* MARIA T. PASCUAL,* CARMENCITA G. GRUTA,* SHUNPING ZHUANG,* GLENN M. CHERTOW,† for the PICARD Study Group† *Division of Nephrology, University of California, San Diego Medical Center, San Diego, California; † Divisions of Nephrology, Moffitt-Long Hospitals and UCSF-Mt. Zion Medical Center, University of California, San Francisco, California; and ‡Project to Improve Care in Acute Renal Disease (PICARD) Study Group includes the University of California, San Diego, San Diego, California; University of California, San Francisco, San Francisco, California; Cleveland Clinic Foundation, Cleveland, Ohio; Vanderbilt University, Nashville, Tennessee; and Maine Medical Center, Portland, Maine.
Abstract. Mortality rates in acute renal failure remain extremely high, and risk-adjustment tools are needed for quality improvement initiatives and design (stratification) and analysis of clinical trials. A total of 605 patients with acute renal failure in the intensive care unit during 1989-1995 were evaluated, and demographic, historical, laboratory, and physiologic variables were linked with in-hospital death rates using multivariable logistic regression. Three hundred and fourteen (51.9%) patients died in-hospital. The following variables were significantly associated with in-hospital death: age (odds ratio [OR], 1.02 per yr), male gender (OR, 2.36), respiratory (OR, 2.62), liver (OR, 3.06), and
hematologic failure (OR, 3.40), creatinine (OR, 0.71 per mg/dl), blood urea nitrogen (OR, 1.02 per mg/dl), log urine output (OR, 0.64 per log ml/d), and heart rate (OR, 1.01 per beat/min). The area under the receiver operating characteristic curve was 0.83, indicating good model discrimination. The model was superior in all performance metrics to six generic and four acute renal failurespecific predictive models. A disease-specific severity of illness equation was developed using routinely available and specific clinical variables. Cross-validation of the model and additional bedside experience will be needed before it can be effectively applied across centers, particularly in the context of clinical trials.
Acute renal failure (ARF) in critically ill patients is associated with a distressingly high mortality rate (1–3). Despite improvements in intensive care and dialytic technology, particularly with continuous renal replacement therapies, we have not observed meaningful improvements in patient survival over the past three decades (4 – 8). In most series, more than 50% of patients with hospital-acquired ARF die before hospital discharge; of those who survive, between 10 and 33% require long-term dialysis (9 –11). Over the past decade, several clinical trials have been conducted, aiming to reduce ARF-associated mortality (12–14). Most of these studies have unfortunately proved unsuccessful, including relatively large, well-designed trials using pharmacologic agents with strong preclinical data (e.g., atrial natriuretic peptide [ANP]). Among the difficulties in design and analysis of clinical trials in ARF are the lack of a standardized definition of ARF, the heterogeneity of ARF, comorbidity and severity of illness directly influencing mortality, and large variations in the process of care.
Generic severity-of-illness scoring systems (e.g., Acute Physiology and Chronic Health Evaluation-II [APACHE II], Simplified Acute Physiology Score [SAPS], and Logistic Organ Dysfunction Score [LODS]) have not discriminated well in most published studies of ARF (15–18). Although several authors have proposed disease-specific indices, most have been derived at single centers (19 –22), and few have been validated outside of their original institution (23–24). Moreover, the timing of evaluation (e.g., consultation, initial dialysis procedure) and the population to which the index was applied (e.g., all patients with ARF, only dialyzed patients, etc.) have differed across studies. To prepare for future clinical trials in ARF, it is essential that valid, generalizable models for risk adjustment be developed, both for stratification in patient selection and for covariate adjustment in the event of imbalanced randomization. We evaluated 851 consecutive cases of ARF in the intensive care unit (ICU) at four university-affiliated hospitals during 1989 through 1995 (1). Among these 851, 166 patients were entered into a randomized clinical trial comparing intermittent hemodialysis (IHD) with continuous renal replacement therapy (CRRT), the results of which are reported elsewhere (25). Incorporating all patients who were followed over the study period, we accumulated a vast array of demographic, clinical, and laboratory data from which a severity of illness index could be developed. We also prospectively collected a series of previously published generic and disease-specific severity of illness scores (vide infra) to compare and contrast them with
Received November 19, 2001. Accepted February 10, 2002. Correspondence to: Dr. Ravindra L Mehta, Division of Nephrology, University of California San Diego, 200 W Arbor Drive, 8342, San Diego, CA 92103. Phone: 619-543-7310; Fax: 619-543-7420; E-mail:
[email protected] 1046-6673/1305-1350 Journal of the American Society of Nephrology Copyright © 2002 by the American Society of Nephrology DOI: 10.1097/01.ASN.0000014692.19351.52
J Am Soc Nephrol 13: 1350–1357, 2002
our own model. Ultimately, our primary goal was to develop a model that would be valid and generalizable across populations with ARF in the ICU, which could later be cross-validated and refined by using data from other clinical sites.
Materials and Methods Study Cohort Patients were those who received a nephrology consultation for ARF while in the ICU or who later transferred to the ICU with ARF at four hospitals in Southern California between October 1989 and September 1995. Acute renal failure was defined by using standard laboratory parameters. For patients with no prior history of kidney disease or known laboratory values, acute renal failure was defined either by a blood urea nitrogen (BUN) ⱖ40 mg/dl or a serum creatinine ⱖ2.0 mg/dl. For patients with preexisting renal insufficiency (CRI), acute renal failure was defined by a sustained rise in serum creatinine of ⱖ1 mg/dl compared with baseline. Exclusion criteria included previous dialysis, kidney transplantation, urinary tract obstruction, and hypovolemia responsive to fluids. Informed consent was obtained from all study participants or their next-of-kin. A total of 851 ARF cases were initially evaluated. No information on vital status was available in 31 (3.6%). Of the 820 remaining, data sufficient to calculate the generic (APACHE II [26], APACHE III [27], SAPS II [28], LODS [29], Multiple Organ Dysfunction [MOD] [30], Brussels [31], Sequential Organ Failure Assessment [SOFA] [32]) and diseasespecific (see Appendix; Lian˜ o et al. [10], Schaefer et al. [19], ANP Study [24], Lohr et al. [20], and Steuvenberg Hospital Acute Renal Failure [SHARF] [22]) severity of illness scores were available in 605 patients (73.7%), which comprised the analytic sample. Of the 605 patients, 262 (43.3%) were at University of California San Diego Medical Center, 167 (27.6%) were at the San Diego Veterans Affairs Medical Center, 104 (17.2%) were at the Navy Hospital, and 72 (11.9%) at University of California Irvine Medical Center. Baseline vital signs, hemodynamic, and laboratory data were recorded for the first ICU day and each day from the time of nephrology consultation. For this study, variables collected on the
Predictive Models of Acute Renal Failure
1351
day of nephrology consultation were used to compute the severity of illness scores.
Statistical Analyses We used conventional parametric statistics for the primary data analyses. Continuous variables were described as mean ⫾ SD, and categorical variables were described as proportions. Logistic regression was the primary analytic method employed. Odds ratios (OR) and 95% confidence intervals (95% CI) were derived from model parameter coefficients and standard errors, respectively. Multivariable analyses using backward variable selection (model acceptance criterion, P ⬍ 0.05) were conducted to simultaneously adjust for confounding variables. Proportional hazards (Cox) regression was also applied, censoring patients 60 d after their initial consultation, to determine the hazard ratio (equivalent to a relative risk [RR]), associated with the same candidate variables. For the Cox models, plots of log (⫺log [survival rate]) against log (survival time) were performed to establish the validity of the proportionality assumption (33). Our model-building strategy proceeded as follows. Explanatory variables (including those describing organ system failure; Table 1) were carefully defined using conventional published criteria (34). Variables collected at time of consultation were examined individually to evaluate whether there was a trend between the variable at issue and in-hospital mortality (P ⬍ 0.20). Variables that demonstrated a trend with mortality were placed into one of four main categories: demographic, historical, laboratory, or physiologic. These clusters prevented the inclusion of closely related variables (e.g., total bilirubin, liver failure) in the early modelbuilding process. Variables that continued to show a trend with mortality within cluster (P ⬍ 0.10) were considered candidates for a larger multivariable model including variables from within all clusters. Missing variables were handled in the following manner. For demographic and historical variables, missing data were considered to be absent. Although imputation to “absent” would tend to lessen the strength of the association between explanatory variable and outcome, the effect of this assumption was tested by
Table 1. Criteria for organ failurea Cardiovascular
Neurologic Renal
Hematologic Respiratory Hepatic
Heart rate ⱕ54/min, mean arterial blood pressure ⱕ49 mmHg, occurrence of ventricular tachycardia and/or ventricular fibrillation or other cardiac arrhythmias requiring continuous infusion of antiarrhythmic drugs, requirement for temporary pacemaker, intra-aortic balloon pump or ventricular assist device. Glasgow Coma Score (GCS) ⬍6 (noted whether sedatives were used). Blood urea nitrogen (BUN) ⱖ40 mg/dl or creatinine ⱖ2.0 mg/dl for patients with no previous history of renal disease, an increase in creatinine ⬎1 mg/dl for patients with preexisting renal disease. White blood cell count (WBC) ⱕ1000/mm3, platelets ⬍20,000/mm3, hematocrit ⬍20%, requirement for platelet transfusions to maintain ⬎20,000/mm3 Respiratory rate ⱕ5/min or ⱖ49/min, PaCO2 ⱖ50 mmHg, AaDO2 ⱖ350 mmHg, ventilatordependent after 24 h of OSF Acute liver failure with elevations in bilirubin levels (total and direct), AST and ALT, and alkaline phosphatase greater than two times normal, increase in prothrombin time and INR of ⬎1.5 (for patients with preexisting chronic liver disease, documented evidence of worsened liver function, and presence of encephalopathy).
a PaCO2, arterial carbon dioxide tension; AaDO2, alveolar-arterial oxygen difference; OSF, oxygen system failure; AST, asparate aminotransferase; ALT, alanine aminotransferase; INR, international normalized ratio.
1352
Journal of the American Society of Nephrology
inclusion of a “missing” term in the multivariable regression model. In no case was the “missing” variable significant or nearly so. Similarly, where continuous variables were missing, the mean value was imputed and a “missing” term was included in the multivariable regression model. None of the final model covariates were missing in more than 5% of patients. Competing models were ranked by their ⫺2 log likelihood 2. Variables excluded during either the initial phase or after cluster analyses were re-entered individually to evaluate for residual confounding, defined as a change of ⱖ10% in one or more parameter estimates. Discrimination was assessed using the area under the receiver operating characteristic (ROC) curve (35). Calibration was assessed using the Hosmer-Lemeshow goodness of fit test (36). The HosmerLemeshow test compares model performance (observed versus expected) across deciles of risk to test whether the model is biased (i.e., performs differentially at the extremes of risk). A nonsignificant value for the Hosmer-Lemeshow 2 suggests an absence of such bias. Overall model performance was also assessed with the likelihood ratio. A likelihood ratio indicates the degree to which the pretest probability of an event is altered by information provided by a test, or in this case, a predictive model. The higher a model’s likelihood ratio, the greater the probability of accurately predicting events. The final model was validated using the bootstrapping technique (37,38). This procedure involves sampling (with replacement) and refitting models on 100 distinct 605-patient samples derived from the study population. Model parameter estimates, OR, and 95% CI were recalculated on the basis of the larger variation created by the bootstrapped samples. Ranges of mortality rates and areas under the ROC curve were also calculated. P ⬍ 0.05 was considered statistically significant. All analyses were conducted using SAS Versions 7 and 8 (SAS Institute, Cary, NC).
Results Patients Of the 605 patients in the analytic sample, 185 (21.7%) were randomized into a clinical trial (19 in pilot phase, 166 in study proper) comparing IHD and CRRT. Details of the study’s inclusion and exclusion criteria are available elsewhere (25). Two hundred and forty additional patients (28.2%) required some form of dialysis during their ICU stay; 147 (17.3%) received IHD, and 93 (10.9%) CRRT. Approximately half (50.1%) of patients did not undergo dialysis. Patient characteristics are presented in Table 2, categorized by whether the patient required dialysis and received IHD as the primary dialytic modality or received CRRT as the primary dialytic modality and did not require dialysis during the ICU or hospital stay. For this presentation, dynamic variables (e.g., hemodynamic parameters, laboratory studies) were determined on the day of nephrology consultation. After the predictive model was developed in the entire cohort, it was retested in prespecified subgroups to gauge its generalizability.
J Am Soc Nephrol 13: 1350–1357, 2002
Table 2. Patient characteristics (day of nephrology consultation)a Characteristic
Total Dialysis Nondialysis
n 605 Demographic mean age 56.0 % male 71.6 % white 59.5 % 65 yr ⫹ 39.0 % surgical 62.3 % oliguria 30.2 % ARF on CRI 23.1 Etiology % ischemic 37.9 % nephrotoxic 14.7 % multisystem 2.0 % multifactorial 13.6 % unknown 21.8 Mortality and LOS % hospital mortality 51.9 % ICU mortality 45.1 % 28-d mortality 46.1 % recovery 42.8 mean hospital LOS 33.7 mean ICU LOS 13.1 Renal functional indicators mean BUN 65.7 mean creatinine 3.7 mean UO 1411 Physiologic indicators mean MAP 79.5 CVP 15.0 PCWP 19.3 CO 7.6 CI 4.1 SVR 829 98.9 PO2 PCO2 35.9 pH 7.4
P
358
247
55.5 74.0 59.8 37.2 62.2 41.9 23.5
56.7 68.0 59.1 41.7 62.4 13.5 22.7
NS NS NS NS NS ⬍0.001 NS
42.5 15.4 2.2 15.9 24.0
31.2 13.8 1.6 10.1 18.6
0.005 NS NS 0.04 NS
61.5 55.6 54.2 29.1 31.9 15.2
38.1 30.0 34.4 62.8 36.4 10.0
⬍0.001 ⬍0.001 ⬍0.001 ⬍0.001 NS 0.003
66.4 4.0 971
64.7 3.3 2042
NS ⬍0.001 ⬍0.001
79.6 16.2 19.1 7.8 4.2 755 95 36.5 7.3
79.4 13.1 19.7 7.1 3.8 977 105 34.8 7.4
NS ⬍0.001 NS NS NS 0.01 0.03 NS 0.01
a ARF, acute renal failure; CRI, chronic renal insufficiency; LOS, length of stay; BUN, blood urea nitrogen; UO, urine output; MAP, mean arterial pressure; CVP, central venous pressure; PCWP, pulmonary capillary wedge pressure; CO, cardiac output; CI, cardiac index; SVR, systemic vascular resistance; PO2, partial pressure of oxygen; PCO2, partial pressure of carbon dioxide.
hospital death on bivariate analysis. Variables associated with the odds of in-hospital death are shown in Table 3.
Correlates of Mortality
Multivariable Analyses
Three hundred and fourteen patients (51.9%) died in hospital. Among the demographic variables, age (RR, 1.002; 95% CI, 0.99 to 1.01), gender (RR, 1.40; 95% CI, 0.98 to 1.99), and race were not significantly associated with the odds of in-
Logistic regression was chosen as the primary multivariable analytic method, as it requires fewer assumptions than proportional hazards regression and allows direct comparison of model discrimination and calibration with other generic and
J Am Soc Nephrol 13: 1350–1357, 2002
Predictive Models of Acute Renal Failure
Table 5. Bootstrapped OR and 95% CI (100 sample) of existing model
Table 3. Bivariate correlates of mortality (day of consultation)a Parameter
OR
95% CI
P
Parameter
OR
95% CI
Respiratory failure Liver failure Hematologic failure Heart failure CNS failure Hypertension Past renal disease Chemotherapy Creatinine Log urine output Albumin Bilirubin Cardiac arrhythmias
4.15 5.37 5.90 1.68 3.56 0.68 0.53 2.01 0.83 0.64 0.71 1.09 1.14
2.89 to 5.95 3.61 to 7.99 3.85 to 9.03 1.19 to 2.37 2.46 to 5.13 0.51 to 0.89 0.37 to 0.76 1.02 to 3.98 0.77 to 0.90 0.57 to 0.73 0.53 to 0.95 1.05 to 1.13 1.04 to 1.24
⬍ 0.0001 ⬍ 0.0001 ⬍ 0.0001 0.003 ⬍ 0.0001 0.006 0.001 0.045 ⬍ 0.0001 ⬍ 0.0001 0.02 ⬍ 0.0001 0.004
Agea Male gender Respiratory failure Liver failure Hematologic failure Creatinine BUN Log urine output Heart Rateb
1.02 2.35 2.73 3.09 3.39 0.70 1.02 0.63 1.01
1.00 to 1.03 1.50 to 3.73 1.65 to 4.53 1.89 to 5.05 2.08 to 5.52 0.62 to 0.80 1.01 to 1.02 0.52 to 0.77 1.00 to 1.02
a
1353
a b
Lower limit, 1.004. Lower limit, 1.003.
⫹ 共0.0119*heart rate兲
OR, odds ratio; 95% CI, 95% confidence interval.
⫺ 共0.4432*log关urine output兴兲 ⫺ 0.7207 disease-specific predictive models. As noted above, closely related variables (e.g., thrombocytopenia and “hematologic failure,” hyperbilirubinemia and “liver failure”) were compared in nested logistic regression models to determine which variable (by 2) was a better predictor of mortality. Later, the variables not selected within the nested analyses were reexamined in full multivariable models. Table 4 shows the nine variables included in the final logistic regression model. The logistic regression equation is listed below.
Log odds of death ⫽ 共 0.0170*age 兲
Note that age and gender were added to the model because both confound the relation between serum creatinine and renal function and because both may influence the risk for and manifestations of organ failure. When added to the model adjusting for organ failure, BUN, and creatinine, age and gender were significantly associated with the risk of death. The results using proportional hazards regression were similar to those using logistic regression, with similar hazard ratios (RR). In addition to the variables listed above, systolic BP (lower levels associated with increased mortality) was also a significant predictor in the proportional hazards (Cox) model.
⫹ 共 0.8605*male sex 兲
Model Validation Using Bootstrapping
⫹ 共 0.0144*BUN 兲 ⫺ 共 0.3398*Cr 兲
We ran 100 (605-patient) bootstrap samples on the data. The number of patients who died in hospital ranged from 283 (46.8%) to 357 (59.0%). The areas under the ROC curve ranged from 0.795 to 0.890. Table 5 shows the calculated OR and 95% CI for each of the variables in the original equation, all of which were validated by the bootstrap methodology. In other words, the model is not likely to be excessively overfit to the existing data set.
⫹ 共 1.2242*hematologic failure 兲 ⫹ 共 1.1183*liver failure 兲 ⫹ 共 0.9637*respiratory failure 兲
Comparing Model Performance with Generic and other Disease-Specific Indices
Table 4. Multivariable logistic regression model for mortality in ARF (day of consultation) Parameter
OR
95% CI
2
P
Age Male gender Respiratory failure Liver failure Hematologic failure Creatinine BUN Log urine output Heart rate
1.02 2.36 2.62 3.06 3.40 0.71 1.02 0.64 1.01
1.01 to 1.03 1.48 to 3.77 1.70 to 4.04 1.90 to 4.93 2.03 to 5.70 0.63 to 0.81 1.01 to 1.02 0.54 to 0.76 1.00 to 1.02
7.42 13.02 19.14 21.05 21.62 26.88 18.93 27.16 5.66
0.007 0.001 ⬍ 0.0001 ⬍ 0.0001 ⬍ 0.0001 ⬍ 0.0001 ⬍ 0.0001 ⬍ 0.0001 0.02
To evaluate the predictive model against other models, including APACHE II, APACHE III, and other widely used generic severity of illness models, we compared the likelihood ratio and area under the ROC curve to determine the explanatory and discriminative power of the new model relative to seven generic models and the Hosmer-Lemeshow goodnessof-fit test to check the models’ calibration (Table 6). We also compared the new model with five ARF-specific models previously applied to patients with ARF before the need for eventual dialysis was determined. Table 7 shows the new model’s performance within prespecified subgroups, including patients with acute versus acute or chronic renal failure, dial-
1354
Journal of the American Society of Nephrology
J Am Soc Nephrol 13: 1350–1357, 2002
Table 6. Model performance (day of consultation)a Model
Mehta APACHE II APACHE III SAPS2 LOD MOD SOFA Brussels ((31)) Liano et al. ((10)) Schaefer et al. ((19)) ANP Study ((24)) SHARF SHARF II CCF
Likelihood Ratio
Area under ROC Curve
95% CI Area under ROC curve
Hosmer-Lemeshow Goodness-of-Fit P
234.7 32.4 105.7 134.1 103.4 108.8 129.5 98.6 33.4 43.5 96.6 39.9 98.3 49.5
0.832 0.634 0.756 0.766 0.734 0.735 0.756 0.726 0.630 0.650 0.726 0.645 0.733 0.718
(0.80, 0.86) (0.59, 0.68) (0.72, 0.80) (0.73, 0.80) (0.69, 0.77) (0.70, 0.77) (0.72, 0.79) (0.69, 0.77) (0.59, 0.67) (0.61, 0.69) (0.69, 0.77) (0.60, 0.69) (0.69, 0.77) (0.67, 0.75)
0.86 0.78 0.19 0.03 0.26 0.10 0.35 0.94 0.16 0.06 0.59 0.54 0.03 0.002
a APACHE, Acute Physiology and Chronic Health Evaluation; SAPS, Simplified Acute Physiology Score; LOD, Logistic Organ Dysfunction Score; MOD, Multiple Organ Dysfunction; SOFA, Sequential Organ Failure Assessment; SHARF, Steuvenberg Hospital Acute Renal Failure; CCF, Cleveland Clinic Foundation (score originally developed on patients with ARF requiring dialysis, rather than all consulted patients with ARF).
Table 7. Performance of model in prespecified subgroups Data Sample (n)
All (605) ARF on first ICU day (282) No ARF on first ICU day (323) ARF on CRI (140) New onset ARF (465) Dialysis (358)a Nondialysis (247)
Likelihood Ratio
Area under ROC Curve
Hosmer-Lemeshow Goodness-of-Fit P
234.7 129.4 115.3 56.8 179.2 126.2 94.9
0.832 0.860 0.817 0.840 0.832 0.829 0.824
0.86 0.59 0.94 0.18 0.96 0.92 0.13
a CCF score was applied to the ARF requiring dialysis population: likelihood ratio, 89.7; area under ROC curve, 0.781; HosmerLemeshow goodness-of-fit P ⫽ 0.14.
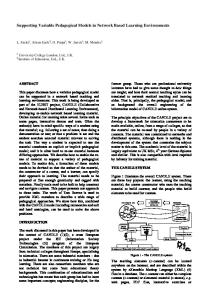
ysis versus no dialysis, and timing of ARF relative to ICU admission. Finally, Table 8 shows the range, accuracy, and calibration of the model by deciles of risk, showing that the new model accurately predicts mortality risks ranging from ⬍10% to ⬎90%. Figure 1 shows the ROC curves for the new model and generic (panel A) and other disease-specific (panel B) models.
Discussion Risk adjustment in critically ill patients has proved essential to appropriate clinical management, quality improvement, and health resource utilization. Numerous comorbidity indices and severity of illness scores have been developed, many incorporating “all comers” to an ICU setting, such as the APACHE II and APACHE III scores, the Mortality Prediction Model (MPM), SAPS, and several others (26 –28). Although these have proved invaluable to the critical care physician and other
Table 8. Observed versus predicted mortality across risk deciles Deciles (Patient n)
1(60) 2(61) 3(60) 4(61) 5(60) 6(61) 7(61) 8(60) 9(61) 10(60)
% Mortality Predicted
Observed
7.8 17.3 27.3 35.7 45.8 55.0 66.3 78.3 89.2 96.2
8.3 19.7 31.7 29.5 50.0 50.8 65.6 75 91.8 96.7
J Am Soc Nephrol 13: 1350–1357, 2002
Figure 1. Receiver operating characteristic (ROC) curves for the Mehta model and other generic (A) and disease-specific (B) predictive models. The y-axis is sensitivity and the x-axis is 1-specificity.
members of the healthcare team and have been used extensively for risk adjustment in several clinical trials in ARF (5,12–13,35,36), we and others have shown that these indices fall short of accurately predicting mortality in the subgroup of patients with ARF (16 –19). Fiaccadori et al. (15) recently evaluated the performance of the APACHE II, SAPS II, and MPM III models in a single-center cohort of patients with ARF and demonstrated that two of the three generic scoring systems performed relatively poorly, with areas under the ROC curves of 0.75, 0.77, and 0.85 for the APACHE II, SAPS II, and MPM models, respectively. One could conclude that the model derived here (Mehta model) performed better than the other models, as the likelihood ratio was highest and the 95% confidence limits of the area under the ROC curve showed no overlap with generic or disease-specific models (Table 6, column 4). The mediocre performance of generic models can be anticipated, because these models were developed from unselected ICU admissions, only a small fraction of whom had ARF. Moreover, indicators of renal function are among the key predictors in these scores, so that a generic index will typically underperform in a population uniformly affected with ARF. More recently, organ-scoring systems have been developed that use a more qualitative strategy to describe the underlying
Predictive Models of Acute Renal Failure
1355
severity of illness (29 –32). Although these scores have been validated in patients with sepsis (39), they have not been previously evaluated specifically in patients with ARF. Although the organ-specific scoring systems performed somewhat better than the APACHE II, SAPS, and MPM models, they were not well calibrated and tended to overestimate mortality (40). To address these limitations, several investigators have attempted to develop disease-specific (in this case, ARF-specific) indices to improve predictive power. Lian˜ o et al. (2,10) have made major contributions in this area. The Acute Tubular Necrosis Severity Scoring Index (ATN-ISS) was derived and later validated in hospitals in Spain and elsewhere (10,23,41). The ATN-ISS is a linear discriminant model producing a percent likelihood of mortality on the basis of a variety of physiologic and laboratory parameters. Although useful in many investigators’ and clinicians’ hands, we have found the inclusion of the Glasgow Coma Scale score difficult to determine due to effects related to the use of sedative, analgesic, and paralytic agents. Moreover, this severity score has been limited to patients with ATN, who comprise most but not all patients with ARF in the ICU. Paganini et al. (21) developed and subsequently validated a model based on experience in more than 1000 ICU patients at the Cleveland Clinic Foundation (CCF). Although apparently robust, this model has been derived in the subset of ARF patients requiring dialysis, and hence is not applicable to “all comers” with ARF in the ICU. Indeed, the CCF model did not perform as well when applied to the entire population (Table 6) compared with the patients who required dialysis (Table 7). Among the important differences in a dialysis-only severity score and one applicable to patients at an earlier stage of ARF is the association between oliguria and mortality and the need for dialytic support. Indeed, in this study, urine output was among the most important variables. In the model developed by Paganini et al. (21), oliguria is associated with either no difference or a slight decrease in the risk of death relative to non-oliguria. To provide the clinician with the most valuable information, a model that accurately predicts outcome early in the course of ARF is most desirable. This quality would be essential if such a model were to be used for risk stratification in an early therapeutic intervention trial in ARF. Of the model parameters identified in this study, advanced age and organ systems failure might be expected to be associated with mortality. It is unclear why male gender is associated with a two-fold increase in the risk of death with ARF, although Paganini et al. (21) and Chertow et al. (24) found a similar magnitude of excess risk among men. It is unlikely that it is related to the fact that creatinine generation is generally higher in men and that nephrology consultation may be more likely with higher serum creatinine (42). If this were the case, then the average severity of renal injury in men would be less than that in women at a given serum creatinine concentration; therefore, one might expect a higher risk of death in women with ARF. Although BUN and creatinine are both metabolic waste products that accumulate in ARF and generally track together, they exhibit opposite associations in this model, with
1356
Journal of the American Society of Nephrology
higher BUN and lower creatinine concentrations being associated with an increased risk of death. Paganini et al. (21) noted a similar pattern in the CCF cohort. Higher BUN may be associated with increased protein catabolism, a subtle sign of metabolic stress. Low serum creatinine, particularly after adjustment for age and gender, probably reflects loss of muscle mass; however, it could also be related to volume overload or inflammation, whereas BUN may be affected by additional factors (e.g., gastrointestinal bleeding, nutritional supplementation, and corticosteroid use), potentially overcompensating for the volume-related effect. There are several important limitations to this study. First, resources were insufficient to allow full collection of data required for calculation of severity scores in all 851 patients. However, there were no significant differences in demographic characteristics or comorbid conditions in patients who were not included in these analyses (data not shown), suggesting that no major bias was introduced. Second, we were limited by the frequency of measurement of some physiologic and laboratory variables that might be significantly associated with mortality. For instance, elevated pulmonary capillary wedge pressure might be associated with ARF, but it was not measured in the majority of patients. Indeed, the inclusion of infrequently observed yet potent risk factors (e.g., ventricular fibrillation) may result in improved discrimination of a model but also increases the risk of the model being overfit, rendering it less useful for broader use, as in a clinical trial. Third, data on body weight (as an estimate of volume status) were not always available. Volume status influences the concentration of BUN and creatinine (43) and may itself be a predictor of outcome (44); therefore, its absence likely reduced the predictive power of our model. Finally, by definition, this model must be somewhat overfit to the current data set. Although the performance of the model relative to generic and other ARF-specific models was superior, cross-validation of the model will be required to securely demonstrate its validity. Such an endeavor is underway using data collected prospectively from five academic medical centers that comprise the PICARD (Project to Improve Care in Acute Renal Disease) consortium. In summary, using data collected from more than 600 patients with ARF in the ICU, we developed a regression model predicting in-hospital mortality using only readily available clinical data. Included among the predictor variables were advanced age, male gender, respiratory, liver, and hematologic failure (determined by specific criteria), diminished urine output, elevated BUN, diminished creatinine, and elevated heart rate. This model was superior to generic and other ARFspecific models. This and other models like it will be essential tools in the design and implementation of future clinical trials in critical care nephrology. Cross-validation of this model or its next generation will be required to accurately assess its performance relative to other risk adjustment tools.
Acknowledgments We thank the members of the Collaborative Group for Treatment of ARF in the ICU comprised of University of California San Diego Medical Center, San Diego, California; U.S. Naval Medical Center,
J Am Soc Nephrol 13: 1350–1357, 2002
San Diego, California; Veterans Affairs Medical Center, San Diego, California; and University of California Irvine, Irvine, California for providing us with the data for analysis. We also acknowledge the help of the PICARD group for their thoughtful review of this manuscript. Members of the PICARD group include: Dr. Emil Paganini, Dr. Jonathan Himmelfarb, Dr. T. Alp Ikizler, Dr. Tom Greene, Stephanie Freedman, Susan Robertson, Michelle Garcia, Tracy Siefert, Cita Gruta, Karen Wallenfelsz, Tiffany Buchanan, and Rachel Manaster. This study was presented in abstract form for the 33rd Annual Meeting of the American Society of Nephrology, Toronto, Ontario, October 2000. The work was supported by the National Institutes of Health, National Institute of Diabetes, Digestive, and Kidney Diseases (NIHNIDDK RO1-DK53412-0).
Appendix University of California San Diego Medical Center Hospitals (UCSDMC, A 450-bed tertiary care hospital with Level 1 Trauma facility; Thornton Hospital, A 120-bed tertiary care hospital); US Naval Medical Center (a 700-bed tertiary care hospital providing medical care to active duty personnel, their dependents, and retirees in the San Diego area); Veterans Administration Medical Center, San Diego, California (a 355bed tertiary care center providing a broad spectrum of programs and services for veterans residing in San Diego, Imperial, and the southern portion of San Bernadino counties); University of California Irvine Medical Center, Irvine, California (a 400-bed tertiary care level 1 trauma facility serving Orange County and vicinities).
References 1. Cole L, Bellomo R, Silvester W, Reeves JH: A prospective, multicenter study of the epidemiology, management, and outcome of severe acute renal failure in a “closed” ICU system. Am J Respir Crit Care Med 162: 191–196, 2000 2. Lian˜ o F, Pascual J: Outcomes in acute renal failure. Semin Nephrol 18: 541–550, 1998 3. Star RA: Treatment of acute renal failure. Kidney Int 54: 1817– 1831, 1998 4. Oudemans-van Straaten HM, Bosman RJ, van der Spoel JI, Zandstra DF: Outcome of critically ill patients treated with intermittent high-volume haemofiltration: A prospective cohort analysis. Intensive Care Med 25: 814 – 821, 1999 5. Ronco C, Bellomo R, Homel P, Brendolan A, Dan M, Piccinni P, La Greca G: Effects of different doses in continuous venovenous haemofiltration on outcomes of acute renal failure: A prospective randomised trial. Lancet 356: 26 –30, 2000 6. Karsou SA, Jaber BL, Pereira BJ: Impact of intermittent hemodialysis variables on clinical outcomes in acute renal failure. Am J Kidney Dis 35: 980 –991, 2000 7. Nair P, Bihari D: Acute renal failure in the ICU in the 1990s— “Anything goes”? Intensive Care Med 23: 1193–1196, 1997 8. DuBose TD Jr, Warnock DJ, Mehta RL, Bonventre JV, Hammerman MR, Molitoris BA: Acute renal failure in the 21st century: recommendations for management and outcomes assessment. Am J Kidney Dis 29: 793–799, 1997 9. Swartz RD, Messana JM, Orzol S, Port FK: Comparing continuous hemofiltration with hemodialysis in patients with severe acute renal failure. Am J Kidney Dis 34: 424 – 432, 1999 10. Lian˜ o F, Gallego A, Pascual J, Garcia-Martin F, Teruel JL, Marcen R, Orofino L, Orte L, Rivera M, Gallego N, et al:
J Am Soc Nephrol 13: 1350–1357, 2002
11.
12.
13.
14. 15.
16.
17.
18.
19.
20.
21.
22.
23. 24.
25.
26.
Prognosis of acute tubular necrosis: An extended prospectively contrasted study. Nephron 63: 21–31, 1993 Bihari D, Daly K: Outcome and quality of life after treatment with hemofiltration and hemodiafiltration [letter] Intensive Care Med 24: 93–94, 1998 Hirschberg R, Kopple J, Lipsett P, Benjamin E, Minei J, Albertson T, Munger M, Metzler M, Zaloga G, Murray M, Lowry S, Conger J, McKeown W, O’Shea M, Baughman R, Wood K, Haupt M, Kaiser R, Simms H, Warnock D, Summer W, Hintz R, Myers B, Haenftling K, Capra W, Pike M, Guler H-P: Multicenter clinical trial of recombinant human insulin-like growth factor I in patients with acute renal failure. Kidney Int 55: 2423–2432, 1999 Lewis J, Salem MM, Chertow GM, Weisberg LS, McGrew F, Marbury TC, Allgren RL: Atrial natriuretic factor in oliguric acute renal failure. Anaritide Acute Renal Failure Study Group. Am J Kidney Dis 36: 767–774 2000 Paller MS: Acute renal failure: controversies, clinical trials, and future directions. Semin Nephrol 18: 482– 489, 1998 Fiaccadori E, Maggiore U, Lombardi M, Leonardi S, Rotelli C, Borghetti A: Predicting patient outcome from acute renal failure comparing three general severity of illness scoring systems. Kidney Int 58: 283–292, 2000 Parker RA, Himmelfarb J, Tolkoff-Rubin N, Chandran P, Wingard RL, Hakim RM: Prognosis of patients with acute renal failure requiring dialysis: Results of a multicenter study. Am J Kidney Dis 32: 432– 43, 1998 Douma CE, Redekop WK, van der Meulen JH, van Olden RW, Haeck J, Struijk DG, Krediet RT: Predicting mortality in intensive care patients with acute renal failure treated with dialysis. J Am Soc Nephrol 8: 111–117, 1997 van Bommel EF, Bouvy ND, Hop WC, Bruining HA, Weimar W: Use of APACHE II classification to evaluate outcome and response to therapy in acute renal failure patients in a surgical intensive care unit. Renal Failure 17: 731–742, 1995 Schaefer J-H, Jochimsen F, Keller F, Wegscheider K, Distler A: Outcome prediction of acute renal failure in medical intensive care. Intensive Care Med 17: 19 –24, 1991 Lohr JW, McFarlane MJ, Grantham JJ: A clinical index to predict survival in acute renal failure patients requiring dialysis. Am J Kidney Dis 11: 254 –259, 1988 Paganini EP, Halstenberg WK, Goormastic M: Risk modeling in acute renal failure requiring dialysis: The introduction of a new model. Clin Nephrol 46: 206 –211, 1996 Lins RL, Elseviers M, Daelemans R, Zache´ e P, Zache´ e P, Gheuens E, Lens S, De Broe ME: Prognostic value of a new scoring system for hospital mortality in acute renal failure. Clin Nephrol 53: 10 –17, 2000 Lian˜ o, F: Severity of acute renal failure: The need of measurement. Nephrol Dial Transplant 9(Suppl 4): 229 –38, 1994 Chertow GM, Lazarus JM, Paganini EP, Allgren RL, Lafayette RA, Sayegh MH: Predictors of mortality and the provision of dialysis in patients with acute tubular necrosis. The Auriculin Anaritide Acute Renal Failure Study Group. J Am Soc Nephrol 9: 692– 698, 1998 Mehta RL, McDonald B, Gabbai FB, Pahl M, Pascual MA, Farkas A, Kaplan R: A randomized clinical trial of continuous vs. intermittent dialysis for acute renal failure. Kidney Int, 60: 1154 – 63, 2001 Knaus WA, Draper EA, Wagner DP, Zimmerman JE: APACHE II: A severity of disease classification system. Crit Care Med 13: 818 – 829, 1985
Predictive Models of Acute Renal Failure
1357
27. Knaus WA, Wagner DP, Draper EA, Zimmerman JE, Bergner M, Bastos PG, Sirio CA, Murphy DJ, Lotring T, Damiano A: The APACHE III prognostic system: Risk prediction of hospital mortality for critically ill hospitalized adults. Chest 100: 1619 – 1636, 1991 28. Le Gall JR, Lemeshow S, Saulnier F: A new Simplified Acute Physiology Score (SAPS II) based on a European/North American multicenter study. JAMA 270: 2957–2963, 1993 29. Le Gall JR, Klar J, Lemeshow S, Saulnier F, Alberti C, Artigas A, Teres D: The Logistic Organ Dysfunction System: A new way to assess organ dysfunction in the intensive care unit. JAMA 276: 802– 810, 1996 30. Marshall JC, Cook DJ, Christou NV, Bernard GR, Sprung CL, Sibbald WJ: Multiple organ dysfunction score: A reliable descriptor of a complex clinical outcome. Crit Care Med 23: 1638 –1652, 1995 31. Bernard G: The Brussels Score. Sepsis 1: 43– 44, 1997 32. Vincent JL, Moreno R, Takala J, Willatts S, De Mendonca A, Bruining H, Reinhart CK, Suter PM, Thijs LG: The SOFA (Sepsis-related Organ Failure Assessment) score to describe organ dysfunction/failure. Working Group on Sepsis-Related Problems of the European Society of Intensive Care Medicine. Intensive Care Med 22: 707–710, 1996 33. Collett D: Modelling Survival Data in Medical Research. London, Chapman and Hall, 1994 34. Chang RWS, Jacobs S, Lee B, Pace N: Predicting deaths among intensive care unit patients. Crit Care Med 16: 34 – 42, 1988 35. Hanley JA, McNeil BJ: The meaning and use of the area under a receiver operating characteristic (ROC) curve. Radiology 143: 29 –36, 1982 36. Lemeshow S, Hosmer DW Jr: A review of goodness of fit statistics for use in the development of logistic regression models. Am J Epidemiol 115: 92–106, 1982 37. Efron B, Tibshirani RJ: An Introduction to the Bootstrap. New York, Chapman and Hall, 1993 38. Young GA: Bootstrap: More than just a stab in dark. Stat Sci 9: 382– 415, 1994 39. Moreno R, Vincent JL, Matos R, Mendonca A, Cantraine F, Thijs L, Takala J, Sprung C, Antonelli M, Bruining H, Willatts S: The use of maximum SOFA score to quantify organ dysfunction/failure in intensive care. Results of a prospective, multicentre study. Working Group on Sepsis related Problems of the ESICM. Intensive Care Med 25: 686 – 696, 1999 40. de Mendonca A, Vincent JL, Suter PM, Moreno R, Dearden NM, Antonelli M, Takala J, Sprung C, Cantraine F: Acute renal failure in the ICU: Risk factors and outcome evaluated by the SOFA score. Intensive Care Med 26: 915–921, 2000 41. Lian˜ o F, Junco E, Pascual J, Madero R, Verde E: The spectrum of acute renal failure in the intensive care unit compared with that seen in other settings. The Madrid Acute Renal Failure Study Group. Kidney Int Suppl 66: S16 –S24, 1998 42. Mehta RL, Farkas A, Pascual M, Fowler W, Zhuang S, Chertow GM: Delayed nephrology consultation is associated with increased mortality in acute renal failure. Am J Med, in press 43. Moran SM, Myers BD: Course of acute renal failure studied by a model of creatinine kinetics. Kidney Int 27: 928 –37, 1985 44. Lowell JA, Schifferdecker C, Driscoll DF, Benotti PN, Bistrian BR: Postoperative fluid overload: not a benign problem. Crit Care Med 18: 728 –733, 1990