Reducing the Computational Complexity of Multimicrophone Acoustic Models with Integrated Feature Extraction Tara N. Sainath, Arun Narayanan, Ron J. Weiss, Ehsan Variani, Kevin W. Wilson, Michiel Bacchiani, Izhak Shafran Google, Inc., New York, NY 10011 {tsainath, arunnt, ronw, variani, kwwilson, michiel, izhak}@google.com
Abstract Recently, we presented a multichannel neural network model trained to perform speech enhancement jointly with acoustic modeling [1], directly from raw waveform input signals. While this model achieved over a 10% relative improvement compared to a single channel model, it came at a large cost in computational complexity, particularly in the convolutions used to implement a time-domain filterbank. In this paper we present several different approaches to reduce the complexity of this model by reducing the stride of the convolution operation and by implementing filters in the frequency domain. These optimizations reduce the computational complexity of the model by a factor of 3 with no loss in accuracy on a 2,000 hour Voice Search task.
1. Introduction Multichannel ASR systems often use separate modules to perform recognition. First, microphone array speech enhancement is applied, typically broken into localization, beamforming and postfiltering stages. The resulting single channel enhanced signal is passed to an acoustic model [2, 3]. A commonly used enhancement technique is filter-and-sum beamforming [4], which begins by aligning signals from different microphones in time (via localization) to adjust for the propagation delay from the target speaker to each microphone. The time-aligned signals are then passed through a filter (different for each microphone) and summed to enhance the signal from the target direction and to attenuate noise coming from other directions [5, 6, 7]. Instead of using independent modules for multichannel enhancement and acoustic modeling, optimizing both jointly has been shown to improve performance, both for Gaussian Mixture Models [8] and more recently for neural networks [1, 9, 10]. We recently introduced one such “factored” raw waveform model in [1], which passes a multichannel waveform signal into a set of short-duration multichannel time convolution filters which map the inputs down to a single channel, with the idea that the network would learn to perform broadband spatial filtering with these filters. By learning several filters in this “spatial filtering layer”, we hypothesize that the network will learn filters tuned to multiple different look directions. The single channel waveform output of each spatial filter is passed to a longer-duration time convolution “spectral filtering layer” intended to perform finer frequency resolution spectral decomposition analogous to a time-domain auditory filterbank as in [9, 11]. The output of this spectral filtering layer is passed to a CLDNN acoustic model [12]. One of the problems with the factored model is its high computational cost. For example, the model presented in [1]
uses around 20M parameters but requires 160M multiplies, with the bulk of the computation occurring in the “spectral filtering layer”. The number of filters in this layer is large and the input feature dimension is large compared to the filter size. Furthermore, this convolution is performed for each of 10 look directions. The goal of this paper is to explore various approaches to speed up this model without affecting accuracy. First, we explore speeding up the model in the time domain. Using behavior we observed in [1, 13] with convolutions, we show that by striding filters and limiting the look directions we are able to reduce the required number of mulitplies by a factor of 4.5 with no loss in accuracy. Next, since convolution in time is equivalent to an elementwise dot product in frequency, we present a factored model that operates in the frequency domain. We explore two variations on this idea, one which performs filtering via a Complex Linear Projection (CLP) [14] layer that uses phase information from the input signal, and another which performs filtering with a Linear Projection of Energy (LPE) layer that ignores phase. We find that both the CLP and LPE factored models perform similarly, and are able to reduce the number of multiplies by an additional 25% over time domain model, with similar performance in terms of word error rate (WER). We provide a detailed analysis on the differences in learning the factored model in the time and frequency domains. This duality opens the door to further improve the model. For example increasing the input window size improves WER, but is much more computationally efficient in the frequency domain compared to the time domain.
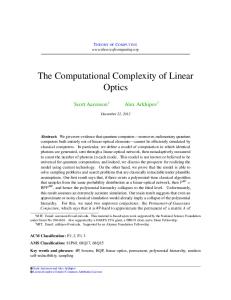
2. Factored Multichannel Waveform Model The raw waveform factored multichannel network [1], shown in Figure 1, factors spatial filtering and filterbank feature extraction into separate layers. The motivation for this architecture is to design the first layer to be spatially selective, while implementing a frequency decomposition shared across all spatial filters in the second layer. The output of the second layer is the Cartesian product of all spatial and spectral filters. The first layer, denoted by tConv1 in the figure, implements Equation 1 and performs a multichannel convolution in time using a FIR spatial filterbank. First, we take a small window of the raw waveform of length M samples for each channel C, denoted as {x1 [t], x2 [t], . . . , xC [t]} for t ∈ 1, . . . , M . The signal is passed through a bank of P spatial filters which convolve each channel c with a filter containing N taps: hc = {h1c , h2c , . . . , hP c }. We stride the convolutional filter by 1 in time across M samples and perform a “same” convolution, such that the output for each convolutional filter remains length M . Finally, the outputs from each channel are summed to create
3. Speedup Techniques 3.1. Speedups in Time
Figure 1: Factored multichannel raw waveform CLDNN for P look directions and C = 2 channels for simplicity. an output feature of size y[t] ∈
C X
xc [t] ∗ hpc
(1)
c=1
The second convolution layer, denoted by tConv2 in Figure 1, consists of longer duration single channel filters. This layer is designed to learn a decomposition with better frequency resolution than the first layer but is incapable of performing any spatial filtering since the input contains a single channel. We perform a time convolution on each of these P output signals from the first layer, as in the single channel time convolution layer described in [11]. The parameters of this time convolution are shared across all P feature maps or “look directions”. We denote this layer’s filters as g ∈
(2)
The filterbank output is then max-pooled in time thereby discarding short-time (i.e. phase) information, over the entire time length of the output signal frame, producing an output of dimension 1 × F × P . This is followed by a rectifier nonlinearity and stabilized logarithm compression1 , to produce a frame-level feature vector at frame l: zl ∈ <1×F ×P . We then shift the input window by 10ms and repeat this time convolution to produce a set of time-frequency-direction frames. The output out of the time convolutional layer (tConv2) produces a frame-level feature z[l] which is passed to a CLDNN acoustic model, which contains 1 frequency convolution, 3 LSTM and 1 DNN layer [11, 12]. 1 We use a small additive offset to truncate the output range and avoid numerical problems with very small inputs: log(· + 0.01).
To understand where the computational complexity lies in the factored model, we count the number of multiplications in the spatial convolution layer from Equation 1. A “same” convolution between filter h of length N , and input xi of length M requires M × N multiplies. Computing this convolution for each channel c in each look direction p results in a total of P × C × M × N multiplies for the first layer. Using C = 2, P = 10, M = 81 (corresponding to 5ms filters) and N = 561 (35ms input size) from [1], corresponds to 908.8K multiplies. Next, we count number of multiplies for the spectral convolution layer, given by Equation 2. A “valid” convolution between filter g of length L, stride S and input yi of length N requires N −L+1 × L multiplies. Computing this convolution S for each look direction p and each filter f results in a total of P × F × L × (N − L + 1)/S multiplies. Following [1], using N = 561 (35 ms input size), L = 401 (25ms filters) P = 10, S = 1, and F = 128, this corresponds to 82.6M multiplies. Layer spatial spectral CLDNN
Total Multiplies P ×C ×M ×N P × F × L × (N − L + 1)/S -
In Practice [1] 908.8K 82.6M 19.5M
Table 1: Computational Complexity in Time The remainder of the CLDNN model uses approximately 20M multiplies [12], leaving the majority of the computation of the factored model in the spectral filtering layer tConv2. Reducing any of the parameters P, N, L, F or increasing S will decrease the amount of computation. Previous work showed that reducing the input window size N , filter size L or filter outputs F degrades performance [1, 10]. We therefore reduce the computational cost (and the number of parameters) by reducing the number of look directions P and increasing in the stride S without degrading performance, which we will show in Section 5. For example, using a stride of S = 4 reduces the number of multiplies by 4 and has been shown to be a good trade-off between cost and accuracy in other applications [13]. 3.2. Speedups in Frequency As an alternative to tuning the parameters of the time domain model, we also investigate implementing the factored model in the frequency domain in which quadratic-time time-domain convolutions can be implemented much more efficiently as linear-time element-wise products. For frame index l and channel c, we denote Xc [l] ∈ CK as the result of an M -point Fast Fourier Transform (FFT) of xc [t] and Hcp ∈ CK as the FFT of hpc . Note that we ignore negative frequencies because the time domain inputs are real, and thus our frequency domain representation of an M -point FFT contains only K = M/2 + 1 unique complex-valued frequency bands. The spatial convolution layer in Equation 1 can be represented by Equation 3 in the frequency domain, where · denotes element-wise product. We denote the output of this layer as Y p [l] ∈ CK for each look direction p: Y p [l] =
C X
Xc [l] · Hcp
(3)
c=1
In this paper, we explore two different methods for implementing the “spectral filtering” layer in the frequency domain.
3.2.1. Complex Linear Projection It is straightforward to rewrite the convolution in Equation 2 as an element-wise product in frequency, for each filter f and look direction p, where Wfp [l] ∈ CK : Wfp [l]
p
= Y [l] · Gf
(4)
The frequency domain equivalent to the max-pooling operation in the time domain model would be to take the inverse FFT of Wfp [l] and performing the same pooling operation in the time domain, which is computationally expensive to do for each look direction p and filter output f . As an alternative [14] recently proposed the Complex Linear Projection (CLP) model which performs average pooling in the frequency domain and results in similar performance to a single channel raw waveform model. Similar to the waveform model the pooling operation is followed by a pointwise absolute-value non-linearity and log compression. The 1dimensional output for look direction p and filter f is given by: N X Zfp [l] = log Wfp [l, k]
(5)
k=1
3.2.2. Linear Projection of Energy We also explore an alternative decomposition that is motivated by the log-mel filterbank. Given the complex-valued FFT for each look direction, Y p [l], we first compute the energy at each time-frequency bin (l, k): Yˆ p [l, k] = |Y p [l, k]|2
(6)
After applying a power compression with α = 0.1, Yˆ p [l] is linearly projected down to an F dimensional space, in a process similar to the mel filterbank, albeit with learned filter shapes: Zfp [l] = Gf × (Yˆ p [l])α
(7)
As in the other models, the projection weights G ∈
Layer spatial spectral - CLP spectral - LPE
Total Multiplies 4×P ×C ×K 4×P ×F ×K P ×F ×K
In Practice 20.6K 1.32M 330.2K
Table 2: Computational Complexity in Frequency
4. Experimental Details We conduct experiments on about 2,000 hours of noisy training data consisting of 3 million English utterances. This data set is created by artificially corrupting clean utterances using a room simulator, adding varying degrees of noise and reverberation. The clean utterances are anonymized and hand-transcribed voice search queries, and are representative of Google’s voice search traffic. Noise signals, which include music and ambient noise sampled from YouTube and recordings of “daily life” environments, are added to the clean utterances at SNRs ranging from 0 to 20 dB. Reverberation is simulated using the image model [15] – room dimensions and microphone array positions are randomly sampled from 100 possible room configurations with RT60 s ranging from 400 to 900 ms. The simulation uses a 2-channel linear microphone array, with inter-microphone spacing of 14 cm. Both noise and target speaker locations change between utterances; the distance between the sound source and the microphone array varies between 1 to 4 meters. The speech and noise azimuths were uniformly sampled from the range of ±45 degrees and ±90 degrees, respectively, for each utterance. The evaluation set consists of a separate set of about 30,000 utterances (over 20 hours), and is created by simulating similar SNR and reverberation settings to the training set. The room configurations, SNR values, RT60 times, and target speaker and noise positions in the evaluation set differ from those in the training set, although the microphone array geometry between the training and simulated test sets is identical. All CLDNN models [12] are trained with the cross-entropy (CE) and sequence training (ST) criterion, using asynchronous stochastic gradient descent (ASGD) optimization [16, 17]. All networks have 13,522 context dependent state output targets.
5. Results 5.1. Parameter Reduction in Time We explore reducing computational complexity of the raw waveform factored model by varying look directions P and stride S. Table 3 shows the WER for CE and ST criteria, as well as the total number of multiplication and addition operations (M+A) for different parameter settings2 . The table shows that we can reduce the number of operations from 157.7M to 88.2M, by reducing the look directions P from 10 to 5, with no loss in accuracy. The stride can also be increased up to S = 4 with no loss in accuracy after ST, which reduces multiplies from 88.2M to 42.5M. Finally, removing the fConv layer from the CLDNN, which we have shown does not help on noisier training sets [18], reduces multiplies further. Overall, we can reduce multiplies from 157.7M to 35.1M, a factor of 4.5x. 5.2. Parameter Reduction in Frequency Next, we explore the performance of the frequency domain factored model. Note this model does not have any fConv layer. We use a similar setting to the best configuration from the previous section, namely P = 5 and F = 128. The input window 2 While Section 3 showed computation in terms of multiplies for simplicity, we report M+A now to be accurate.
P
S
10 5 3 5 5 5 5
1 1 1 2 4 6 4
Spatial M+A 1.1M 525.6K 315.4K 525.6K 525.6K 525.6K 525.6K
Spectral M+A 124.0M 62.0M 37.2M 31.1M 15.7M 10.6M 15.7M
Total M+A 157.7M 88.2M 60.4M 57.4M 42.5M 36.8M 35.1M
WER CE 20.4 20.7 21.6 20.7 20.7 20.9 20.4 no fConv
WER ST 17.2 17.3 17.3
(a) Factored model, time
(b) Factored model, frequency
17.1
Table 3: Raw waveform Factored Model Performance is 32ms instead of 35ms in the waveform model, as this allows us to take a M = 512-point FFT at a sampling rate of 16khZ3 . Table 4 shows that the performance of both the CLP and LPE factored models are similar. Furthermore, both models reduce the number of operations by a factor of 1.9x over the best waveform model from Table 3, with a small degradation in WER. Model CLP LPE
Spatial M+A 10.3K 10.3K
Spectral M+A 655.4K 165.1K
Total M+A 19.6M 19.1M
WER CE 20.5 20.7
WER ST 17.3 17.2
Figure 2: Beampatterns of Time and Frequency Models similar performance. There are roughly 18M parameters in the CLDNN model that sits above the spatial/spectral layers, which accounts for over 90% of the parameters in the model. Any differences between the spatial layers in time and frequency are likely accounted for in the CLDNN part of the network. (a) - Spectral Layer, Raw
(b) - Spectral Layer, CLP
(c) - Spectral Layer, LPE
(b) - Spectral Features, CLP
(c) - Spectral Features, LPE
Table 4: Frequency Domain Factored Model Performance 5.3. Comparison between learning in time vs. frequency Figure 2 shows the spatial responses (i.e., beampatterns) for both the time and frequency domain spatial layers. Since the LPE and CLP models have the same spatial layer and we have found the beampatterns to look similar, we only plot the CLP model for simplicity. The beampatterns show the magnitude response in dB as a function of frequency and direction of arrival, i.e. each horizontal slice of the beampattern corresponds to the filter’s magnitude response for a signal coming from a particular direction. In each frequency band (vertical slice), lighter shades indicate that sounds from those directions are passed through, while darker shades indicate directions whose energy is attenuated. The figures show that the spatial filters learned in the time domain are band-limited, unlike those learned in the frequency domain. Furthermore, the peaks and nulls are aligned well across frequencies for the time domain filters. The differences between these models can further be seen in the magnitude responses of the spectral layer filters, as well as in the outputs of the spectral layers from different look directions plotted for an example signal. Figure 3 illustrates that the magnitude responses in both time and CLP models look qualitatively similar, and learn bandpass filters with increasing center frequency. However, because the spatial layers in time and frequency are quite different, we see that the spectral layer outputs in time are much more diverse in different spatial directions compared to the CLP model. In contrast to these models, the LPE spectral layer does not seem to learn bandpass filters. At some level, time-domain and frequency-domain representations are interchangeable, but they result in networks that are parameterized very differently. Even though the time and frequency models all learn different spatial filters, they all seem to have similar WERs. In addition, even though the spatial layer of the CLP and LPE models are different, they too seem to have 3 A 35ms input requires a 1024-point FFT, and we have not found any performance difference between 32 and 35ms raw waveform inputs.
(a) - Spectral Features, Raw
Figure 3: Time and Frequency Domain Spatial Responses 5.4. Further improvements to frequency models In this section we explore improving WER by increasing the window size (and therefore computational complexity) of the factored models. Specifically, since longer windows typically help with localization [5], we explore using 64ms input windows for both models. With a 64ms input, the frequency models require a 1024-point DFT. Table 5 shows that the frequency models improve the WER over using a smaller 32ms input, and still perform roughly the same. However, the frequency model now has an even larger computational complexity savings of 2.7x savings compared to the time domain model. Feat time freq-CLP freq-LPE
Spatial M+A 906.1K 20.5K 20.5K
Spectral M+A 33.81M 1.3M 329.0K
Total M+A 53.6M 20.2M 19.3M
WER ST 17.1 17.1 16.9
Table 5: Results with a 64ms Window Size
6. Conclusions In this paper, we presented several approaches in both time and frequency to speed up the factored raw-waveform model from [1]. Frequency optimizations allows us to reduce computational complexity by a factor of 3, with no loss in accuracy.
7. References [1] T. N. Sainath, R. J. Weiss, K. W. Wilson, A. Narayanan, and M. Bacchiani, “Factored Spatial and Spectral Multichannel Raw Waveform CLDNNs,” in Proc. ICASSP, 2016. [2] T. Hain, L. Burget, J. Dines, P. Garner, F. Grezl, A. Hannani, M. Huijbregts, M. Karafiat, M. Lincoln, and V. Wan, “Transcribing Meetings with the AMIDA Systems,” IEEE Transactions on Audio, Speech, and Language Processing, vol. 20, no. 2, pp. 486–498, 2012. [3] A. Stolcke, X. Anguera, K. Boakye, O. C ¸ etin, A. Janin, M. Magimai-Doss, C. Wooters, and J. Zheng, “The SRIICSI Spring 2007 Meeting and Lecture Recognition System,” Multimodal Technologies for Perception of Humans, vol. Lecture Notes in Computer Science, no. 2, pp. 450– 463, 2008. [4] J. Benesty, J. Chen, and Y. Huang, Microphone Array Signal Processing. Springer, 2009. [5] B. D. Veen and K. M. Buckley, “Beamforming: A Versatile Approach to Spatial Filtering,” IEEE ASSP Magazine, vol. 5, no. 2, pp. 4–24, 1988. [6] M. Delcroix, T. Yoshioka, A. Ogawa, Y. Kubo, M. Fujimoto, N. Ito, K. Kinoshita, M. Espi, T. Hori, T. Nakatani, and A. Nakamura, “Linear Prediction-based Dereverberation with Advanced Speech Enhancement and Recognition Technologies for the REVERB Challenge,” in REVERB Workshop, 2014. [7] M. Brandstein and D. Ward, Microphone Arrays: Signal Processing Techniques and Applications. Springer, 2001. [8] M. Seltzer, B. Raj, and R. M. Stern, “Likelihoodmaximizing Beamforming for Robust Handsfree Speech Recognition,” IEEE Trascations on Audio, Speech and Language Processing, vol. 12, no. 5, pp. 489–498, 2004. [9] Y. Hoshen, R. J. Weiss, and K. W. Wilson, “Speech Acoustic Modeling from Raw Multichannel Waveforms,” in Proc. ICASSP, 2015. [10] T. N. Sainath, R. J. Weiss, K. W. Wilson, A. Narayanan, M. Bacchiani, and A. Senior, “Speaker Localization and Microphone Spacing Invariant Acoustic Modeling from Raw Multichannel Waveforms,” in Proc. ASRU, 2015. [11] T. N. Sainath, R. J. Weiss, K. W. Wilson, A. Senior, and O. Vinyals, “Learning the Speech Front-end with Raw Waveform CLDNNs,” in Proc. Interspeech, 2015. [12] T. N. Sainath, O. Vinyals, A. Senior, and H. Sak, “Convolutional, Long Short-Term Memory, Fully Connected Deep Neural Networks,” in Proc. ICASSP, 2015. [13] T. N. Sainath and C. Parada, “Convolutional Neural Networks for Small-Footprint Keyword Spotting,” in Proc. Interspeech, 2015. [14] E. Variani, T. N. Sainath, and I. Shafran, “Complex Linear Projection (CLP): A Discriminative Approach to Joint Feature Extraction and Acoustic Modeling,” in submitted to Proc. ICML, 2016. [15] J. B. Allen and D. A. Berkley, “Image Method for Efficiently Simulation Room-Small Acoustics,” Journal of the Acoustical Society of America, vol. 65, no. 4, pp. 943 – 950, April 1979.
[16] J. Dean, G. Corrado, R. Monga, K. Chen, M. Devin, Q. Le, M. Mao, M. Ranzato, A. Senior, P. Tucker, K. Yang, and A. Ng, “Large Scale Distributed Deep Networks,” in Proc. NIPS, 2012. [17] G. Heigold, E. McDermott, V. Vanhoucke, A. Senior, and M. Bacchiani, “Asynchronous Stochastic Optimization for Sequence Training of Deep Neural Networks,” in Proc. ICASSP, 2014. [18] T. N. Sainath and B. Li, “Modeling Time-Frequency Patterns with LSTM vs. Convolutional Architectures for LVCSR Tasks,” in submitted to Proc. Interspeech, 2016.